One of the best things any Mac or iOS developer can do to improve their craft is to simply watch another developer at work in Xcode. Regardless of the number of years or the diversity of projects that make up your experience with the tool, you will undoubtedly notice a neat trick here or there that changes everything about the way you work.
If you were sitting in my office on a typical workday, looking over my shoulder, that would be a little creepy. But one thing you’d notice that differentiates me from many others is the amount of time I spend typing into the Xcode debugger console.
In my experience, other developers fall into three groups when I mention that I use the console almost exclusively when interacting with the debugger:
- Those who share this approach. We exchange high-fives and move on.
- Those who appreciate the console for occasional tricks, but rely mostly on the variables view.
- Those who have never heard of or noticed the console.
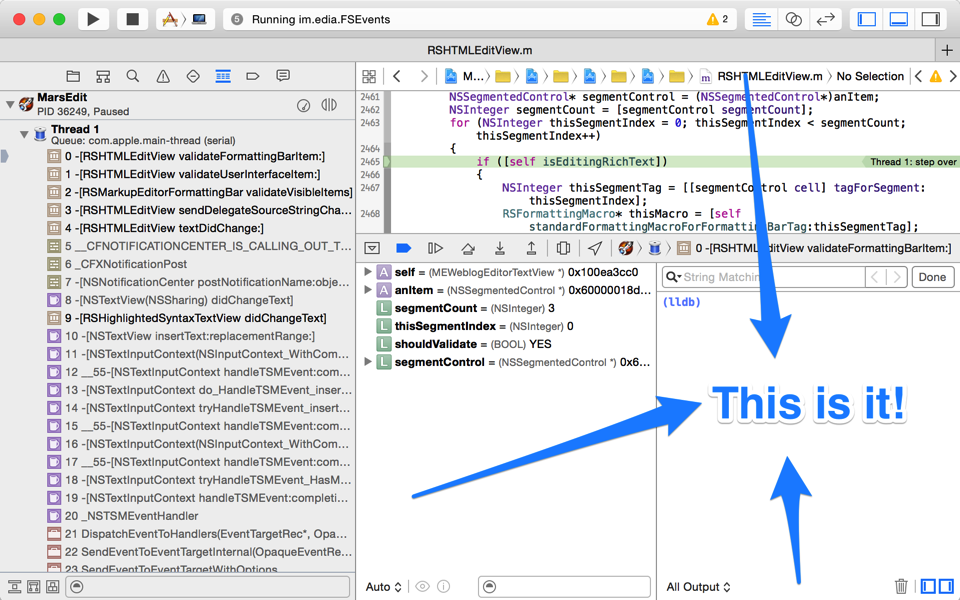
Let’s assume for the sake of argument that you fall into group 3. You can show the console while debugging any process by selecting View -> Debug Area -> Activate Console from the menu bar. In fact, I do this so often that that the keyboard shortcut, Cmd-Shift-C, is completely second-nature to me.

In fact I find the console so useful that it’s not unusual for me to hide much of the other junk, so I can have a mainline connection to the debugger.

So let’s go back again to the uncomfortable assumption that you’re sitting in my office, looking over my shoulder. What would you see me do in the console? All manner of things: For one thing I rarely click those visual buttons for stepping through code. Instead, I use these terse keyboard aliases, inherited from the bad old Gdb days. In lldb, these all come as standard abbreviations of more verbosely named commands:
- n – step over the next line of source
- s – step into the first line of source of a function
- ni – step over the next instruction of assembly code
- si – step into the first instruction of a function
- c – continue
- fin – continue until return from current stack frame
Those are the basics, but another trick, I believe it was called ret in Gdb, comes in handy often:
- thread return – return immediately from the current stack frame
You could use this if you are stuck in some function that is crashed, for example, but you know that returning to the caller would allow the process to continue running as normal. Or, you could use it to completely circumvent a path of code by breaking on a function and bolting right out, optionally overriding the return value. Just to pick an absurd example with flair, let’s stub out AppKit’s +[NSColor controlTextColor]:
(lldb) b +[NSColor controlTextColor]
Breakpoint 1: where = AppKit`+[NSColor controlTextColor], address = 0x00007fff8fb05572
(lldb) break command add
Enter your debugger command(s).  Type 'DONE' to end.
> thread ret [NSColor redColor]
> c
> DONE
(lldb) c
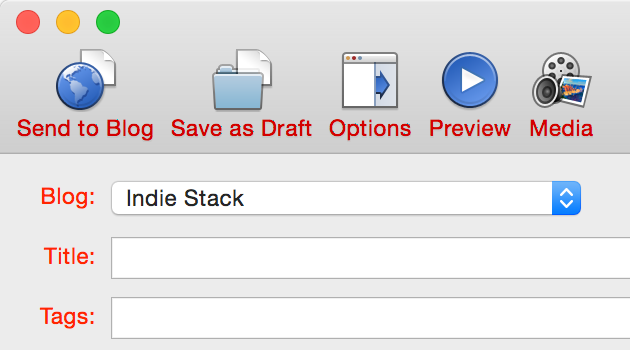
Here we have opted to break on every single call to controlTextColor, returning to the caller with a fraudulent color that is apparently not consulted by the label for this popup menu in MarsEdit:

In fact, mucking about with system symbols is one of the great tricks of the console, and lldb’s built-in “breakpoint” command brings with it superpowers that can’t be touched by Xcode’s dumbed down GUI-based controls. For example, what if we wanted to set a breakpoint that would catch not only +controlTextColor, but any similar variation? Using lldb’s support for regular expression breakpoints, it’s a snap:
(lldb) break set -r control.*Color -s AppKit
Breakpoint 1: 20 locations.
Here we request that a breakpoint be set for any symbol in the AppKit framework that contains the lower-cased “control,” followed by anything, then capitalized “Color.” And lldb just set 20 breakpoints at once. To see them all, just type “breakpoint list” and you’ll see all the variations listed out as sub-breakpoints:
(lldb) break list
Current breakpoints:
1: regex = 'control.*Color', locations = 20, resolved = 20, hit count = 0
  1.1: where = AppKit`+[NSColor controlTextColor], address = 0x00007fff8fb05572, resolved, hit count = 0
  1.2: where = AppKit`+[NSDynamicSystemColor controlTextColor], address = 0x00007fff8fb05670, resolved, hit count = 0
  1.3: where = AppKit`+[NSColor controlBackgroundColor], address = 0x00007fff8fb1465d, resolved, hit count = 0
  1.4: where = AppKit`+[NSDynamicSystemColor controlBackgroundColor], address = 0x00007fff8fb1475d, resolved, hit count = 0
  (etc...)
One major shortcoming of all this goodness is Xcode has a mind of its own when it comes to which breakpoints are set on a given target. Anything you add from the lldb prompt will not register as a breakpoint in Xcode’s list, so you’ll have to continue to manipulate it through the console. You can enable or disable breakpoints precisely by specifying both the breakpoint number and its, umm, sub-number? For example to disable the breakpoint on +[NSColor controlBackgroundColor] above, just type “break disable 1.3”.
Regular expressions can be very handy for setting breakpoint precisely on a subset of related methods, but they can also be very useful for casting about widely in the vain pursuit of a clue. For example, when I’m boggled by some behavior in my app, and suspect it has to do with some system-provided API, or even an internal framework method, I’ll just throw some verbs that seem related at a breakpoint, and see what I land on. For example, it seems like some delegate, somewhere should be imposing this behavior:
(lldb) break set -r should.*:
Breakpoint 5: 735 locations.
That’s right, set a breakpoint for any ObjC method that includes the conventional “shouldBlahBlahBlah:” form in its selector name. Or if you are really at your wit’s end about an event related issue, why not capture the whole lot and see where you stand?
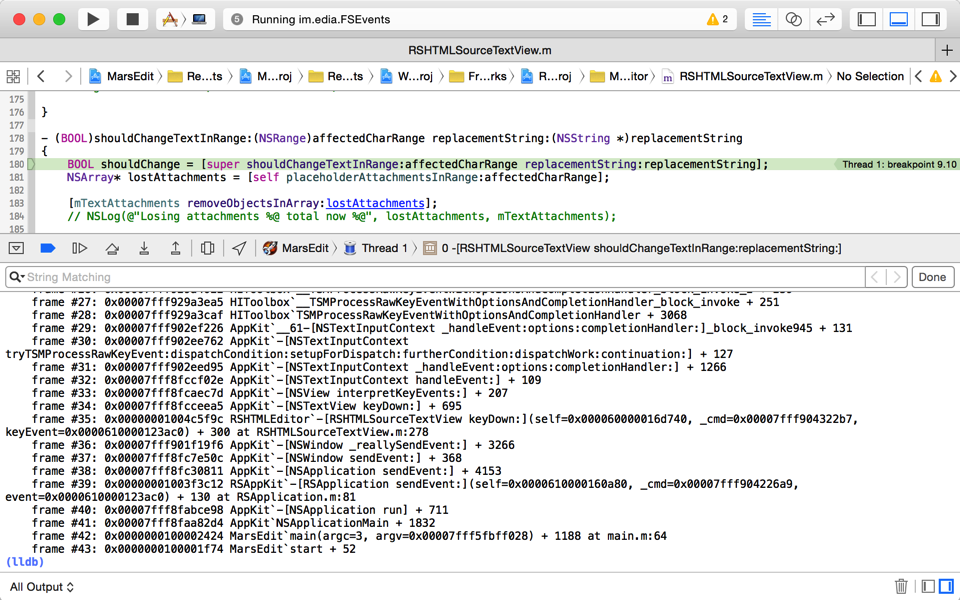
(lldb) break set -r [eE]vent
Breakpoint 10: 9520 locations.
Sometimes I’ll set a breakpoint like this and immediately continue, to see what I land on, but often I’ll use lldb’s breakpoint system as a quick way of searching the universe of symbol names. After setting a breakpoint like the one above, I’ll do a “break list” and then search through the results for other substrings I’m interested in. This often gives me a clue about the existence of methods or functions that are pertinent to the problem at hand.
I’ve scratched the surface here of all the powerful things you can use Xcode’s debugger console for, but I hope it has brought you some increased knowledge about the tools at your disposal. If you’ve never used the console before, or only use it occasionally, perhaps I’ve pushed you a bit farther down the path of having its Cmd-Shift-C shortcut feel like second-nature to you as well.