The rise of cloud and containers has led to systems that are much more distributed and dynamic in nature. Highly elastic microservice and serverless architectures mean containers spin up on demand and scale to zero when that demand goes away. In this world, servers are very much cattle, not pets. This shift has exposed deficiencies in some of the tools and practices we used in the world of servers-as-pets. It has also led to new tools and services created to help us support our systems.
Many of the clients we work with at Real Kinetic are trying to navigate their way through this transformation and struggle to figure out where to begin with these solutions. Beau Lyddon, one of our partners, recently gave a talk on exactly this called What is Happening: Attempting to Understand Our Systems (as an aside, Honeycomb’s Charity Majors live-blogged the talk which is worth a read). In this post, I’m going to attempt to summarize some of the key ideas from Beau’s talk and introduce the concept of an observability pipeline, which we think is an essential component in today’s cloud-native, product-oriented world.
Observability Explosion
With traditional static deployments and monolithic architectures, monitoring is not too challenging (that’s not to say it’s easy, but, in relative terms, it’s uncomplicated). This is where tools like Nagios became very popular. When we have only a handful of servers and/or a single, monolithic application, it’s relatively straightforward to determine the health of the system and to correlate system behavior to actual customer or business impact. It’s also feasible to “see inside the box” and get meaningful code-level instrumentation. Once again, tools like AppDynamics and Dynatrace became popular here.
With cloud-native and container-based systems, instances tend to be highly elastic and ephemeral, and what used to comprise a single, monolithic application might now consist of dozens of different microservices and even different instances running different versions of the same service. Simply put, systems are more distributed, more dynamic, and more complex now than ever before—and users have even more expectations. This means many of the tools that were well-suited before might not be adequate now.
For example, the ability to “see inside the box” with intra-process, code-level tracing becomes largely impractical in a highly dynamic cloud environment. By the time you are debugging an issue, the container is gone. This is only exacerbated by the serverless or functions as a service (FaaS) movement. Similarly, it’s much more difficult to correlate the behavior of a single service to the user’s experience since partial failure becomes more of an everyday thing. Thus, many of these tools end up being better suited to static infrastructures where there is a small set of long-lived VMs with a limited number of services. That’s where most of them originated from anyway. Instead, service-level distributed tracing becomes a key part of microservice observability, as does structured logging. With this shift in how we build systems, there has been an explosion in new terms, new tools, and new services.
Of course, in addition to tools, there are also the cultural aspects of monitoring and incident response. Many companies traditionally rely on an operations team to monitor, triage, and—in some cases—even resolve issues. This model quickly becomes untenable as the number of services increases. A single operations team will not be able to maintain enough context for a non-trivial amount of services and systems to do this effectively. This model also leads to ineffective feedback loops if engineers are not on-call and responsible for the operation of their services—something I’ve talked about ad nauseum. My advice is to push ownership of systems onto the teams who built them. This includes on-call duty and general operational responsibilities. However, in order for development teams to take on this responsibility, they need to be empowered to act on it. With this model, which I’ve come to facetiously call NewOps, the operations team becomes responsible for providing the tools and data teams need to adequately operate their services. Some organizations take this even further with dedicated observability teams.
“Observability” is a term that has emerged recently within the industry as a more nuanced take on traditional monitoring. While monitoring tends to focus more on the overall health of systems and business metrics, observability aims to provide more granular insights into the behavior of systems along with rich context useful for debugging and business purposes. Put another way, monitoring is about known-unknowns and actionable alerts; observability is about unknown-unknowns and empowering teams to interrogate their systems.
In a sense, observability encompasses all of the telemetry needed to gain insight into the behavior and state of a running system. This includes items like application logs, system logs, audit logs, application metrics, and distributed-tracing data. These are all valuable signals for diagnosing and debugging production issues, especially in a microservice environment where containers are largely ephemeral. In this environment, it is no longer practical to SSH into a machine to debug a problem or tail a log file. Distributed tracing becomes particularly important since a single application transaction may invoke multiple service functions.
Observability Pipeline
It’s important that you can really own your data and prevent it from being locked up inside a single vendor’s solution. Likewise, it’s important that data can be made available to the entire enterprise (or, in some cases, made not available to the entire enterprise). Since the number of tools and products can be quite large, tool and data needs vary from team to team, and the overall amount of data can be overwhelming, I suggest a decoupled approach. By building an observability pipeline, we can decouple the collection of this data from the ingestion of it into a variety of systems.
To illustrate, if we have log data going to Splunk, metrics and traces going to Datadog, client events going to Google Analytics and BigQuery, and everything going to Amazon Glacier for cold storage, the number of integrations quickly becomes large and grows for every additional service we add. It also probably means we are running an agent for many of these services on each host, and if any of these services are unavailable or behind, our application either blocks or we lose critical observability data. With the amount of data we end up collecting, it’s not uncommon to spend more time collecting it than actually performing business logic unless we find a way to efficiently get it out of the critical path.
Finally, as vendors in this space converge on features (which they are), differentiating capabilities are released (which they will need), or licensing/pricing issues arise (which they do), it’s likely that the business will need to add or remove SaaS solutions over time. If these are tightly integrated, this can be difficult to do. An observability pipeline, as we will later see, allows us to evaluate multiple solutions simultaneously or replace solutions transparently to applications and infrastructure. For example, perhaps we need to switch from Splunk to Sumo Logic or Datadog to New Relic or evaluate Honeycomb in addition to New Relic. How big of a lift would this be for your organization today? How easy is it to experiment with a new tool or service?
With an observability pipeline, we decouple the data sources from the destinations and provide a buffer. This makes the observability data easily consumable. We no longer have to figure out what data to send from containers, VMs, and infrastructure, where to send it, and how to send it. Rather, all the data is sent to the pipeline, which handles filtering it and getting it to the right places. This also gives us greater flexibility in terms of adding or removing data sinks, and it provides a buffer between data producers and consumers.
There are a few components to this pipeline which I will cover below. Many of the components can be implemented with existing open source tools or off-the-shelf services, so those I will touch on only briefly. Other parts require more involvement and some up-front thinking, so I’ll speak to them in more detail.
Data Specifications
Structured logging is hugely important to aiding debuggability. Anyone who’s shipped production code has been in the situation where they’re frantically trying to regex logs to pull out the information they need to debug a problem. It’s even worse when we’re debugging a request going through a series of microservices with haphazard logging. But structured logging isn’t just about creating better logs, it’s about creating a data pipeline that can feed the many tools you’ll need to leverage to understand, debug, and optimize complex systems, meet security and compliance requirements, and provide critical business intelligence.
In order to monitor systems, debug problems, make decisions, or automate processes, we need data. And we need the systems to give us data to provide necessary context. Aside from structured logging, one piece of advice we give every client is to pass a context object to basically everything. This context includes all of the important metadata flowing through a system—usually IDs that allow you to correlate events and piece together a story of what’s happening inside your system: user ID, account ID, trace ID, request ID, parent ID, and so on. What we want to avoid is the sort of murder-mystery debugging that often happens. A lone error log is the equivalent of finding a body. We know a crime occurred, but how do we piece together the clues to tell the right story? Observability—that is, being able to ask questions of your systems and truly explore them—requires access to pre-aggregate, raw data and support for high-cardinality dimensions.
The way to decide what goes on the context is to think about the data you wish you had while debugging an issue (this also highlights the importance of developers supporting their own systems). What is the data that would change the behavior of the system? Some examples include the user (or company), their license, time, machine stats (e.g. CPU and memory), software version, configuration data, the incoming request, downstream requests, etc. Of these, what can we get for “free” and what do we need to pass along? “Free” in this case would be things which are machine-provided, such as memory and CPU. The data we can’t get for free should go on the context, typically data that is request-specific. This context should be included on every log message.
This brings us back to the importance of structuring your data. To do this, I encourage creating standard specifications for each data type collected—logs, metrics, traces, events, etc. You can take this as far as you’d like—highly structured with a type system and rigid specification—but at a minimum, get logs into a standard format with property tags. JSON is fine for the actual structure, but be sure to version the spec so that it can evolve. For application events, one pattern that can work well is to create an inheritance structure with a base spec that applies across services (e.g. user context and tracing information are the same) and specialized specs that can be defined by services if needed. Just be careful not to leak sensitive data here—this is one area where code reviews are vital.
Specification Libraries
A key part of empowering developers is providing tools that align the “easy” path with the “right” path. If these aren’t aligned, pain-driven development creates problems. In order for developers to take advantage of structured data, specifications aren’t enough. We need libraries which implement the specs and make it easy for engineers to actually instrument their systems. For logging, there are many existing libraries. Just Google “structured logs” and your language of choice. For tracing and metrics, there are APIs like OpenTracing and OpenCensus. In practice, implementing the spec might be a combination of libraries and transformations made by the data collector described below.
Data Collector
This component is responsible for collecting data from hosts, containers, or other sources and writing it to the data pipeline. It may also perform transformations or filtering of data. A couple popular open source solutions for this are Fluentd and Logstash. Typically this runs as a sidecar or agent on the host, and data is written to stdout/stderr or a Unix domain socket, which it then pushes to the pipeline.
Data Pipeline
This component is a highly scalable data stream which can handle the firehose of observability data being generated and has high availability. This also provides a buffer for the data and decouples producers from consumers. Off-the-shelf solutions include Apache Kafka, Google Cloud Pub/Sub, Amazon Kinesis Data Streams, and Liftbridge.
Data Router
This component consumes data from the pipeline, performs filtering, and writes it to the appropriate backends. It may perform some transformations and processing of the data as well, but generally any heavy processing should be the responsibility of a backend system (e.g. alerting or aggregations). This is where the data specifications come into play. The data type will determine how routers handle incoming data, e.g. routing log data to Splunk and cold storage, routing traces to Google Stackdriver, and routing metrics and APM data to New Relic.
Like the specifications and libraries, this is a component that requires some more involvement. The downside of moving away from agent-based data collection is we now have to handle routing that data ourselves. The upside is most vendors provide good APIs and client libraries which make this easier.
Since this is typically a stateless service, it’s a good fit for “serverless” solutions like Google Cloud Functions or AWS Lambda.
Piecing It All Together
Putting all of these pieces together, the observability pipeline looks something like the following:
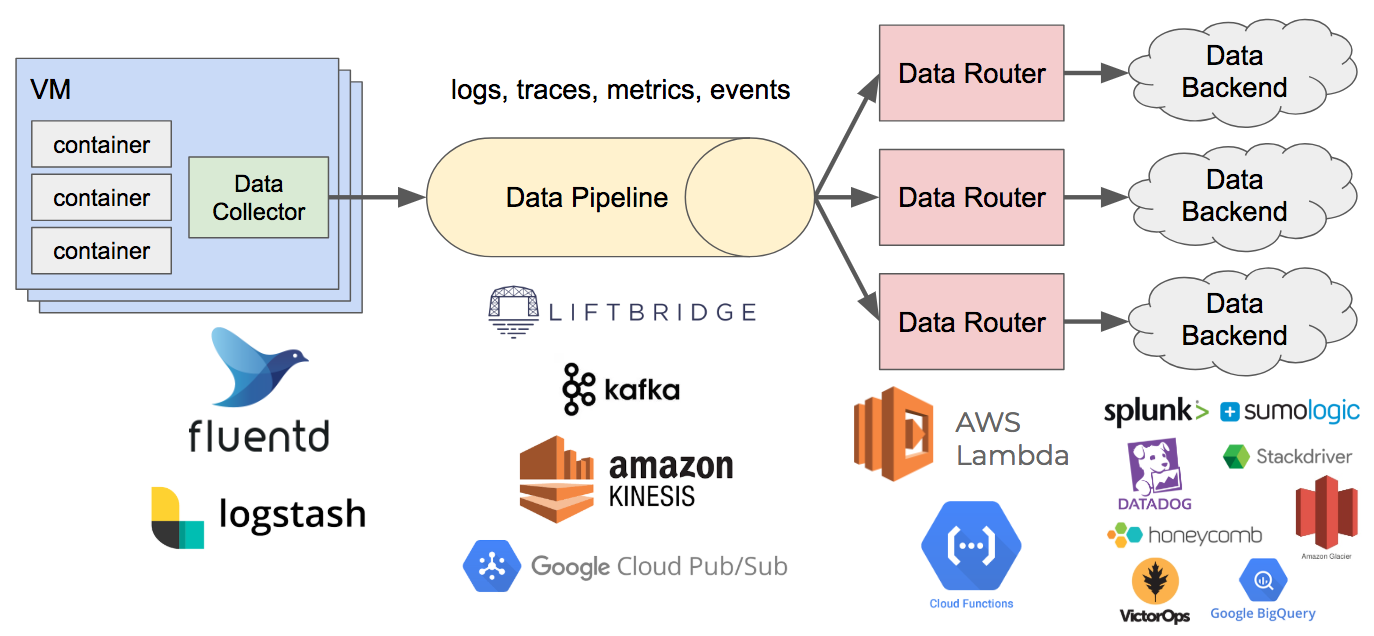
One caveat I want to point out is that this is not something you need to build out from day one. At most of the companies where we’ve implemented this, it was something that evolved over time. For instance, with some of the clients we work with who are attempting to move to the cloud and adopt DevOps practices, we typically would not advise making a significant upfront investment to architect this pipeline. This is an ideal goal to work towards that will become increasingly important as the amount of services, traffic, and data scales. Instead, architect your systems from the beginning to be able to adopt this approach more easily—use structured logging, keep collection out-of-process, and use a centralized logging system.
For organizations that are heavily siloed, this approach can help empower teams when it comes to operating their software. Unlocking this data can also be a huge win for the business. It provides a layer of abstraction that allows you to get the data everywhere it needs to be without impacting developers and the core system. Lastly, it allows you to change backing data systems easily or test multiple in parallel. With the amount of data and the number of tools modern systems demand these days, the observability pipeline becomes just as essential to the operations of a service as the CI/CD pipeline.
Follow @tyler_treat
Great blog, we’ve also seen this talked about in some of our meetups and customer conversations: https://www.outlyer.com/blog/doxlon-august-2017/#what-does-next-gen-monitoring-look-like–owain-perry-principal-engineer-at-just-eat
This is becoming a common idea and we even discussed open-sourcing our agent/configuration technology to provide something like this to users at one point. A “segment.io” for monitoring.
The challenge with this approach for some solutions is it treats the solutions just as a time-series/log sink for storing metrics or logs, you lose most of the value you can get from those solutions once you take the solution’s agent out of the picture and start pushing metrics to a common endpoint and feeding those metrics to different providers.
For example our solution has a unique configuration technology that allows users to push checks out to all their instances in seconds. This is what enables our core “self-service” value proposition. With the approach in this blog, that would break and our solution would essentially just become a hosted TSDB.
Also every solution sends different metric names and labels, which all the template dashboards and alerts expect to be there to work. Prometheus metrics are different from CollectD metrics, which are different from Telegraph metrics, which are different from Outlyer metrics…and all those out of the box template dashboards and alerts would break.
In fact I would argue, having seen customers migrate solutions in the past, most of the time is spent migrating the dashboards, alerts and other monitoring configuration, much more time than rolling out and configuring a new agent. Until every integration and agent sends the same metrics, and provide the same query language, this will not go away, and you won’t be able to use all the integration templates provided by most solutions out of the box.
I can see this working for some use cases – a log is a log, a custom StatsD metric is the same, and even OpenTracing data is pretty standard, but for Infrastructure metrics, you’re still generally better off installing the agent for that solution, so you get all the additional value such as out of the box templates and other agent capabilities those solutions provide.
Thanks to your inspiration, I did a more in depth response to this idea on our blog here: https://www.outlyer.com/blog/why-the-observability-pipeline-wont-solve-everything/
Look forward seeing how this conversation evolves! :)
Incidentally, this is almost the proto-type[1] logging pipeline I came up with when I was evaluating using TimescaleDB/postgres for storing application logs.
1. https://www.komu.engineer/blogs/timescaledb/timescaledb-for-logs