


Like most websites, we use own and third party cookies for analytical purposes and to show you personalised advertising or based on your browsing habits.
Generally, the information does not directly identify you, but can provide you with a more personalised web experience. Because we respect your right to privacy, you may choose not to allow us to use certain cookies. However, blocking some types of cookies may affect your experience on the site and the services we can offer.
For more information, you can read our cookie policy.
LinkedIn Trends Study 2024
Answers to the biggest questions about LinkedIn
In this study, we conducted an analysis of 41,170 LinkedIn business pages and a total of 1,578,969 posts over a 122-day period (October 2023 – January 2024) to let the data answer the biggest questions about LinkedIn.
We wanted to know what usage trends exist on LinkedIn today, which formats perform the best to gain interactions, and how often brands post on this platform.
Find the answers to the questions I’m sure you’ve already asked yourself more than once:
- What is the best time to post on LinkedIn?
- How many times a week should I post on LinkedIn to receive more impressions?
- Which LinkedIn format generates the most engagement, views, and impressions?
- Should I post carousels, images, or videos?
- Does posting frequency influencer follower count or post views?
- Which posting formats on LinkedIn are shared the most?

This is just a teaser of what you will find in the complete LinkedIn study. To view the data in full, download the study here.
Key Takeaways From The LinkedIn Trends Study
The analyzed accounts correspond to LinkedIn business pages that use this network for professional purposes.
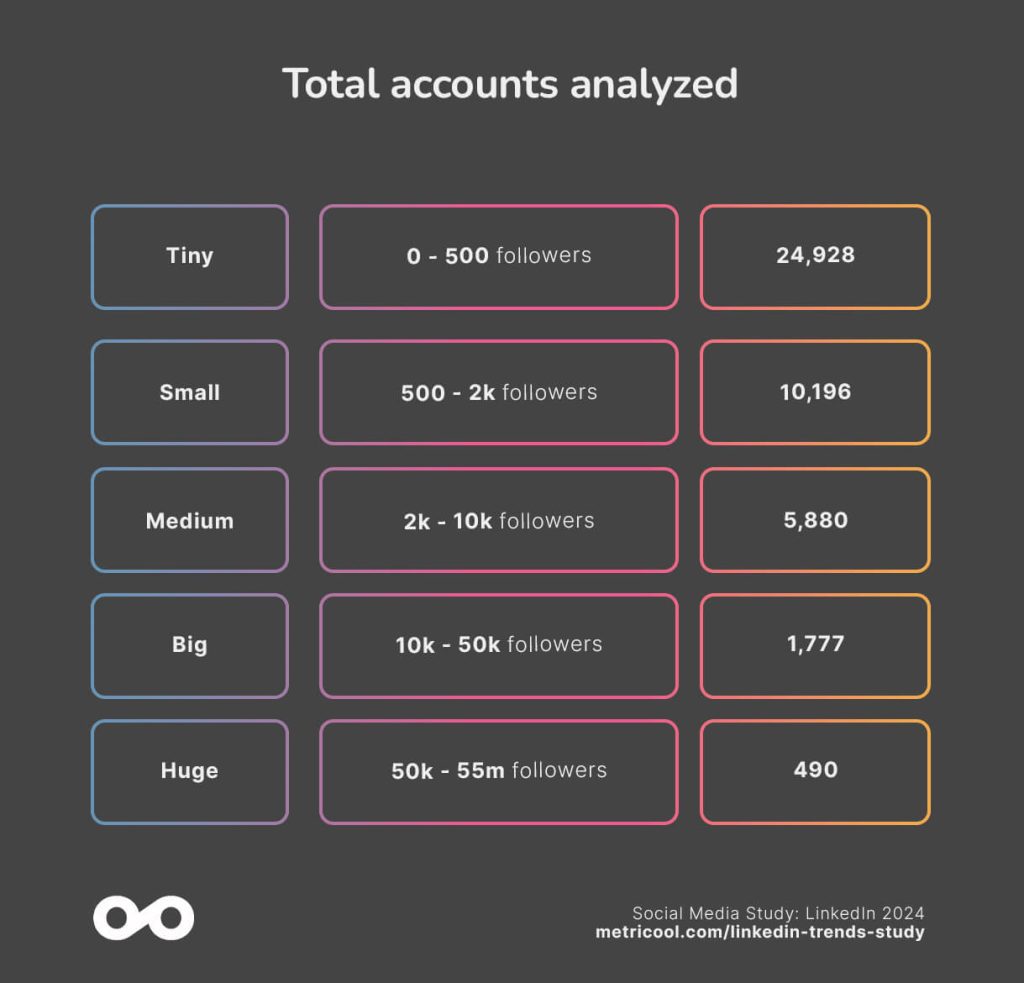
In this study, you will see that the LinkedIn pages analyzed are grouped by follower count. This way we can easily compare data when viewing metrics such as posting frequency, engagement, and the number of views per account size.
These are divided into five different groups: Tiny, Small, Medium, Big, and Huge, in which the groups are created based on the number of followers of the LinkedIn page.
As for the number of posts, we analyzed 1,578,969 posts, made up of 78,522 carousels, 719,537 other posts, 579,283 posts with images, and 201,629 posts that include a video.
LinkedIn Study Conclusions
In our annual Social Networks Study, we found that on LinkedIn, the sharing option is the star interaction type, and that posting quality content results in greater reach.
This trend will continue in 2024, and sharing will be a key interaction. We also found that all brand accounts have a space on LinkedIn, regardless of the following count.
LinkedIn trends and predictions
We are almost two months in 2024 so, are these trends reigning true?
The answer is yes Based on the 2024 LinkedIn study data. Three of the four content formats (images, carousels, videos) have achieved an average of 1.20 shares per post. In the case of other format types (text-only posts, polls, links) these are close behind with an average of 0.84 shares per post.
In the end, LinkedIn prioritizes this interaction and while you have the option to share the full content, you can also include your own idea when reposting. Taking advantage of this feature is a way to increase impressions on LinkedIn.

We also see a boost in participation from all account types, especially Tiny accounts. This means that LinkedIn continues to attract brands to its platform and that all brands are continuing to carve out niches for themselves on the network.
If you want to analyze and view all the LinkedIn study data, with more insights, such as which posting format is the most successful, download the study below!
Find data about the best time and day to post, not only with information on what time brands post, but also what is the best time to post to obtain greater results.
You will also have the answer to which LinkedIn post generates the most engagement, shares, and likes.
Let us know what you thought of the 2024 LinkedIn trends study, and if you are going to apply any of these strategies to your LinkedIn page, in the comment section below.