
Yan Cui
I help clients go faster for less using serverless technologies.
This is a the first in a mini series that accompanies my “the present and future of Serverless observability” talk at ServerlessConf Paris and QCon London.
part 1 : new challenges to observability <- you’re here
part 2 : first party observability tools from AWS
part 3 : 3rd party observability tools
part 4 : the future of Serverless observability
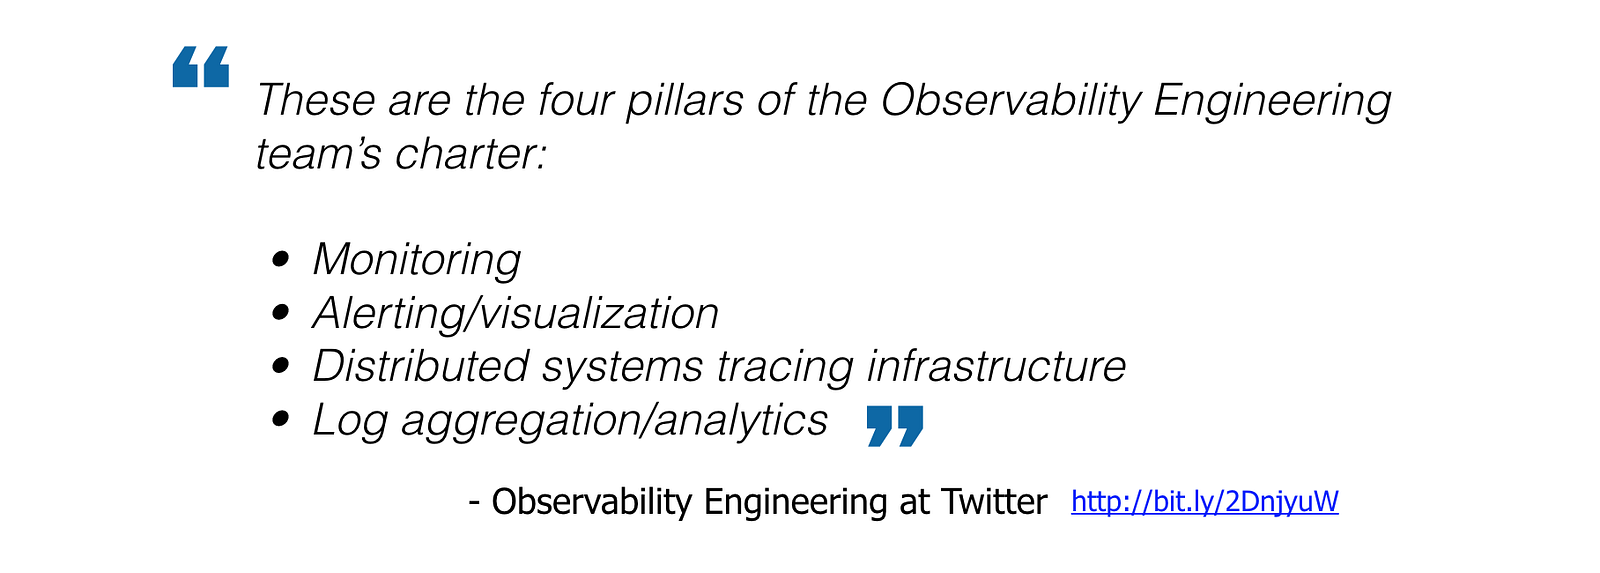
2017 was no doubt the year the concept of observability became mainstream, so much so we now have an entire Observability track at a big industry event such as QCon.
This is no doubt thanks to the excellent writing and talks by some really smart people like Cindy Sridharan and Chairty Majors:
- Monitoring and Observability by Cindy Sridharan
- Monitoring isn’t Observability by Baron Schwartz
- Observability for Emerging Infra: what got you here won’t get you there by Charity Majors
As Cindy mentioned in her post though, the first murmurs of observabilitycame from a post by Twitter way back in 2013 where they discussed many of the challenges they face to debug their complex, distributed system.
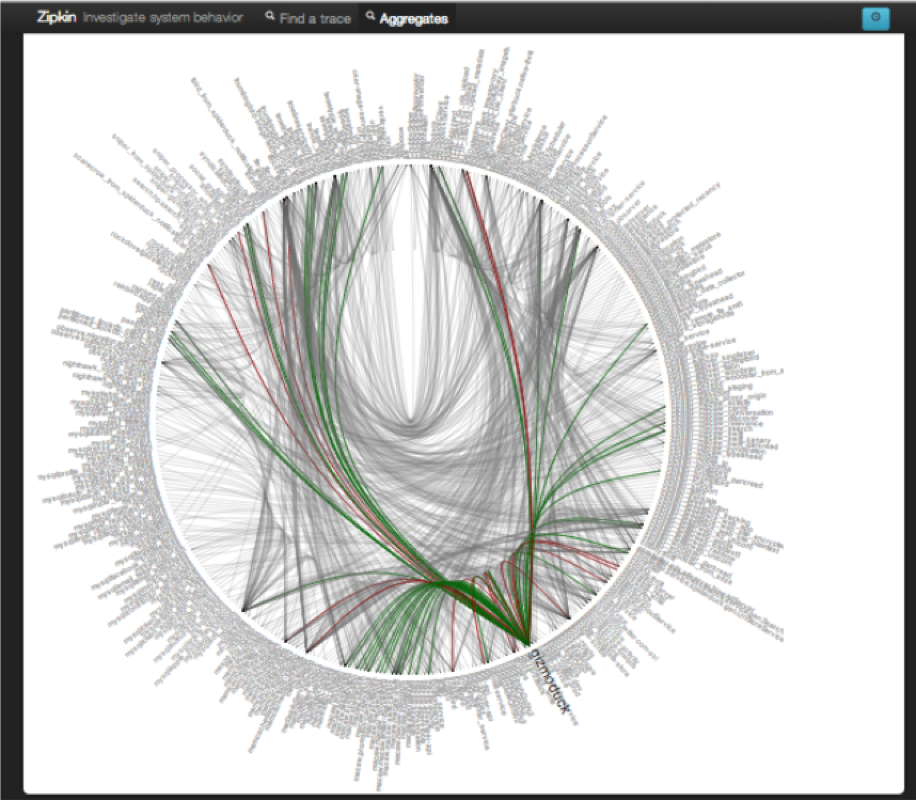
A few years later, Netflix started writing about the related idea of intuition engineering around how do we design tools that can give us holistic understanding of our complex system – that is, how can we design our tools so that they present us the most relevant information about our system, at the right time, and minimize the amount of time and cognitive energy we need to invest to build a correct mental model of our system.
Challenges with Serverless observability
With Serverless technologies like AWS Lambda, we face a number of new challenges to the practices and tools that we have slowly mastered as we learnt how to gain observability for services running inside virtual machines as well as containers.
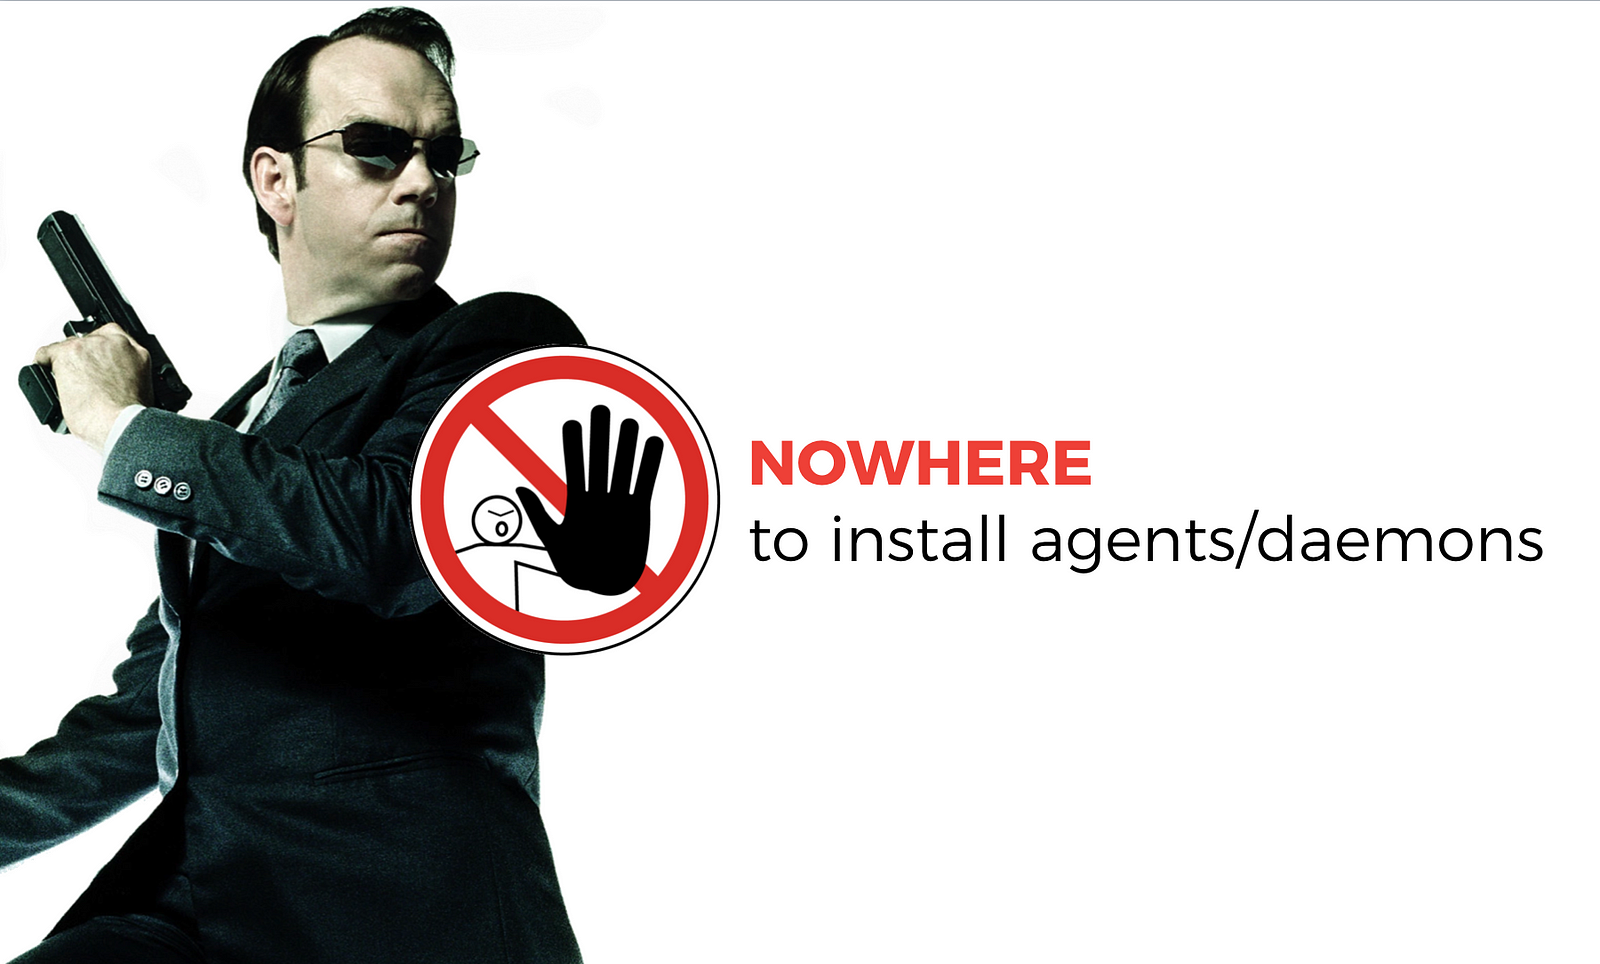
As a start, we lose access to the underlying infrastructure that runs our code. The execution environment is locked down, and we have nowhere to install agents & daemons for collecting, batching and publishing data to our observability system.
These agents & daemons used to go about their job quietly in the background, far away from the critical paths of your code. For example, if you’re collecting metrics & logs for your REST API, you would collect and publish these observability data outside the request handling code where a human user is waiting for a response on the other side of the network.
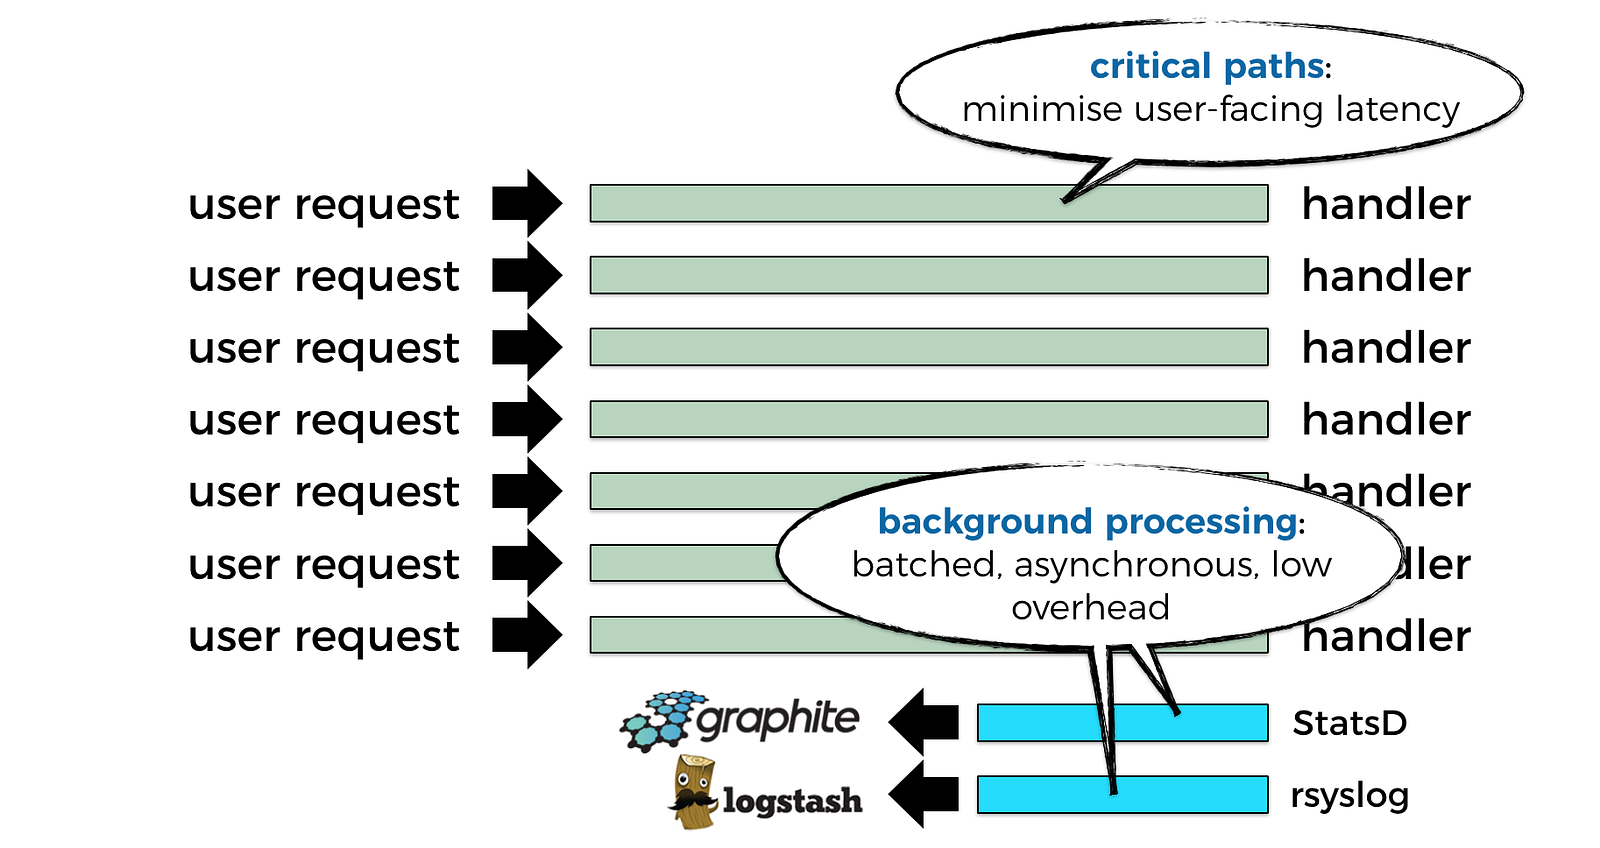
But with Lambda, everything you do has to be done inside your function’s invocation, which means you lose the ability to perform background processing. Except what the platform does for you, such as:
- collecting logs from stdout and sending them to CloudWatch Logs
- collecting tracing data and sending them to X-Ray
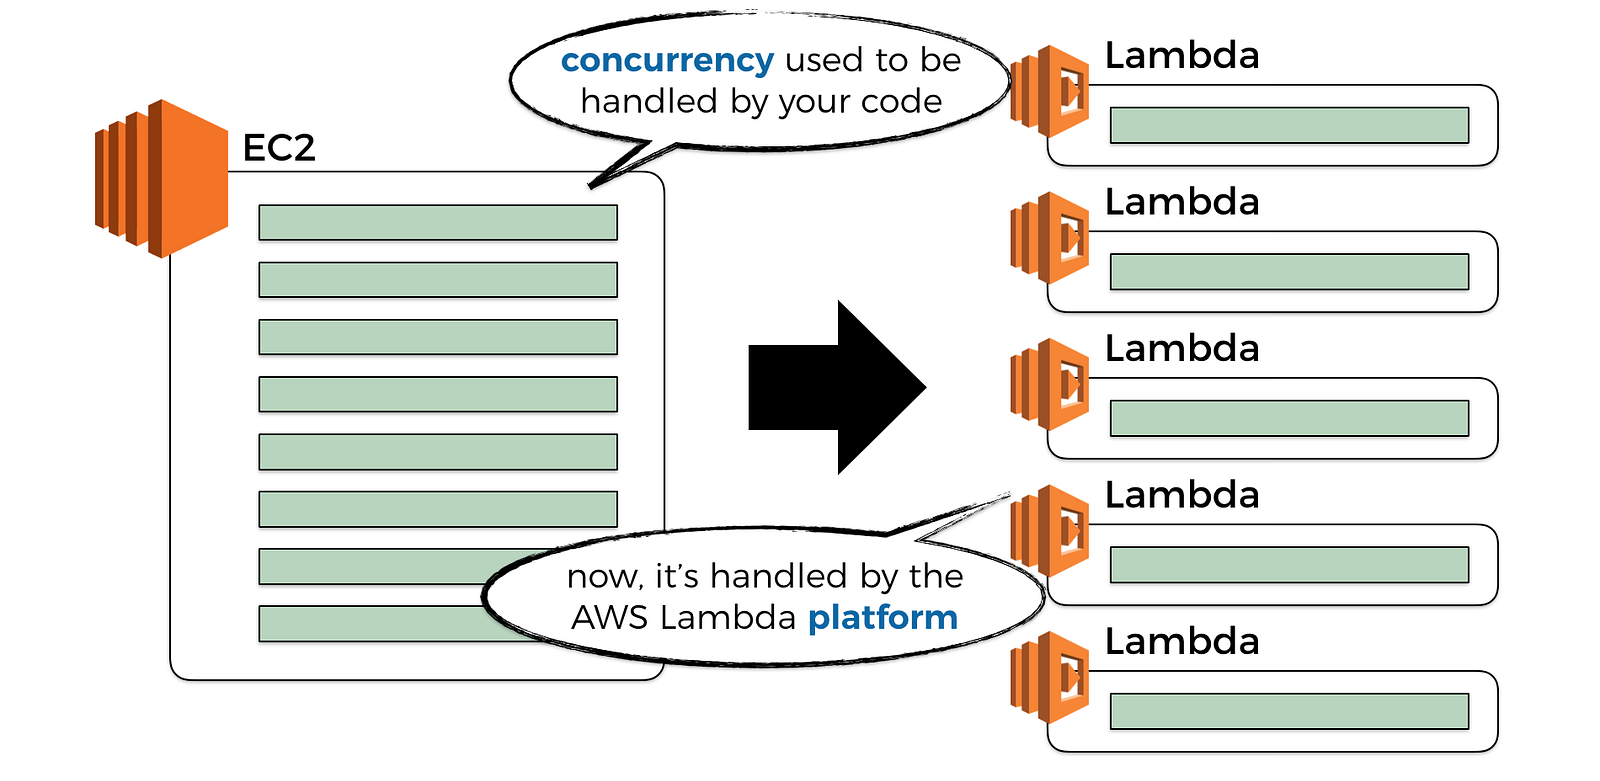
Another aspect that has drastically changed, is how concurrency of our system is controlled.
Whereas before, we would write our REST API with a web framework, and we’ll run it as an application inside an EC2 server or a container, and this application would handle many concurrent requests. In fact, one of the things we compare different web frameworks with, is their ability to handle large no. of concurrent requests.

Now, we don’t need web frameworks to create a scalable REST API anymore, API Gateway and Lambda takes care of all the hard work for us. Concurrency is now managed by the platform, and that’s great news!
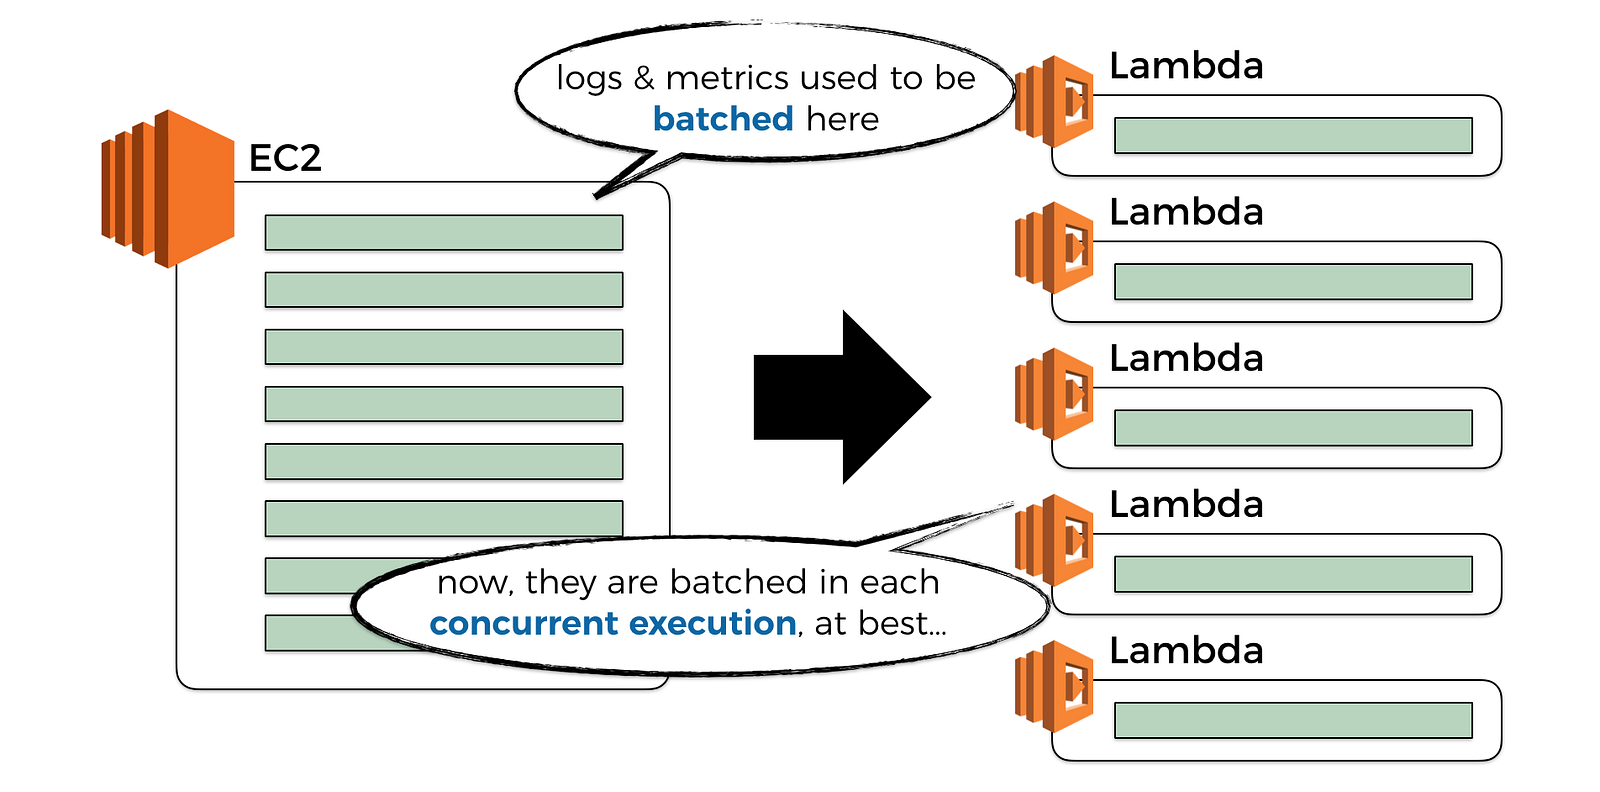
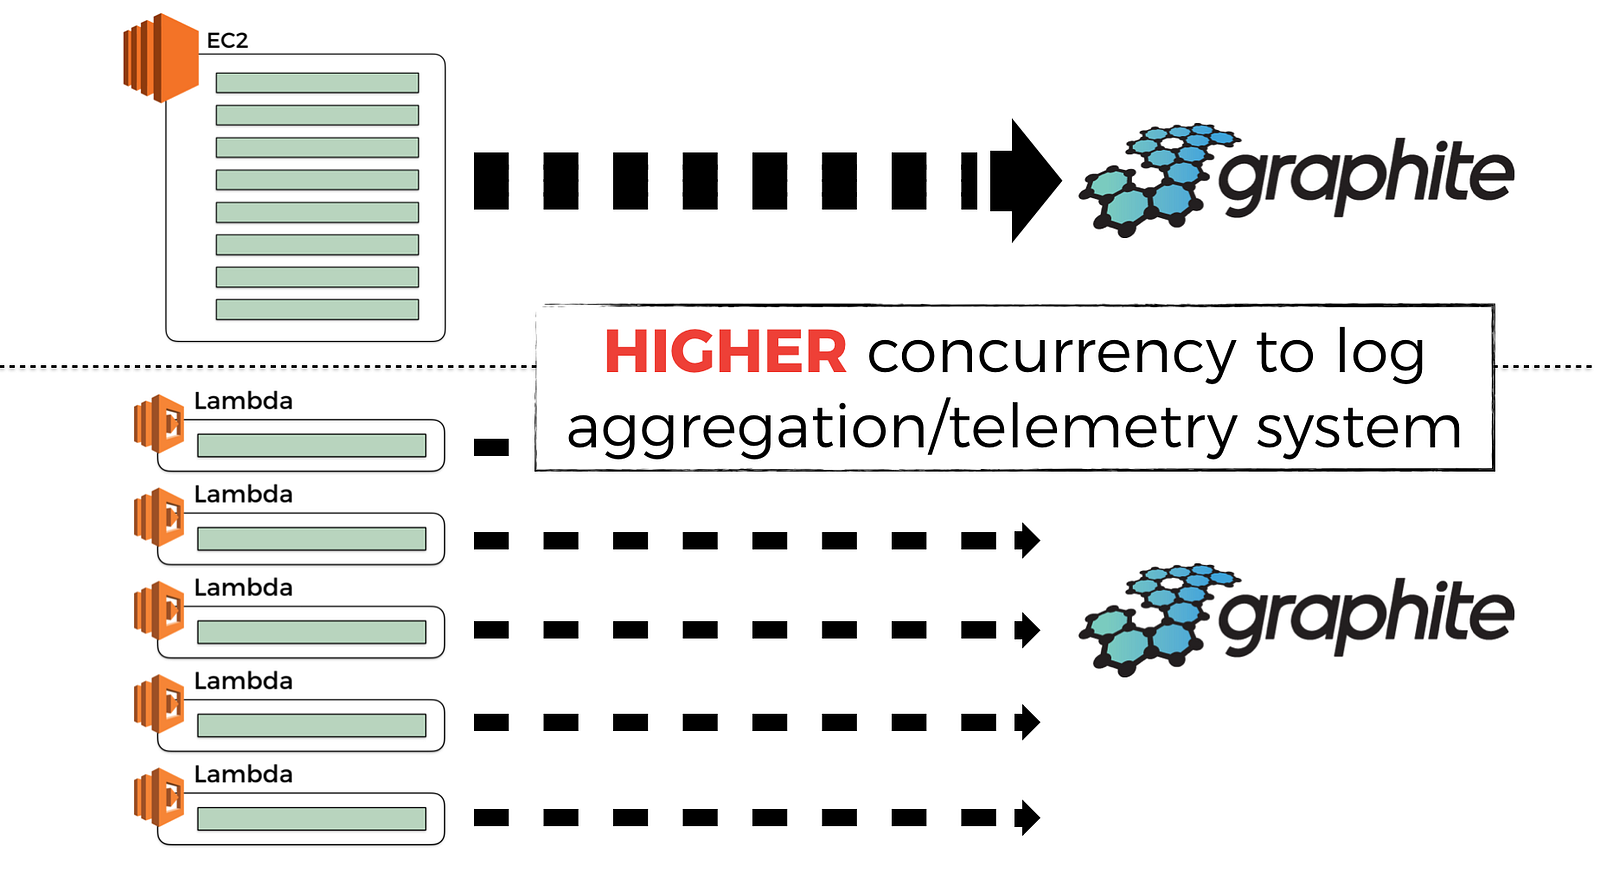
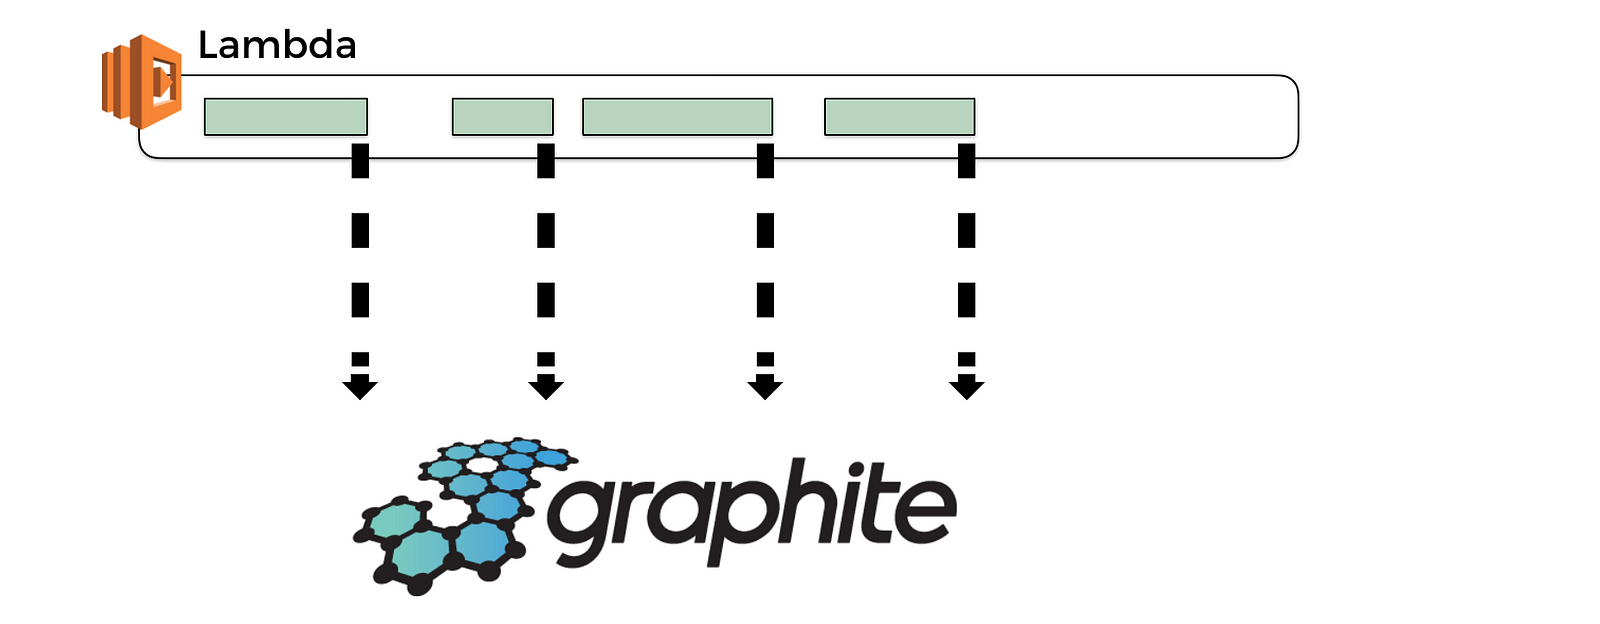
However, this also means that any attempt to batch observability data becomes less effective (more on this later), and for the same volume of incoming traffic you’ll exert a much higher volume of traffic to your observability system. This in turn can have a non-trivial performance and cost implications at scale.
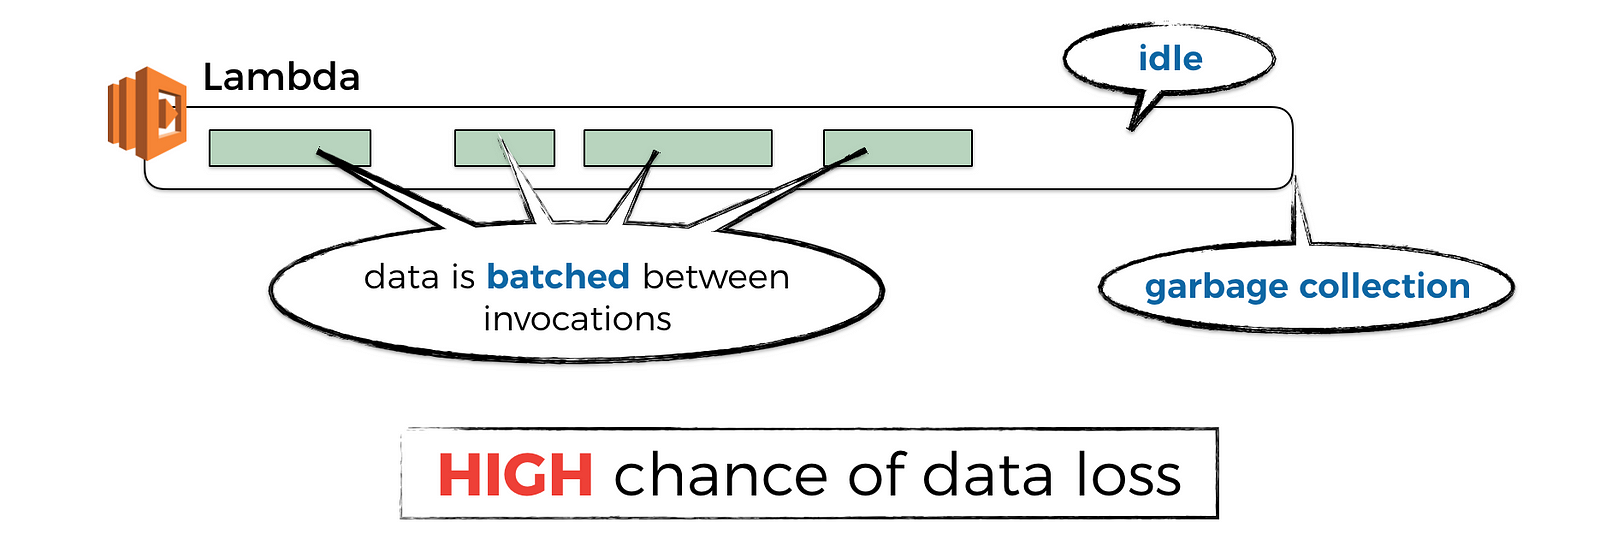
You might argue that “well, in that case, I’ll just use a bigger batch size for these observability data and publish them less frequently so I don’t overwhelm the observability system”.
Except, it’s not that simple, enter, the lifecycle of an AWS Lambda function.
One of the benefits of Lambda is that you don’t pay for it if you don’t use it. To achieve that, the Lambda service would garbage collect containers (or, concurrent executions of your function) that have not received a request for some time. I did some experiments to see how long that idle time is, which you can read about in this post.
And if you have observability data that have not been published yet, then you’ll loss those data when the container is GC’d.
Even if the container is continuously receiving requests, maybe with the help of something like the warmup plugin for the Serverless framework, the Lambda service would still GC the container after it has been active for a few hours and replace it with a fresh container.
Again, this is a good thing, as it eliminates common problems with long running code, such as memory fragmentation and so on. But it also means, you can still lose unpublished observability data when it happens.
Also, as I explained in a previous post on cold starts, those attempts to keep containers warm stop being effective when you have even a moderate amount of load against your system.
So, you’re back to sending observability data eagerly. Maybe this time, you’ll build an observability system that can handle this extra load, maybe you’ll build it using Lambda!
But wait, remember, you don’t have background processing time anymore…
So if you’re sending observability data eagerly as part of your function invocation, then that means you’re hurting the user-facing latency and we know that latency affects business revenue directly (well, at least in any reasonably competitive market where there’s another provider the customer can easily switch to).
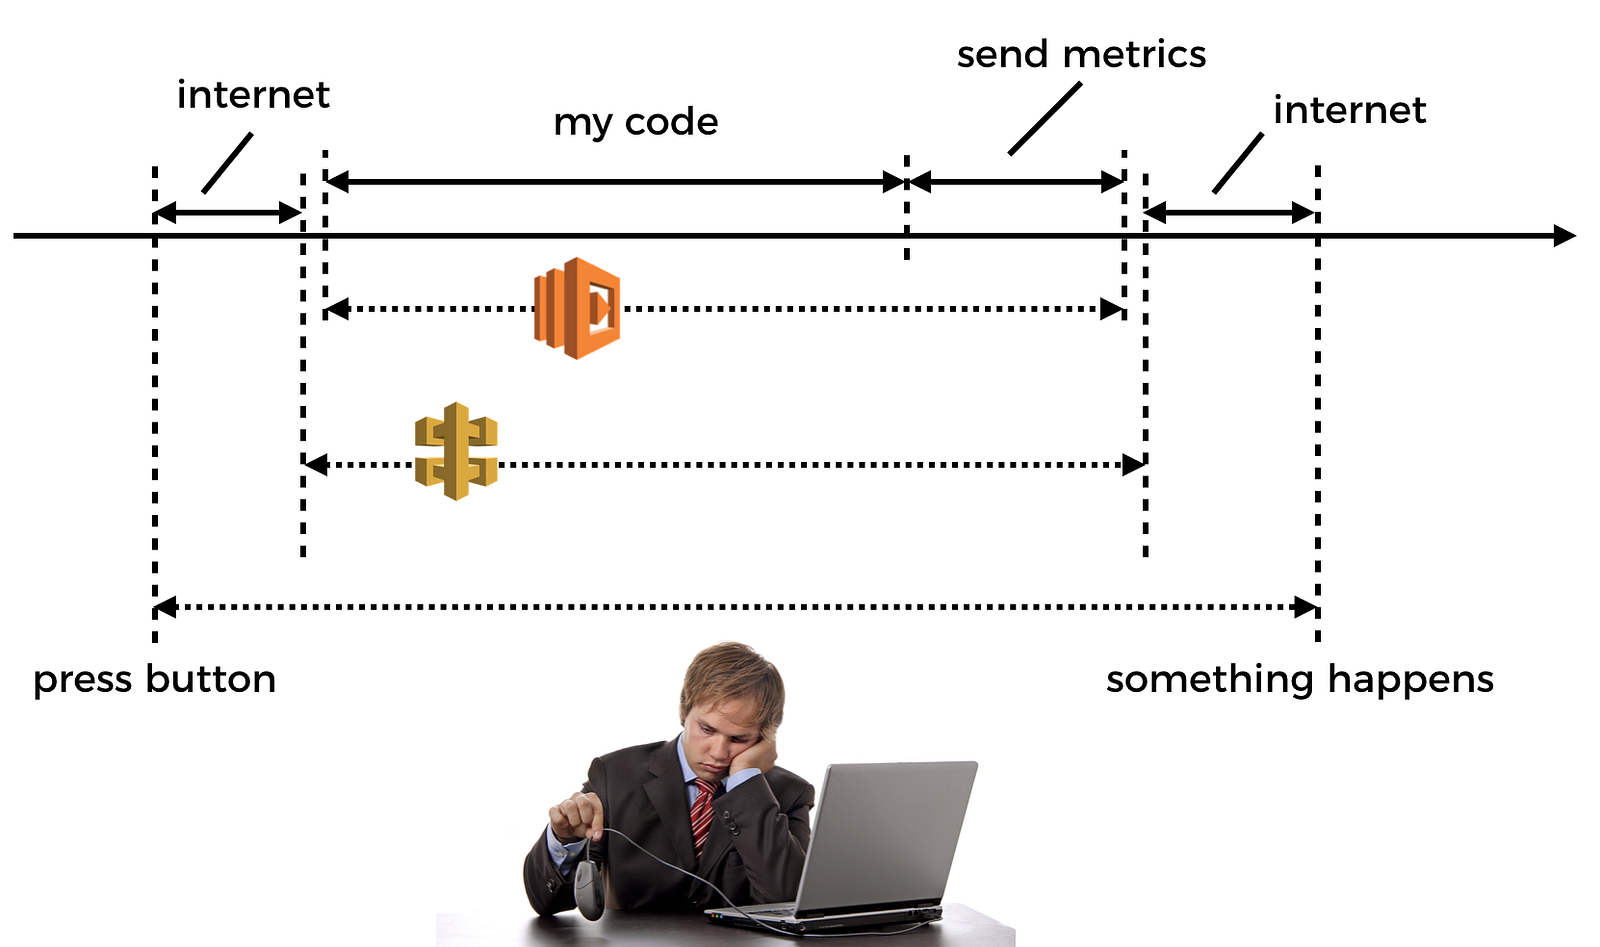
Talk about being caught between a rock and a hard place…
http://gph.is/2nsGQ7O
Finally, one of the trends that I see in the Serverless space – and one that I have experienced myself when I migrated a social network’s architecture to AWS Lambda – is how powerful, and how simple it is to build an event-driven architecture. And Randy Shoup seems to think so too.
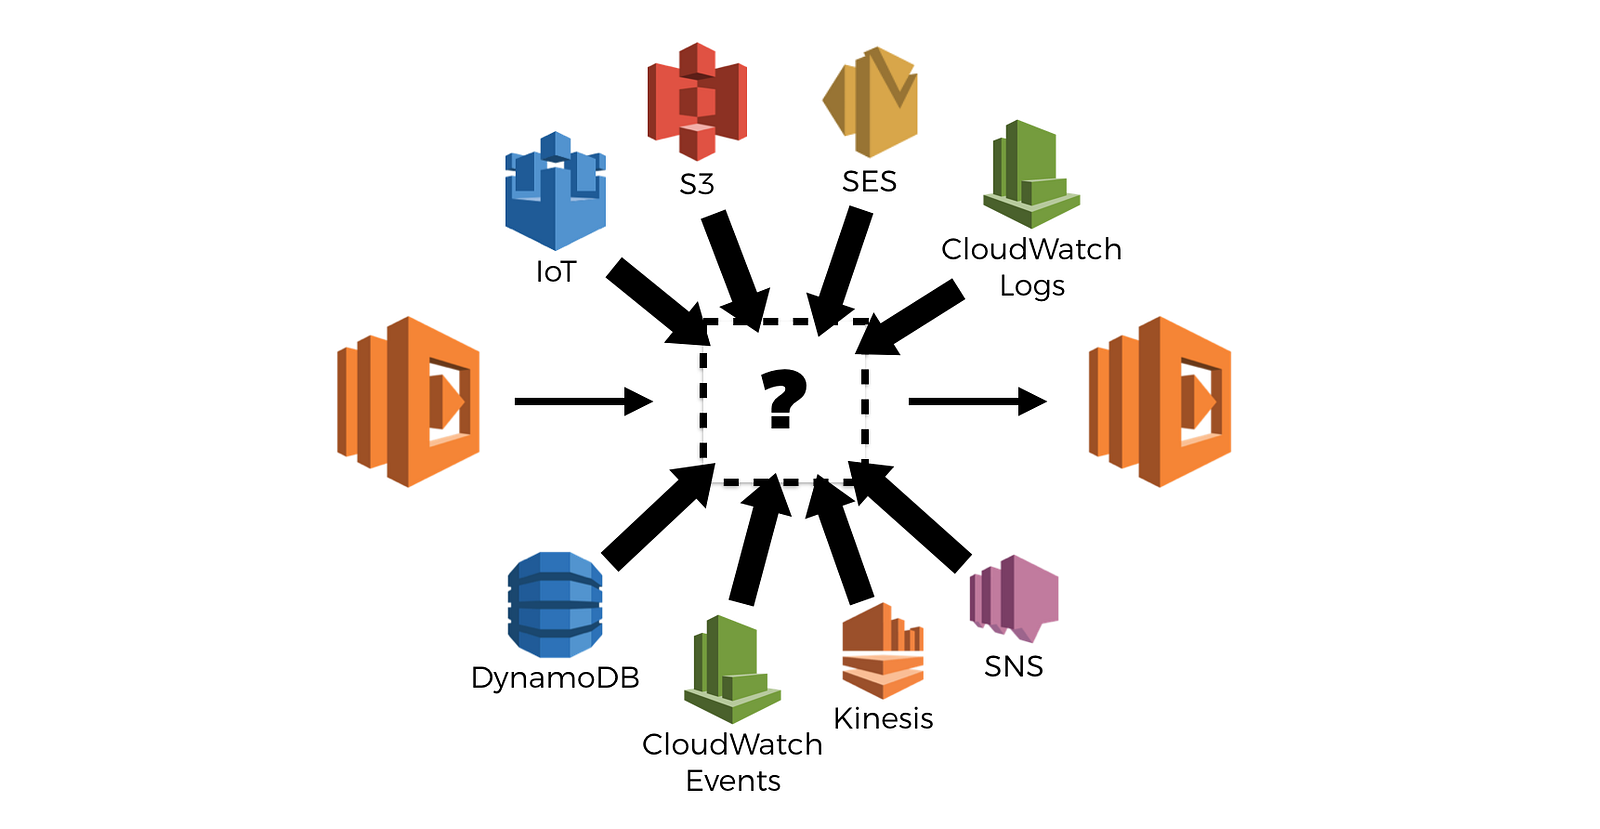
And in this event-driven, serverless world, function invocations are often chained through some asynchronous event source such as Kinesis Streams, SNS, S3, IoT, DynamoDB Streams, and so on.
In fact, of all the supported event sources for AWS Lambda, only a few are classified as synchronous, so by design, the cards are stacked towards asynchrony here.
And guess what, tracing asynchronous invocations is hard.
I wrote a post on how you might do it yourself, in the interest of collecting and forwarding correlation IDs for distributed tracing. But even with the approach I outlined, it won’t be easy (or in some cases, possible) to trace through every type of event source.
X-Ray doesn’t help you here either, although it sounds like they’re at least looking at support for Kinesis. At the time of writing, X-Ray also doesn’t trace over API Gateway but that too, is on their list.
Until next time…
So, I hope I have painted a clear picture of what tool vendors are up against in this space, so you really gotta respect the work people like IOPipe, Dashbird and Thundra has done.
That said, there are also many things you have to consider yourself.
For example, given the lack of background processing, when you’re building a user facing API where latency is important, you might want to avoid using an observability tool that doesn’t give you the option to send observability data asynchronously (for example, by leveraging CloudWatch Logs), or you need to use a rather stringent sample rate.
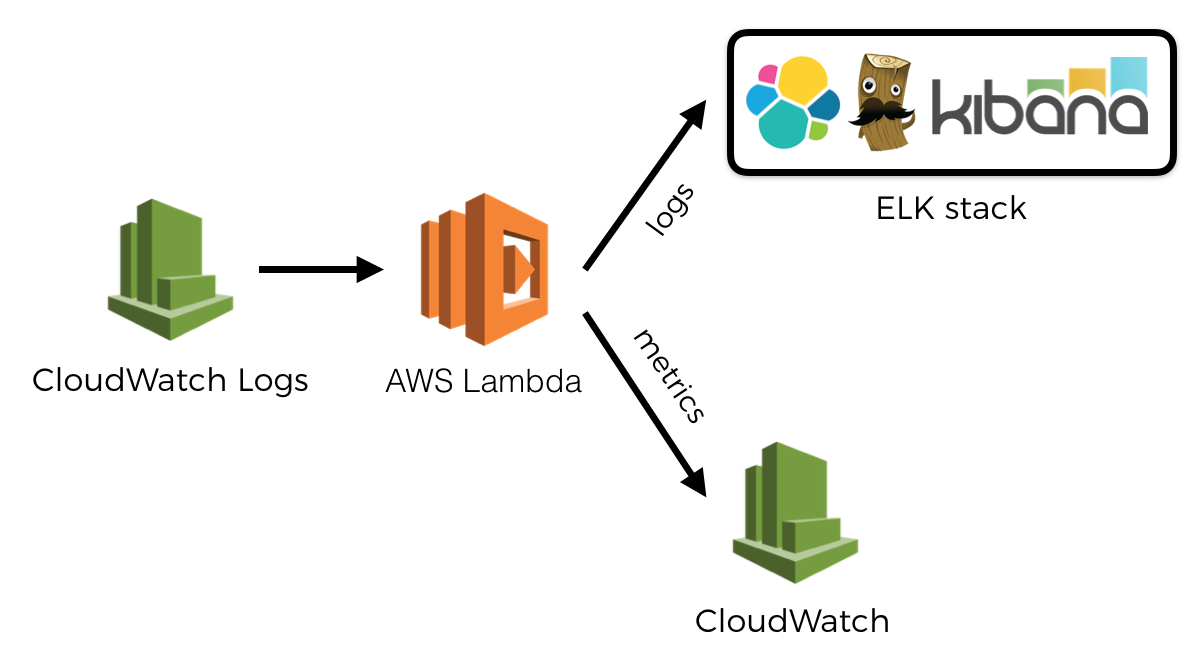
At the same time, when you’re processing events asynchronously, you don’t have to worry about invocation time quite as much. But you might care about the cost of writing so much data to CloudWatch Logs and the subsequent Lambda invocations to process them. Or maybe you’re concerned that low-priority functions (that process the observability data you send via CloudWatch Logs) are eating up your quota of concurrent executions and can throttle high-priority functions (like the ones that serves user-facing REST APIs!). In this case, you might choose to publish observability data eagerly at the end of each invocation.
In part 2, we’ll look at the first party tools we get from AWS.
In part 3, we’ll look at other third party tools that are designed for serverless, such as IOPipe, Dashbird, Thundra and Epsagon. We will see how these tools are affected by the aforementioned challenges, and how they affect the way we evaluate these third party tools.
Whenever you’re ready, here are 3 ways I can help you:
- Production-Ready Serverless: Join 20+ AWS Heroes & Community Builders and 1000+ other students in levelling up your serverless game.
- Consulting: If you want to improve feature velocity, reduce costs, and make your systems more scalable, secure, and resilient, then let’s work together and make it happen.
- Join my FREE Community on Skool, where you can ask for help, share your success stories and hang out with me and other like-minded people without all the negativity from social media.