Over the past few weeks, we have highlighted the tools and data which make up StatsBomb American Football 1.0. Part of this release has been showing these tools to coaches and analysts around the country. The reaction has been hugely positive.
One especially popular feature has been StatsBomb's Passing Charts. While people have liked what they've seen, we've also had plenty of great suggestions for making it even better. An important part of the culture at StatsBomb is that once we've built something, we're not done with it, so when we received feedback in our initial meetings, we listened intently. What did coaches like, what did they not like, what did they wish was different? By incorporating some of their proposed improvements, we are going to make some DB coaches VERY happy this season.
One of the changes we've already made based on their feedback is the ability to rotate the charts vertically both from the offensive and defensive points of view. Football isn’t played on a spreadsheet or a whiteboard, but plays are drawn up vertically and many coaches prefer to look at any charts and visualizations in that vertical view.
This is just the start, so let’s walk through how a Defensive Back coach (and/or Defensive Coordinator) would use this new tool to break down an opposing offensive passing game in five minutes or less.
1. Self Scout
An often underappreciated part of coaching is how well you are able to look at your own strengths and weaknesses. It’s easy to power through a recap of your most recent game, and dive right into the next opponent. Coaches will watch hours and hours of cutups* to find out as much as they can about their opponent, but it’s important to get a feel for how well your own team does as well, so you can frame your game plans and practice accordingly.
*Discussion about the term cutup, and how much more time coaches have these days because they don’t have to actually “cut up” any film, is for another time (or feel free to DM me at @thecoachedwards for any other super nerdy aspects of football).
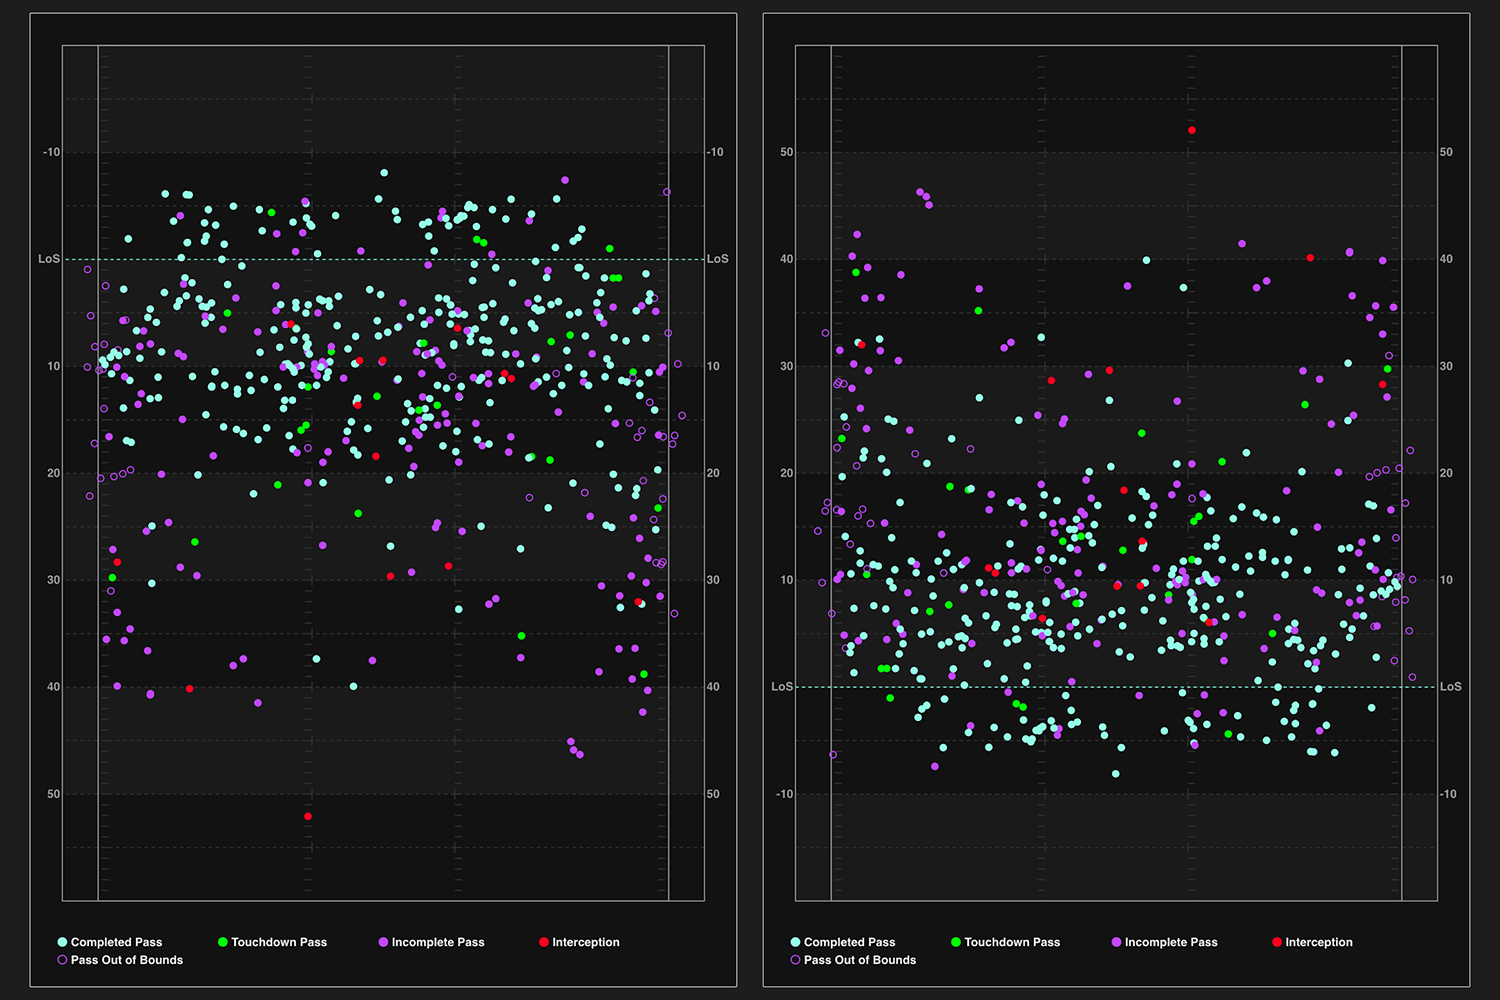
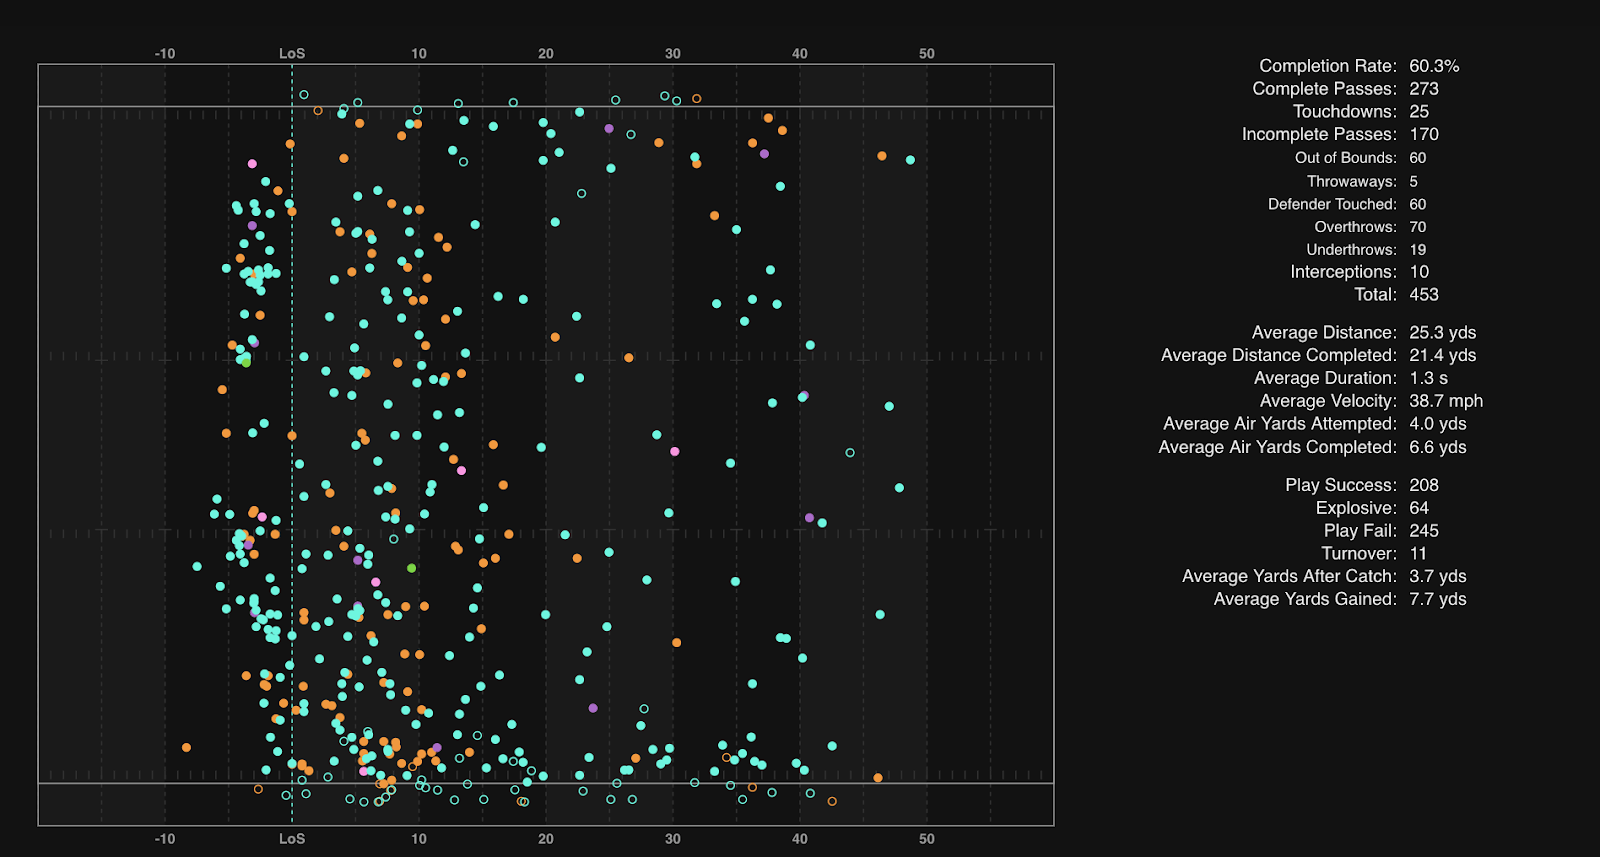
And that brings us to the first addition! Being able to look at the passing map from a defensive standpoint. Coaches can pull this up Sunday morning to get a better understanding of where their own team is being attacked through the air. Are you particularly vulnerable to explosive plays and/or Touchdowns somewhere on the field? Do you have a scheme set up that is especially good at forcing incompletions in a specific area of the field? Scout yourself before you scout your opponents. The image below shows passes that were thrown against a specific team from last season and is colored by play success.
2. On to the opponents
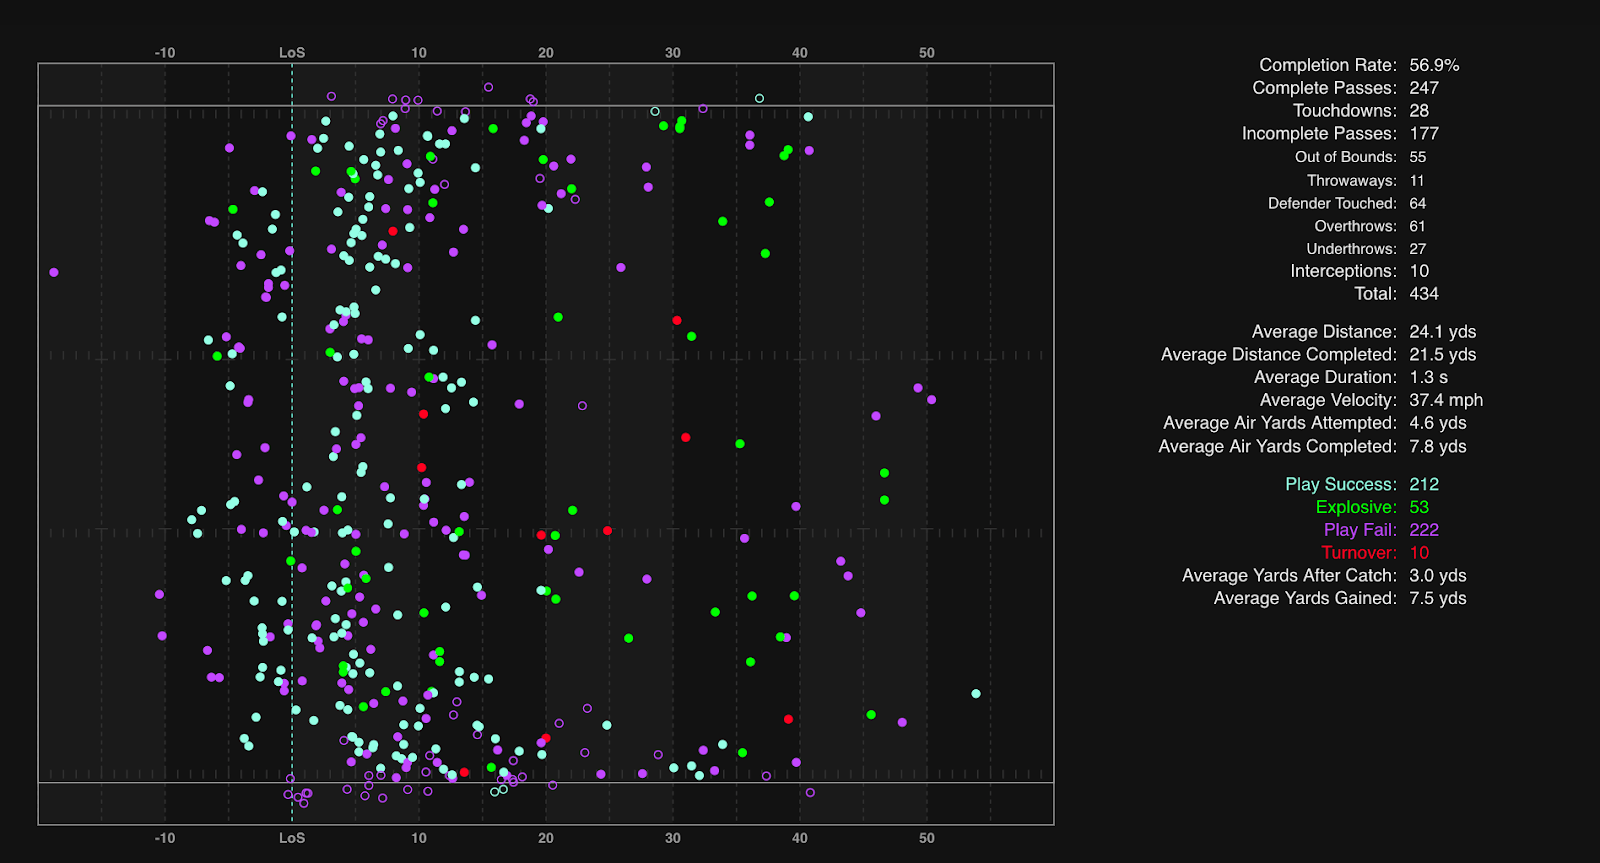
After scouting their own team, let’s say the defensive back coach sees their team has a problem of giving up explosive plays. The first thing to do when looking at your upcoming opponent is to find out where they are generating explosive plays in the passing game. The image below shows a team's explosive passes with the dots colored by receiver. The image above shows a lot of explosive passes completed around the numbers or wider, as well as deep passes. The opponent image below shows a high concentration in the middle of the field, and down the left sideline. This week the DB coach should look at the explosive plays down the left sideline because that is a strength of their opponent and a weakness of their own team.
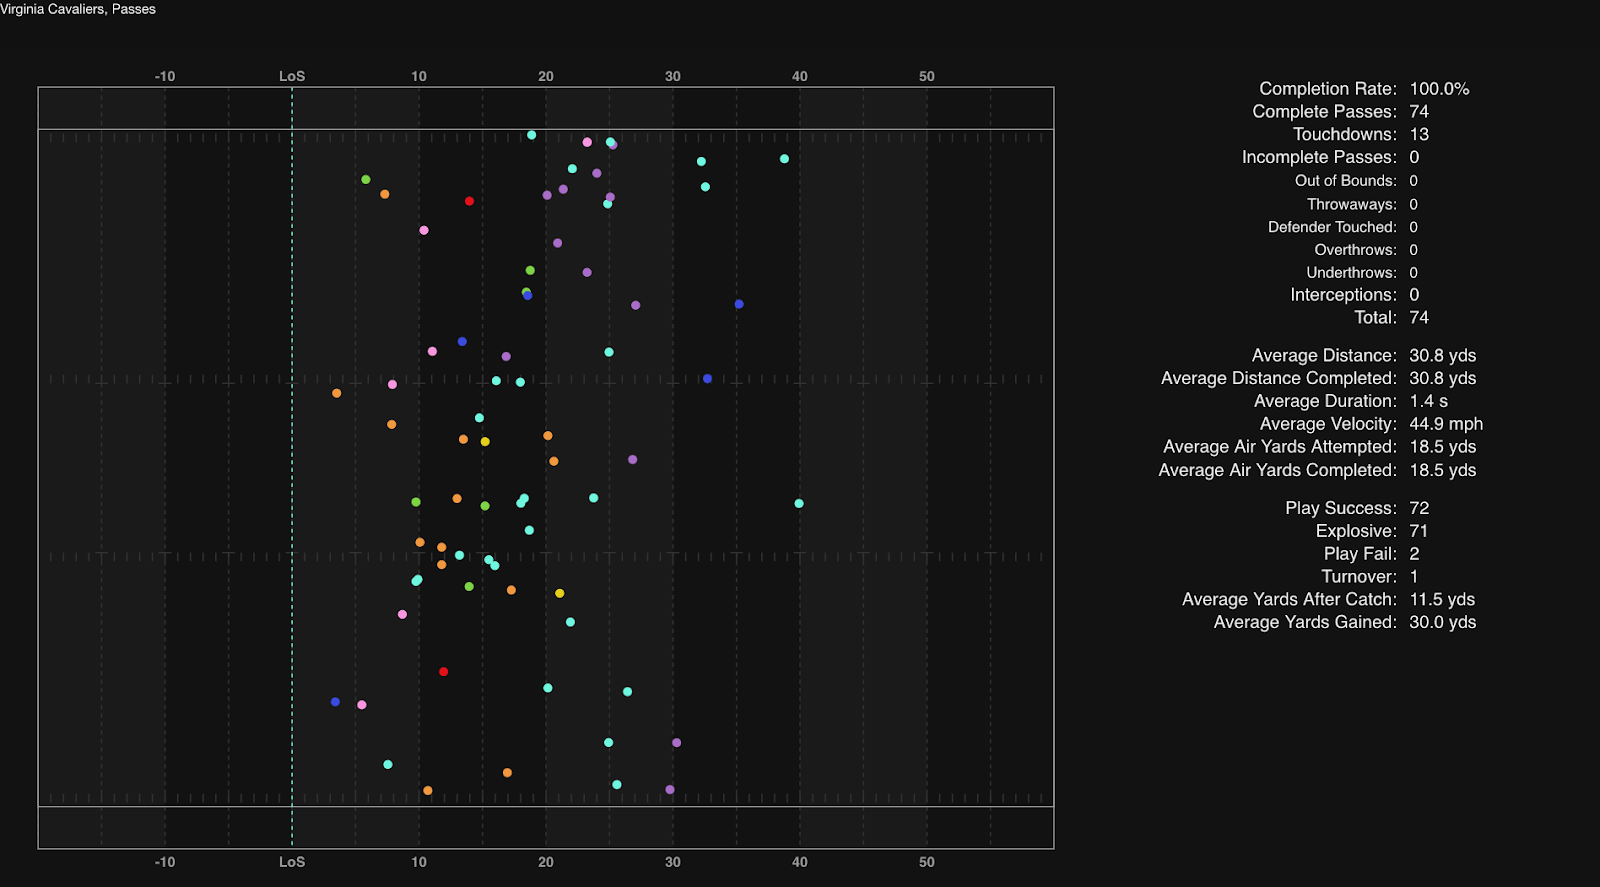
Another important aspect of our discussions with teams was the ability to color and filter by quarterback. What happens when you play a team who has two quarterbacks that play, and you aren’t sure which one to prepare for? Or how does a team’s scheme change when a quarterback is injured, and a new quarterback has to play? The image below shows the opponents passing attempts, colored by quarterback. Whichever quarterback plays, short passes are a key to this scheme. But if the quarterback represented by the blue dots plays, be ready for some deep shots down the right sideline, and a little bit more emphasis down the deep middle too.
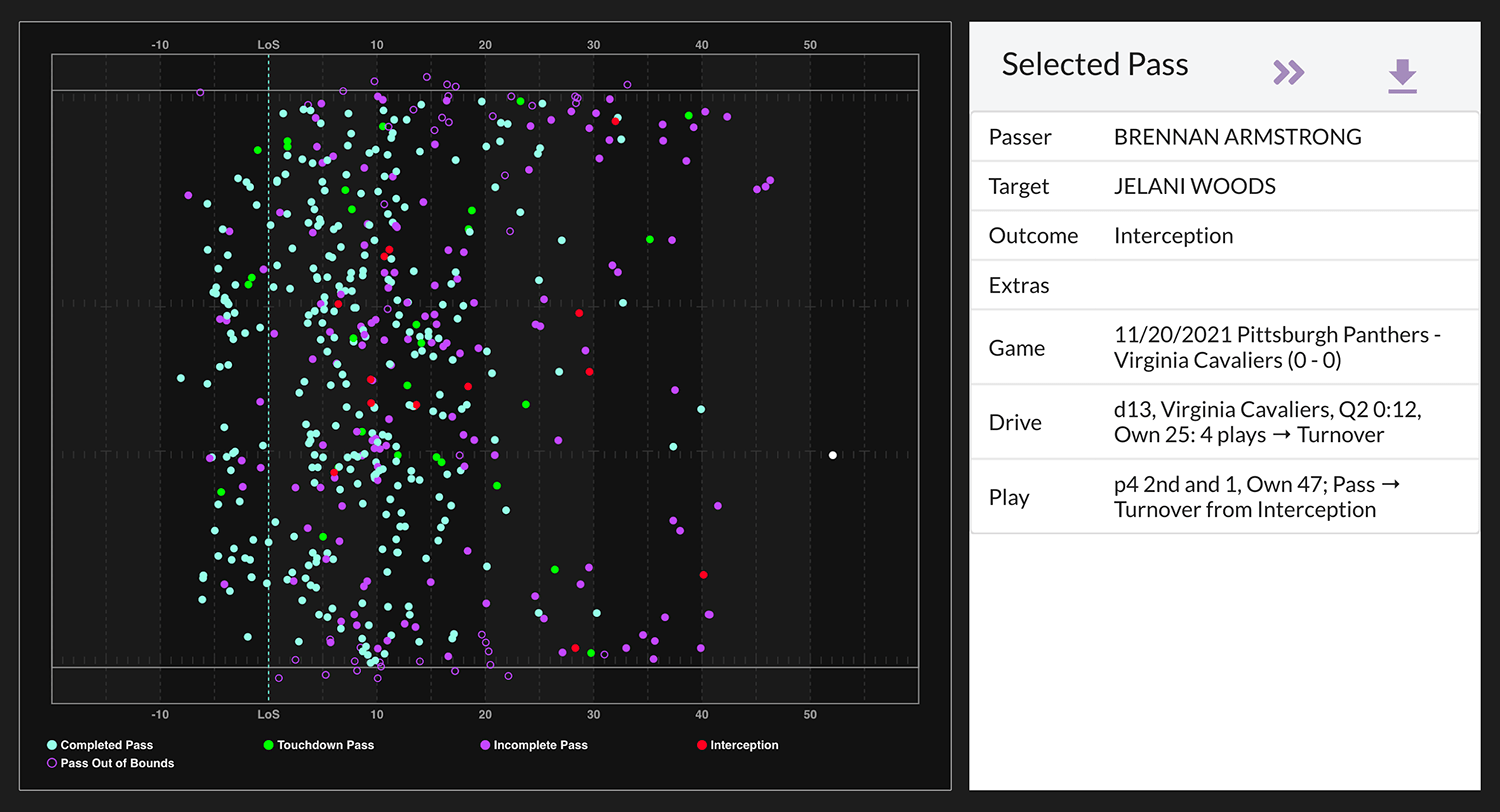
Coaches are questioners at heart, in a good way. One question we got a lot was, “Oohh, what happened at (points at a random dot) that dot?” Or, “that was a really long touchdown, what play was that again?” We recently added the ability to click on any of the passes, and it gives you the information from that pass, as well as a link to the play animation for that play for added context. The pass selected is the farthest pass to the right of the below image. This functionality helps a coach sort through quick plays and noticeable trends for an opponent.
Next is my favorite update and use case for the passing chart updates: heatmaps by targets. The gif below is 12 seconds long. And look at all the information you get from it! Especially how distinct each of the 6 heatmaps are from one another.
- The full heatmap tells me I should defend the middle of the field, 10-15 yards deep. That is a huge target area for the opponent.
- The top WR targeted in that area? Keytaon Thompson. He is the middle-of-the-field threat
- Who is the all-around playmaker? Dontayvion Wicks. He has heat zones all over the field.
- Possession receiver? Billy Kemp. Shorter targets, high completion percentage
- What else do we need to defend against? Ra’Shaun Henry on the sidelines.
- And this doesn’t even count big TE Jelani Woods and his targets.
In five minutes, a DB coach and defensive staff can get a great look into what an opponent is going to do. All of this is with one part of StatsBomb's tools. This gives coaches a chance to spend less time with cutups, and more time with their families (or more time on different cutups, getting into deeper breakdowns).
