How to run time-based SEO tests using Python
Learn how to run SEO tests in Python using EcommerceTools to fetch your Google Search Console data and evaluate performance using the Causal Impact model.

One of the problems with search engine optimisation or SEO is that search engine algorithms are essentially black boxes. They analyse so many on-page and off-page factors, and use multiple internal algorithms or meta-models that, I suspect, even Google’s own data scientists would have a tough time trying to understand exactly what influences a site to rank.
Couple this with the fast pace of algorithm updates, and the fact that it wouldn’t be in Google’s interests to tell you how to get your site to rank (seeing as they want to provide both a good user experience through excellent search results, and make money from serving paid search ads), and you can see why there is so much guess work involved in SEO.
SEO testing aims to take the guesswork out of the process, and allow you to move away from “guesseo” by using statistical testing to evaluate the impact that on-site changes have had upon your search engine performance. In this project, I’ll explain the basics of SEO testing and show you how you can run your own SEO tests using Python and my EcommerceTools package.
Time-based SEO tests
There are various ways to undertake SEO tests, but the easiest and most common is a time-based test, or before-and-after test. The main benefit of these simple tests is that they can be performed on historical data, allowing you to assess whether site or content changes to a page (or a group of pages) had an impact on their search engine performance.
Time-based SEO tests work by comparing the organic search performance metrics (such as impressions, clicks, click-through rate, and average position or rank) from the test period with that of the control period immediately before a change was made to the page or group of pages, and they typically use data extracted from Google Search Console.
The results for each period are then compared to evaluate whether the changes made had a statistically significant impact upon SEO performance, perhaps leading to the change then being rolled out across the entire site to further improve search engine performance. Time-based SEO testing doesn’t require any special code to be placed on the site, as it’s simply statistically examining a before and after period.
However, it can give misleading results if changes are made to the site, if off-site SEO has impacted the results, if there’s seasonality or other strong trends in traffic that may cause the data in adjacent periods to differ, and if Google delivers an algorithm change during the test period.
Causal Impact modeling
Most SEO testing tools use a simple two-tailed t-test to assess whether there was a statistically significant difference in SEO performance between the before and after periods. However, there is a more sophisticated way to evaluate SEO test performance - Causal Impact.
Causal Impact is a model originally developed by data scientists at Google and is designed to help statistically examine the effect that marketing activity had upon marketing performance. (After an original package was written in R by Brodersen and co-authors at Google, it was eventually re-implemented in Python. The code I’m using is based on the PyCausalImpact implementation, written by Will Fuks, not me.)
What’s clever about Causal Impact is that it includes a time-series forecasting model, so is able to predict what the marketing performance results would have been if no changes were made, and can then compare whether the marketing performance performed better than the forecast when the marketing treatment was applied. It can also show you the cumulative gains the marketing activity delivered.
Although using a model like Causal Impact will give you more statistically reliable results than the often-used before and after comparison, or a regular t-test, it isn’t totally foolproof or conclusive. Various things can happen that can make it look like an SEO test has worked, and may even appear to generate statistically significant results.
It’s still important to try and test subsets of pages if you can, and also to only make single changes to the pages, otherwise you risk tainting your data and generating misleading results that might actually be little better than you had before… That said, for time-based SEO tests, it’s as good as you’ll get.
Here’s a great video explaining the model from its creator Kay Brodersen. (Thanks to Python SEO expert Greg Bernhardt for the link.)
How to run an SEO test
To run an SEO test you will first need to come up with a hypothesis. For example, let’s say you’ve analysed your Google Search Console data and have identified the top-ranking keyword for each page on your site and have spotted that these aren’t always present in both the page title or the meta description.
If you added these top-ranking keywords to your page title and description, they might both rank higher in Google and be more visible to searchers, because Google shows them (and now semantically similar phrases) in bold in the search results, so that might lead to an increase in search impressions, CTR, and clicks.
You’d then identify the keyword opportunities, update a subset of pages (ideally on the same date), and create a list of the URLs you updated. You then need to wait patiently for Google to reindex the content and see if it impacts your SEO performance. Most people reckon this would typically be a 2-6 week period, depending on what you changed. Once you’ve waited for the data to come in and measure the statistical impact the change had, if any.
Import the packages
In this project, I’ll show you how you can analyse the data from an SEO test I did on my website to see if it helped improve search engine performance. To make it easier to perform SEO tests using the Causal Impact model and your Google Search Console data, I’ve added some functionality to my EcommerceTools package that allow you to run SEO tests quickly and easily, and for no cost. To get started, open a Jupyter notebook.
Install the latest version of my EcommerceTools package. You can do this via the terminal by entering pip3 install --upgrade ecommercetools, or by entering the command below in a Jupyter code cell and then executing it. Once you have installed EcommerceTools, import the seo module. This performs a range of SEO tasks, including querying the Google Search Console API.
!pip3 install --upgrade ecommercetools
from ecommercetools import seo
Configure your Google Search Console API connection
Next you need to create a client secrets JSON service account key with permission to authenticate against your
Google Search Console API data, and store the location of the JSON file in a variable called key.
If you check out my other guide to using EcommerceTools, you’ll be able to find some step by step instructions on setting this up. If anything, it’s the hardest part.
You’ll also need the URL of the Google Search Console property you want to query. These need to be exact, so you may need to check whether it starts with http:// or https:// if it doesn’t work. If you have a domain-level property, you will need to prefix it with sc-domain, i.e. sc-domain:example.com, otherwise GSC will throw an unhelpful 403 error.
key = "pds-client-secrets.json"
site_url = "sc-domain:practicaldatascience.co.uk"
Define your test period
These simple SEO tests can examine historic data by comparing a period after a change to the period immediately before, and then assessing the data to see if any differences are statistically significant. To define your test period you would define the post_period_start_date to be the day upon which you made your site changes (or the day after if you wish). You then set the test duration in days. You’ll need a reasonable time period for this to work well. Anything upwards of two weeks is usually fine.
I made a site change on July 18th 2021, so I’m running a 14 day test. EcommerceTools will calculate the start date for the test as 2021-07-18 and the end date 2021-07-31, 14 days ahead. This will be compared to the 14 day period immediately before the post_period_start_date, which would be 2021-07-04 to 2021-07-17.
post_period_start_date = '2021-07-18'
days = 14
Run a site-level SEO test
We’ll start off by running the most basic type of SEO test, which looks at data at the site-level. This examines all the Google Search Console data for your site to see whether your change has had an impact at the site-level. However, it does have a major shortcoming that I’ll explain later.
To do a site-level SEO test, we pass in the key, site_url, post_period_start_date, and days variables to the seo_test() function. Behind the scenes, this will go off to Google Search Console, fetch the data for your site for the two periods, fit a CausalImpact model, and return a model object that I’ve assigned to results.
By default, this will examine clicks from your Google Search Console data, but you can change the metric examined by passing in a different value, i.e. metric='impressions', metric='ctr', or metric='position'.
results = seo.seo_test(key, site_url, post_period_start_date, days)
We can then manipulate that object in various ways to see whether the test worked or not. The seo_test() function returns a CausalImpact model object, so you can interact with the output in the same way you can with a regular CausalImpact model. For example, to see the test results, you can print the results.summary().
print(results.summary())
Posterior Inference {Causal Impact}
                          Average            Cumulative
Actual                    344.36             4821.0
Prediction (s.d.)         243.01 (29.71)     3402.13 (415.92)
95% CI                    [187.57, 304.03]   [2625.97, 4256.36]

Absolute effect (s.d.)    101.35 (29.71)     1418.87 (415.92)
95% CI                    [40.33, 156.79]    [564.64, 2195.03]

Relative effect (s.d.)    41.71% (12.23%)    41.71% (12.23%)
95% CI                    [16.6%, 64.52%]    [16.6%, 64.52%]

Posterior tail-area probability p: 0.0
Posterior prob. of a causal effect: 100.0%

For more details run the command: print(impact.summary('report'))
While the results from results.summary() are quite easy to interpret if you’re statistically minded, you can also get them in a verbose written format, which helps explain what they mean. To access this output you need to print results.summary('report').
As shown below, this tells us that the model predicted we’d get 3402 clicks in the absence of changes to the content, but we actually generated many more, and the impact of the test was statistically significant, suggesting that my on-page optimisations may have actually worked.
print(results.summary('report'))
Analysis report {CausalImpact}


During the post-intervention period, the response variable had
an average value of approx. 344.36. By contrast, in the absence of an
intervention, we would have expected an average response of 243.01.
The 95% interval of this counterfactual prediction is [187.57, 304.03].
Subtracting this prediction from the observed response yields
an estimate of the causal effect the intervention had on the
response variable. This effect is 101.35 with a 95% interval of
[40.33, 156.79]. For a discussion of the significance of this effect,
see below.


Summing up the individual data points during the post-intervention
period (which can only sometimes be meaningfully interpreted), the
response variable had an overall value of 4821.0.
By contrast, had the intervention not taken place, we would have expected
a sum of 3402.13. The 95% interval of this prediction is [2625.97, 4256.36].


The above results are given in terms of absolute numbers. In relative
terms, the response variable showed an increase of +41.71%. The 95%
interval of this percentage is [16.6%, 64.52%].


This means that the positive effect observed during the intervention
period is statistically significant and unlikely to be due to random
fluctuations. It should be noted, however, that the question of whether
this increase also bears substantive significance can only be answered
by comparing the absolute effect (101.35) to the original goal
of the underlying intervention.


The probability of obtaining this effect by chance is very small
(Bayesian one-sided tail-area probability p = 0.0).
This means the causal effect can be considered statistically
significant.
Finally, you can create a visualisation of the time series forecast by printing results.plot(). This shows us the actual clicks y and the predicted number of clicks, along with a confidence interval, as well as a nice plot showing the cumulative effect the changes had.
Causal Impact includes many more advanced features than this, so if you need more than a basic assessment, you may wish to use the Causal Impact model manually rather than doing it all within EcommerceTools. However, for basic SEO tests, you can get decent results from this approach with barely a few lines of Python code.
print(results.plot())
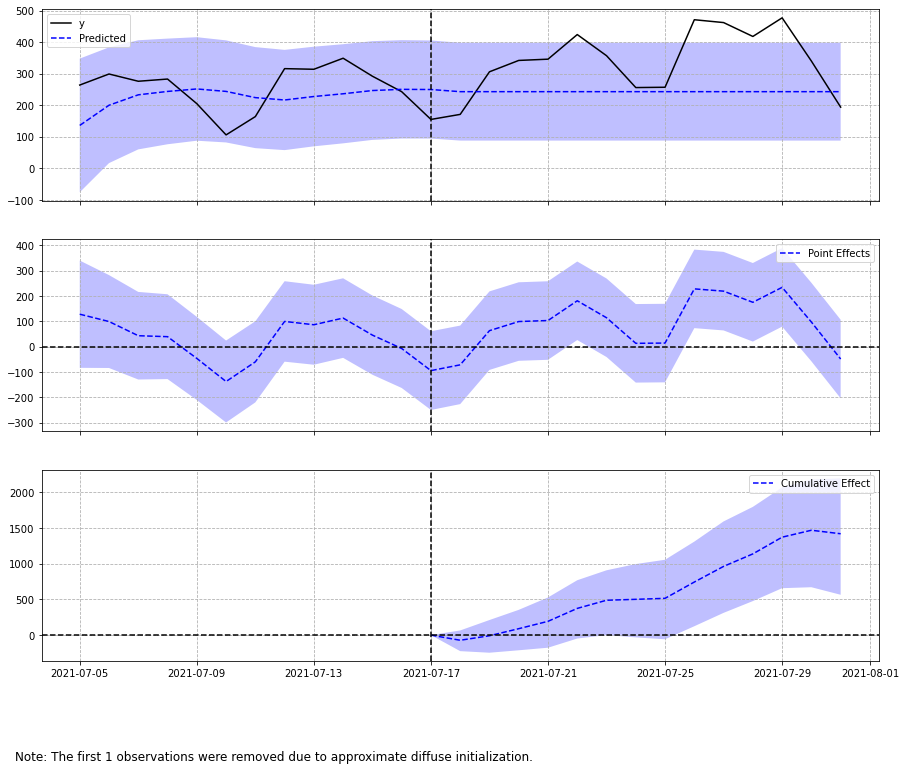
None
Run an SEO test on a single page
The downside of the site-wide test approach is that there are usually a wide range of changes being made to the average site. When many things are being changed, it can be difficult or impossible to pinpoint exactly what led to a given result.
It’s wise, therefore, to limit your tests to a page or better a group of pages. These are a much better choice, because with a site-level test, you can never be really sure that your observations aren’t simply linked to an algorithm update or something else unrelated to your changes.
To keep things simple, we’ll start with a test on a single page on the site. All we need to do differently is pass in some filters that tell the Google Search Console API to return only the data for a specific page on the site.
The filters data needs to be formatted in the manner that Google Search Console expects. In the simple example below, I’m telling Google Search Console to return data where the page dimension equals a given URL on the site. You can use any Google Search Console query you like here.
filters = [{
    'filters':[{
        'dimension':'page',
        'expression': 'https://practicaldatascience.co.uk/data-science/how-to-read-google-sheets-data-in-pandas-with-gspread'
    }]
}]
results = seo.seo_test(key, site_url, post_period_start_date, days, filters)
print(results.summary())
Posterior Inference {Causal Impact}
                          Average            Cumulative
Actual                    8.5                119.0
Prediction (s.d.)         3.36 (0.72)        47.05 (10.12)
95% CI                    [1.95, 4.79]       [27.36, 67.04]

Absolute effect (s.d.)    5.14 (0.72)        71.95 (10.12)
95% CI                    [3.71, 6.55]       [51.96, 91.64]

Relative effect (s.d.)    152.92% (21.51%)   152.92% (21.51%)
95% CI                    [110.45%, 194.77%] [110.45%, 194.77%]

Posterior tail-area probability p: 0.0
Posterior prob. of a causal effect: 100.0%

For more details run the command: print(impact.summary('report'))
print(results.summary('report'))
Analysis report {CausalImpact}


During the post-intervention period, the response variable had
an average value of approx. 8.5. By contrast, in the absence of an
intervention, we would have expected an average response of 3.36.
The 95% interval of this counterfactual prediction is [1.95, 4.79].
Subtracting this prediction from the observed response yields
an estimate of the causal effect the intervention had on the
response variable. This effect is 5.14 with a 95% interval of
[3.71, 6.55]. For a discussion of the significance of this effect,
see below.


Summing up the individual data points during the post-intervention
period (which can only sometimes be meaningfully interpreted), the
response variable had an overall value of 119.0.
By contrast, had the intervention not taken place, we would have expected
a sum of 47.05. The 95% interval of this prediction is [27.36, 67.04].


The above results are given in terms of absolute numbers. In relative
terms, the response variable showed an increase of +152.92%. The 95%
interval of this percentage is [110.45%, 194.77%].


This means that the positive effect observed during the intervention
period is statistically significant and unlikely to be due to random
fluctuations. It should be noted, however, that the question of whether
this increase also bears substantive significance can only be answered
by comparing the absolute effect (5.14) to the original goal
of the underlying intervention.


The probability of obtaining this effect by chance is very small
(Bayesian one-sided tail-area probability p = 0.0).
This means the causal effect can be considered statistically
significant.
print(results.plot())
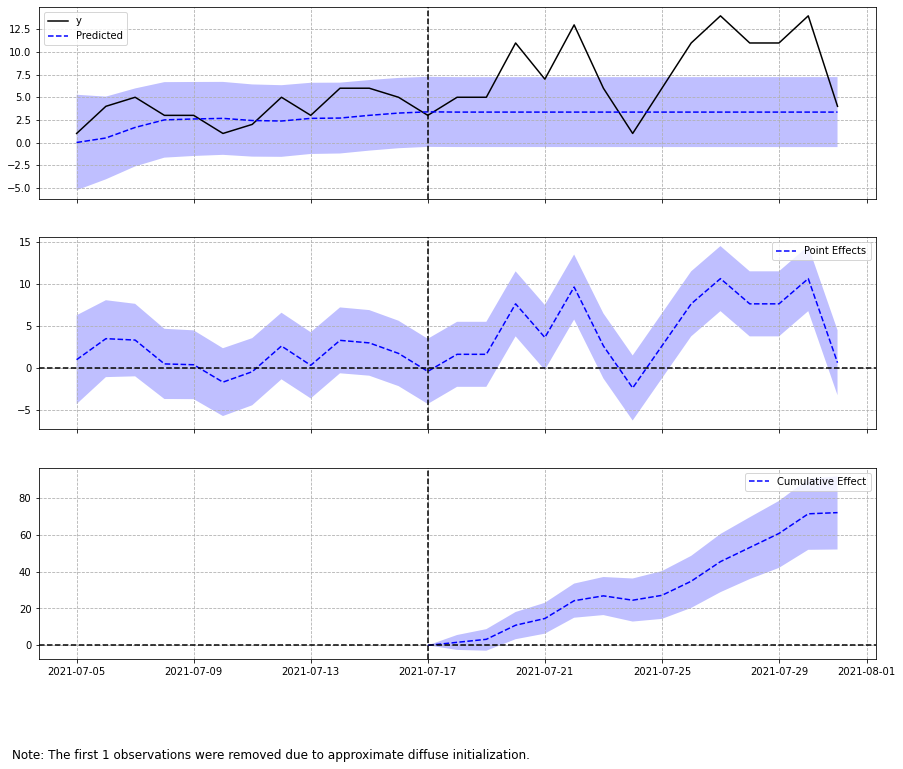
None
Run an SEO test on a section of a website
To run an SEO test on a specific section of a website you can use the contains operator and pass in an expression based on part of the URL structure. In the below example, I’m examining only pages from the /data-engineering/ category of the website to see if their performance changed as a result of my actions.
filters = [{
            'filters':[{
                'dimension':'page',
                'operator': 'contains',
                'expression': '/data-engineering/'
            }]
}]
results = seo.seo_test(key, site_url, post_period_start_date, days, filters)
print(results.summary())
Posterior Inference {Causal Impact}
                          Average            Cumulative
Actual                    16.86              236.0
Prediction (s.d.)         10.43 (1.65)       146.02 (23.08)
95% CI                    [7.32, 13.78]      [102.5, 192.98]

Absolute effect (s.d.)    6.43 (1.65)        89.98 (23.08)
95% CI                    [3.07, 9.54]       [43.02, 133.5]

Relative effect (s.d.)    61.62% (15.81%)    61.62% (15.81%)
95% CI                    [29.46%, 91.42%]   [29.46%, 91.42%]

Posterior tail-area probability p: 0.0
Posterior prob. of a causal effect: 100.0%

For more details run the command: print(impact.summary('report'))
print(results.summary('report'))
Analysis report {CausalImpact}


During the post-intervention period, the response variable had
an average value of approx. 16.86. By contrast, in the absence of an
intervention, we would have expected an average response of 10.43.
The 95% interval of this counterfactual prediction is [7.32, 13.78].
Subtracting this prediction from the observed response yields
an estimate of the causal effect the intervention had on the
response variable. This effect is 6.43 with a 95% interval of
[3.07, 9.54]. For a discussion of the significance of this effect,
see below.


Summing up the individual data points during the post-intervention
period (which can only sometimes be meaningfully interpreted), the
response variable had an overall value of 236.0.
By contrast, had the intervention not taken place, we would have expected
a sum of 146.02. The 95% interval of this prediction is [102.5, 192.98].


The above results are given in terms of absolute numbers. In relative
terms, the response variable showed an increase of +61.62%. The 95%
interval of this percentage is [29.46%, 91.42%].


This means that the positive effect observed during the intervention
period is statistically significant and unlikely to be due to random
fluctuations. It should be noted, however, that the question of whether
this increase also bears substantive significance can only be answered
by comparing the absolute effect (6.43) to the original goal
of the underlying intervention.


The probability of obtaining this effect by chance is very small
(Bayesian one-sided tail-area probability p = 0.0).
This means the causal effect can be considered statistically
significant.
print(results.plot())
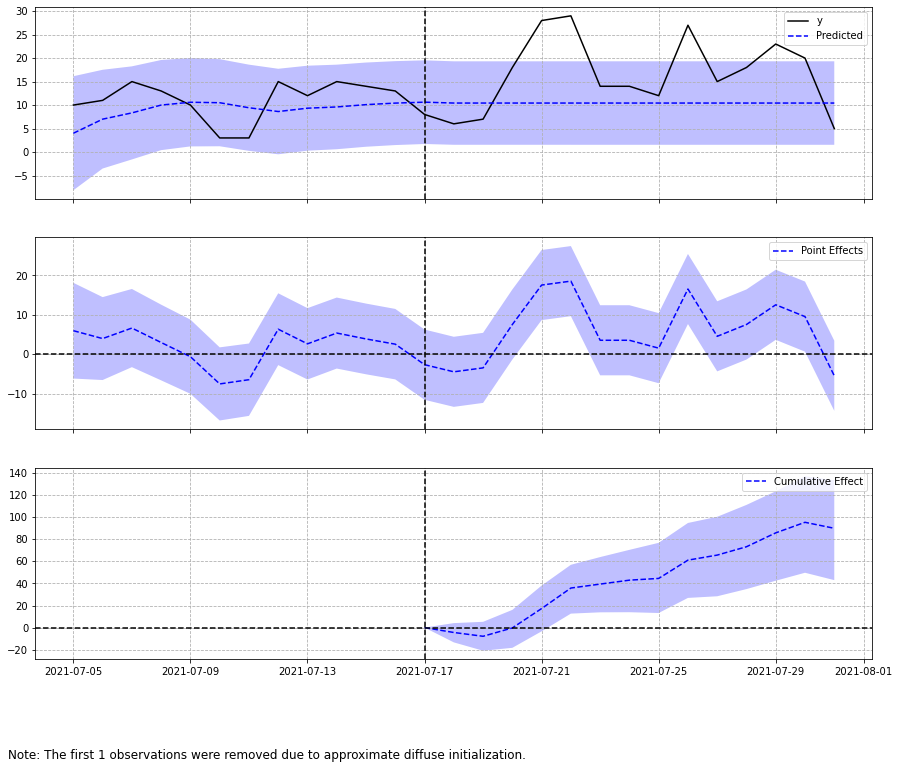
None
Run an SEO test on a group of pages
Finally, you can run an SEO test on a specific set of pages based on a list of URLs. It’s this last approach that is most useful and that I’d recommend you apply, since you avoid the issues associated with site-wide tests and it may not be feasible, or essential, to edit or optimise every page in a given category.
Annoyingly, while the Google Search Console interface now supports the use of regular expressions, you can’t currently pass in regex operators via the Google Search Console API. The only supported operator values are: contains, notContains, equals, or notEquals.
The workaround to this is to assemble a list of multiple filters. In the very simple example below, I’m checking to see whether changes made to two articles on machine learning techniques were impacted by an SEO change to the content. Ordinarily, you’d have many more URLs, but this shows the basic concept.
filters = [{
    'filters':[{
        'dimension':'page',
        'operator': 'equals',
        'expression': 'https://practicaldatascience.co.uk/data-science/how-to-identify-near-duplicate-content-using-lms'
    }],
    'filters':[{
        'dimension':'page',
        'operator': 'equals',
        'expression': 'https://practicaldatascience.co.uk/data-science/how-to-create-content-recommendations-using-tf-idf'
    }],
}]
As with the previous examples, you simply run the function and pass in the filters and EcommerceTools will fetch your Google Search Console data and use Causal Impact to assess whether your SEO changes worked or not. In the case of these two pages, performance actually declined and there was definitely no statistically significant impact caused by my changes.
results = seo.seo_test(key, site_url, post_period_start_date, days, filters)
print(results.summary())
Posterior Inference {Causal Impact}
                          Average            Cumulative
Actual                    2.64               37.0
Prediction (s.d.)         3.29 (0.69)        45.99 (9.69)
95% CI                    [1.97, 4.68]       [27.56, 65.52]

Absolute effect (s.d.)    -0.64 (0.69)       -8.99 (9.69)
95% CI                    [-2.04, 0.67]      [-28.52, 9.44]

Relative effect (s.d.)    -19.55% (21.06%)   -19.55% (21.06%)
95% CI                    [-62.01%, 20.53%]  [-62.01%, 20.53%]

Posterior tail-area probability p: 0.16
Posterior prob. of a causal effect: 84.12%

For more details run the command: print(impact.summary('report'))
print(results.summary('report'))
Analysis report {CausalImpact}


During the post-intervention period, the response variable had
an average value of approx. 2.64. In the absence of an
intervention, we would have expected an average response of 3.29.
The 95% interval of this counterfactual prediction is [1.97, 4.68].
Subtracting this prediction from the observed response yields
an estimate of the causal effect the intervention had on the
response variable. This effect is -0.64 with a 95% interval of
[-2.04, 0.67]. For a discussion of the significance of this effect,
see below.


Summing up the individual data points during the post-intervention
period (which can only sometimes be meaningfully interpreted), the
response variable had an overall value of 37.0.
Had the intervention not taken place, we would have expected
a sum of 45.99. The 95% interval of this prediction is [27.56, 65.52].


The above results are given in terms of absolute numbers. In relative
terms, the response variable showed a decrease of -19.55%. The 95%
interval of this percentage is [-62.01%, 20.53%].
This means that, although it may look as though the intervention has
exerted a negative effect on the response variable when considering
the intervention period as a whole, this effect is not statistically
significant and so cannot be meaningfully interpreted.


The apparent effect could be the result of random fluctuations that
are unrelated to the intervention. This is often the case when the
intervention period is very long and includes much of the time when
the effect has already worn off. It can also be the case when the
intervention period is too short to distinguish the signal from the
noise. Finally, failing to find a significant effect can happen when
there are not enough control variables or when these variables do not
correlate well with the response variable during the learning period.


The probability of obtaining this effect by chance is p = 15.88%.
This means the effect may be spurious and would generally not be
considered statistically significant.
print(results.plot())
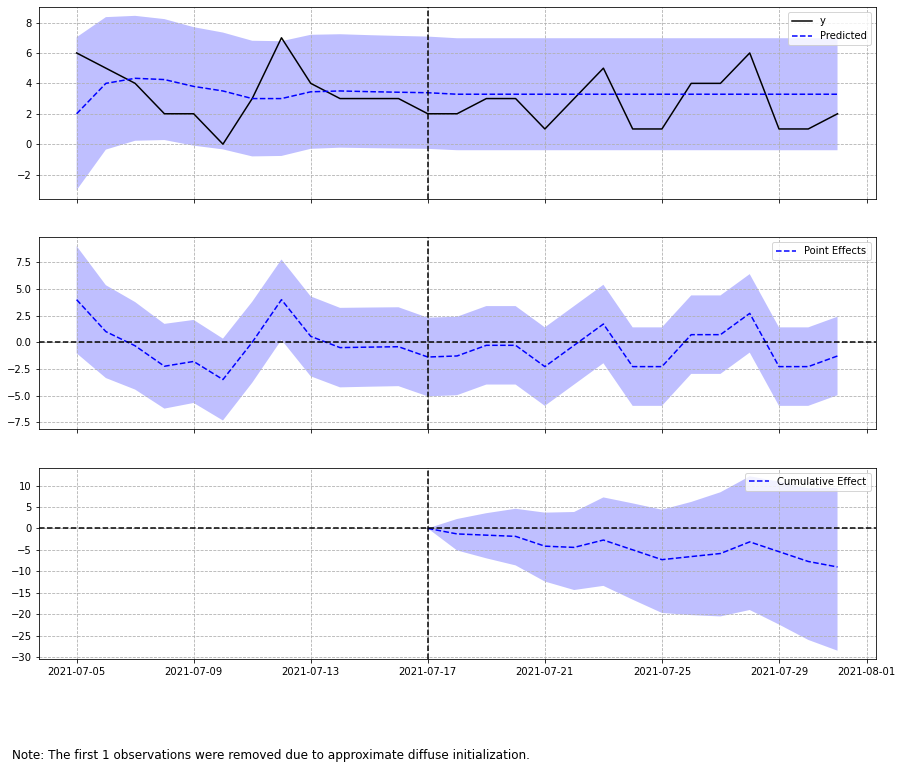
None
Accessing the model results
Finally, if you want to dig deeper into the model outputs, you can examine the inferences Pandas dataframe returned by Causal Impact. This includes the predictions, the actual data, and the cumulative gains (or losses) generated as a result of your content optimisations.
Since the performance of CausalImpact is tied to the underlying forecast quality, if you experience big seasonal changes, or there’s the potential for other non-test factors to influence your data, you may need to use a more sophisticated approach or use CausalImpact directly. However, for basic SEO testing, this seems a pretty good approach and requires very little code.
results.inferences.head()
| post_cum_y | preds | post_preds | post_preds_lower | post_preds_upper | preds_lower | preds_upper | post_cum_pred | post_cum_pred_lower | post_cum_pred_upper | point_effects | point_effects_lower | point_effects_upper | post_cum_effects | post_cum_effects_lower | post_cum_effects_upper | |
|---|---|---|---|---|---|---|---|---|---|---|---|---|---|---|---|---|
| 2021-07-04 | NaN | 3.285714 | NaN | NaN | NaN | -3425.938758 | 3432.510187 | NaN | NaN | NaN | -1.285714 | -3430.510187 | 3427.938758 | NaN | NaN | NaN |
| 2021-07-05 | NaN | 2.000001 | NaN | NaN | NaN | -3.032760 | 7.032763 | NaN | NaN | NaN | 3.999999 | -1.032763 | 9.032760 | NaN | NaN | NaN |
| 2021-07-06 | NaN | 4.000064 | NaN | NaN | NaN | -0.358483 | 8.358611 | NaN | NaN | NaN | 0.999936 | -3.358611 | 5.358483 | NaN | NaN | NaN |
| 2021-07-07 | NaN | 4.333412 | NaN | NaN | NaN | 0.224090 | 8.442733 | NaN | NaN | NaN | -0.333412 | -4.442733 | 3.775910 | NaN | NaN | NaN |
| 2021-07-08 | NaN | 4.250040 | NaN | NaN | NaN | 0.271164 | 8.228916 | NaN | NaN | NaN | -2.250040 | -6.228916 | 1.728836 | NaN | NaN | NaN |
Further reading
- Brodersen, K.H., Gallusser, F., Koehler, J., Remy, N. and Scott, S.L., 2015. Inferring causal impact using Bayesian structural time-series models. The Annals of Applied Statistics, 9(1), pp.247-274.
Matt Clarke, Saturday, August 14, 2021


Other posts you might like

How to use the Pandas truncate() function
Have you ever needed to chop the top or bottom off a Pandas dataframe, or extract a specific section from the middle? If so, there’s a Pandas function called truncate()...

How to use Spacy for noun phrase extraction
Noun phrase extraction is a Natural Language Processing technique that can be used to identify and extract noun phrases from text. Noun phrases are phrases that function grammatically as nouns...
