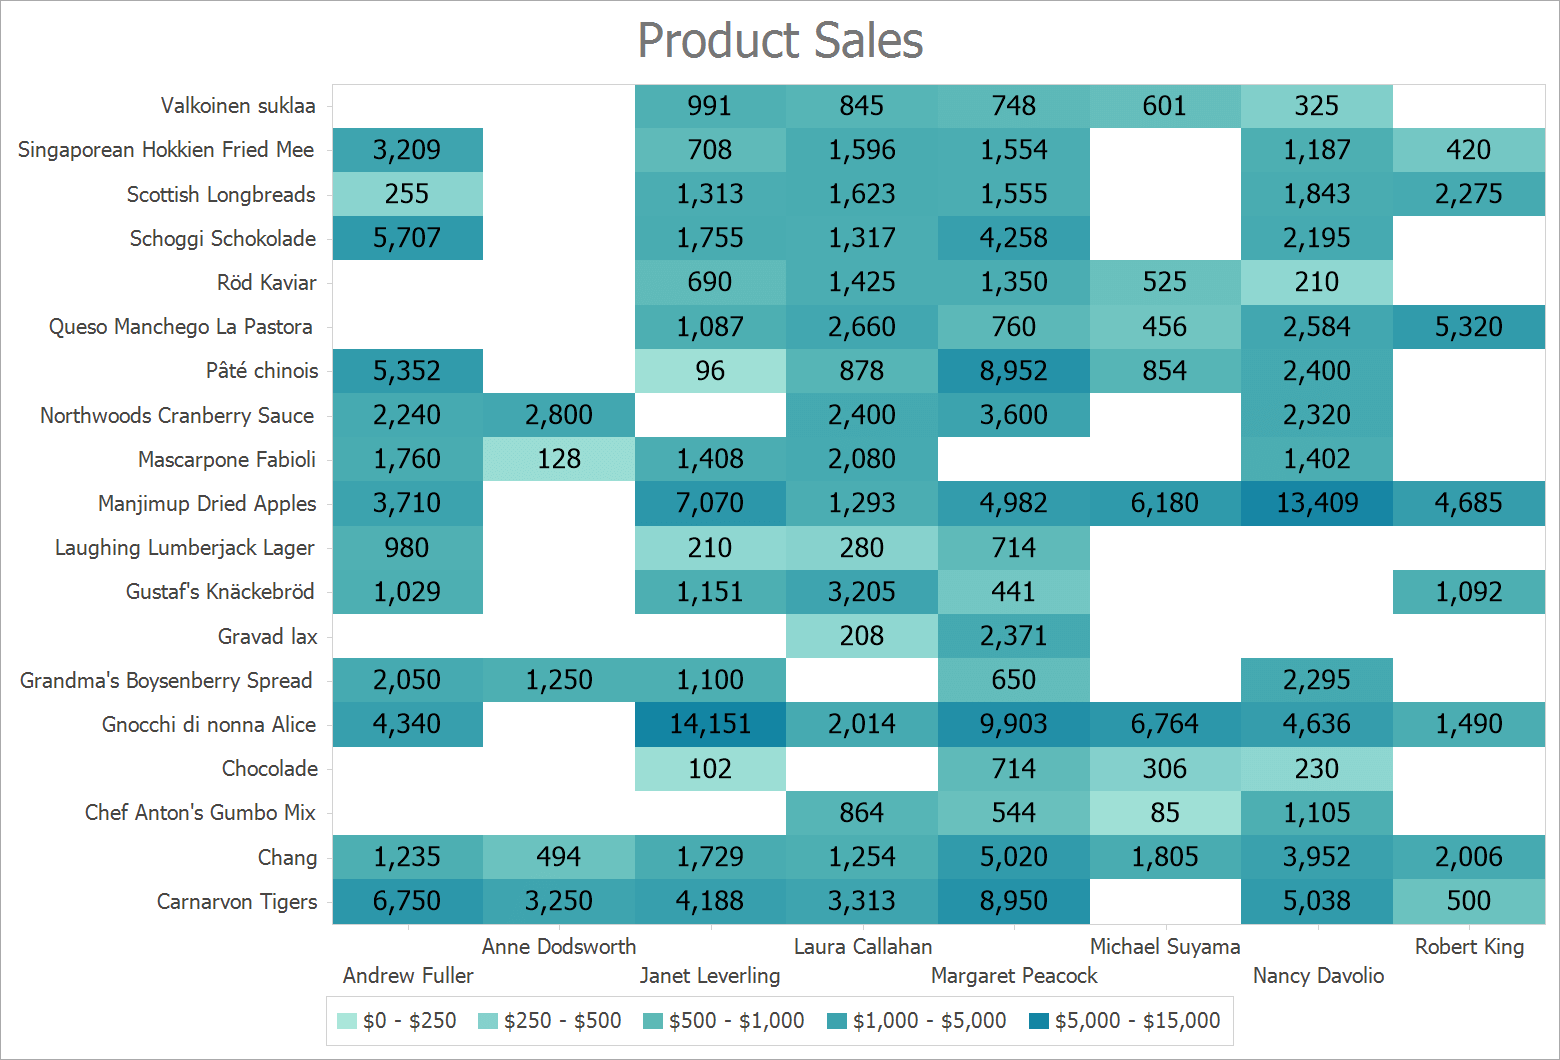
As you know, a heatmap is a chart, where individual values are displayed in a grid using different color shades. You can quickly spot the highest and lowest values based on cell background color.
Heatmaps can address a variety of data visualization requirements. For instance, the following employee sales data visualization can help fine-tune an organization’s sales strategy for each team member.
Heatmap Capabilities
The DevExpress Heatmap for WinForms and WPF ships with the following built-in features/capabilities:
- Data Binding support
- Unbound Mode
- Coloring Algorithms
- Zoom and Scroll support
- Hit-testing
- Highlighting, Tooltips, and Labels for Cells
- Legend
- Customizable axes
- Axis titles
- Support for Skins and Themes
- Print and Export options
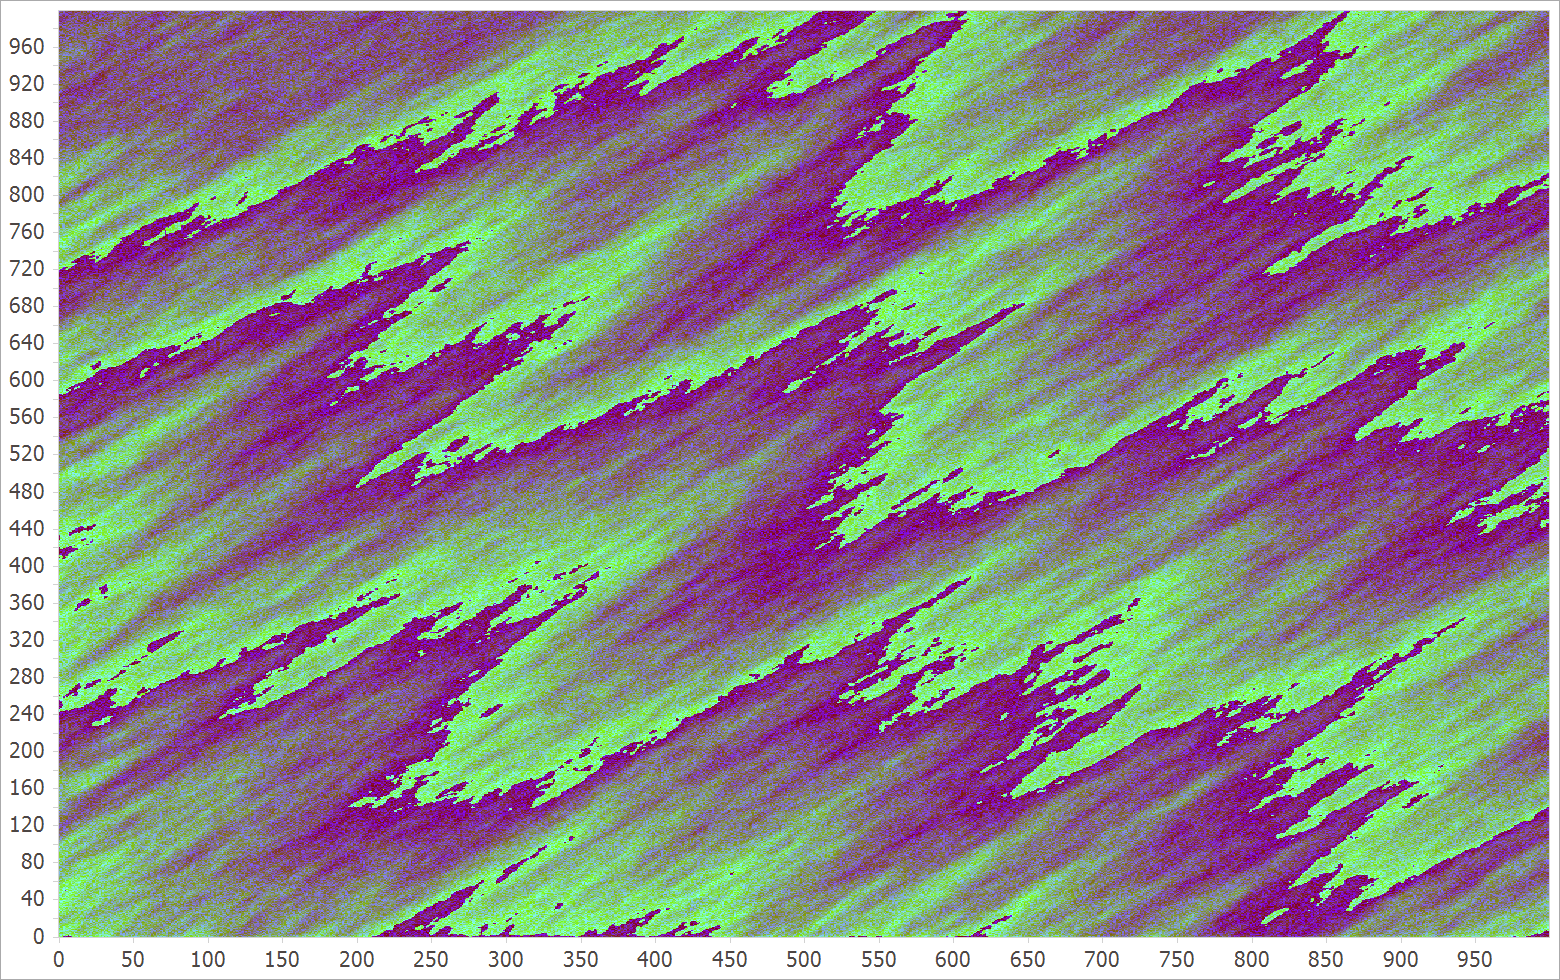
A crucial feature for any data visualization UI control is the ability to efficiently manage memory consumption and handle real-time updates. These are especially important when your app processes millions of input values. Our current implementation allows you to refresh the Heatmap’s layout at ~15 FPS when visualizing up to 1M points on a 4K display - while still keeping memory usage as low as possible (~80MB).
If you are ready to incorporate the DevExpress Heatmap in your next WinForms or WPF project, please review the following help topics:
If you already installed the latest version of DevExpress WinForms/WPF components, you can explore the capabilities of our Heatmap Control within the Demo Center:
Future Enhancements
We continue to collect user feedback and will prioritize future Heatmap Control enhancements based on community input. Here are a few things we’re currently considering:
- Gradient Legend
- Save & Restore Layout
- Selection
If you have specific needs/requirements as it relates to our WinForms/WPF Heatmap Control, leave a comment below or create a new support ticket in the DevExpress Support Center.
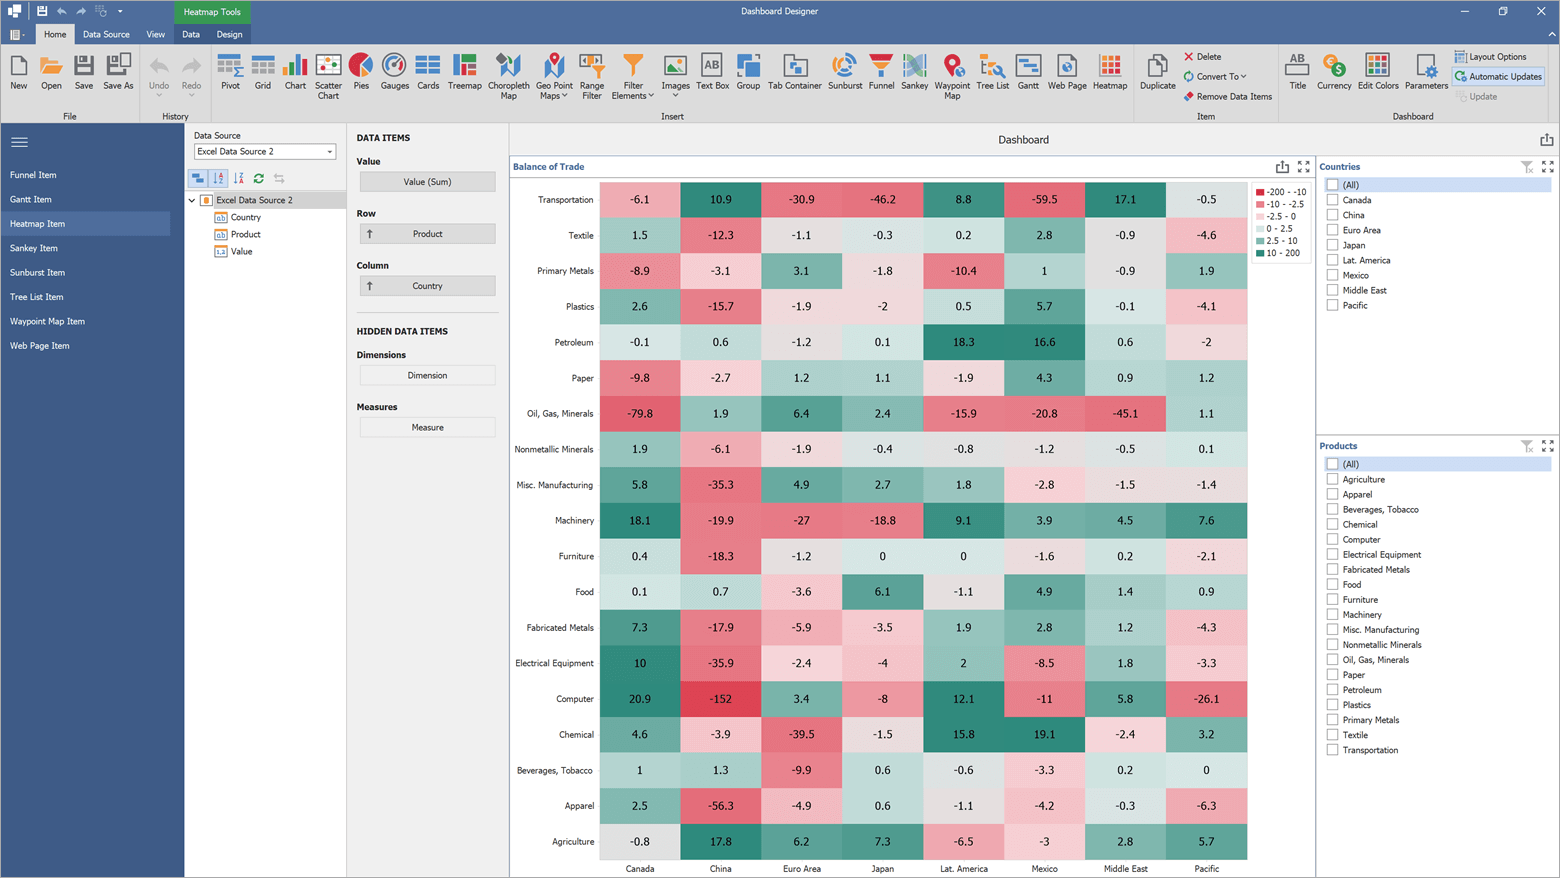
Heatmap Item for BI Dashboard
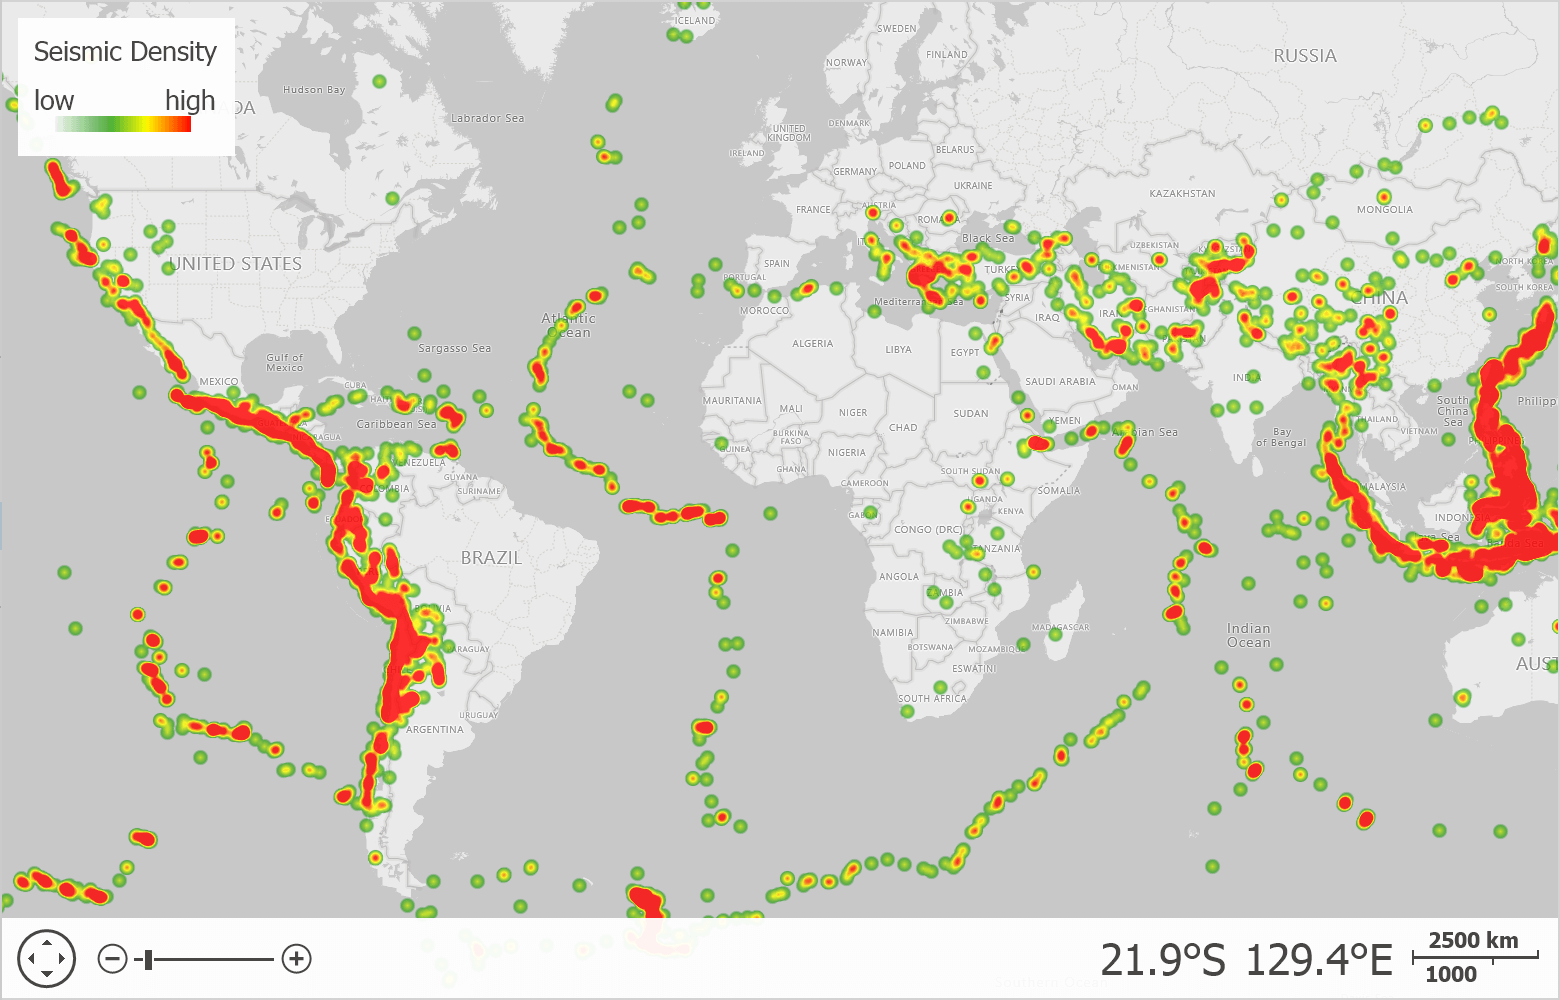
Heatmaps in the Map Control
A quick note for those planning to integrate cartographic maps in their apps.
Our
WinForms Map and
WPF Map controls can visualize geographical point data via a heatmap layer and supports common appearance customization options such as color gradient, opacity, and data point radius.
Your Feedback
As always, we welcome your feedback. If you’re considering the Heatmap Control for an upcoming project or if you have technical questions, please post a comment below. We’ll be happy to follow-up.
Free DevExpress Products - Get Your Copy Today
The following free DevExpress product offers remain available. Should you have any questions about the free offers below, please submit a ticket via the
DevExpress Support Center at your convenience. We'll be happy to follow-up.