
One of the main purposes of using data for evaluating player performance is to use past information to project how well a player will do going forward.
Although it is fun to know how good a player was in a given year, a club's coaching and recruitment staff have their eye on the future and are looking for ways to accurately predict how well players will do in the next game or season.
Most traditional metrics turn out not to be very predictive, particularly when it comes to assessing defensive performance. That is the purpose of this study: to figure out if PFF data is able to predict the performance of players in challenges, an important piece of the defensive puzzle.
Challenges are defined as a combination of duels (both aerial and 50/50), tackles and defending dribbles. The PFF Challenge Grade is a comprehensive metric that includes all play-by-play grades assigned to players involved in such events.
These play-by-play grades range from -2 to +2 in increments of 0.5, with 0 representing the average or expected grade. The outcome of the event itself doesn't necessarily determine the grade, as players can receive a high grade even if they don't win the challenge outright.
For example, a player can still receive a high grade if they manage to force their opponent to put the ball out of play. The grades are adjusted for the specific circumstances of the event before being converted to a scale of 0-100.
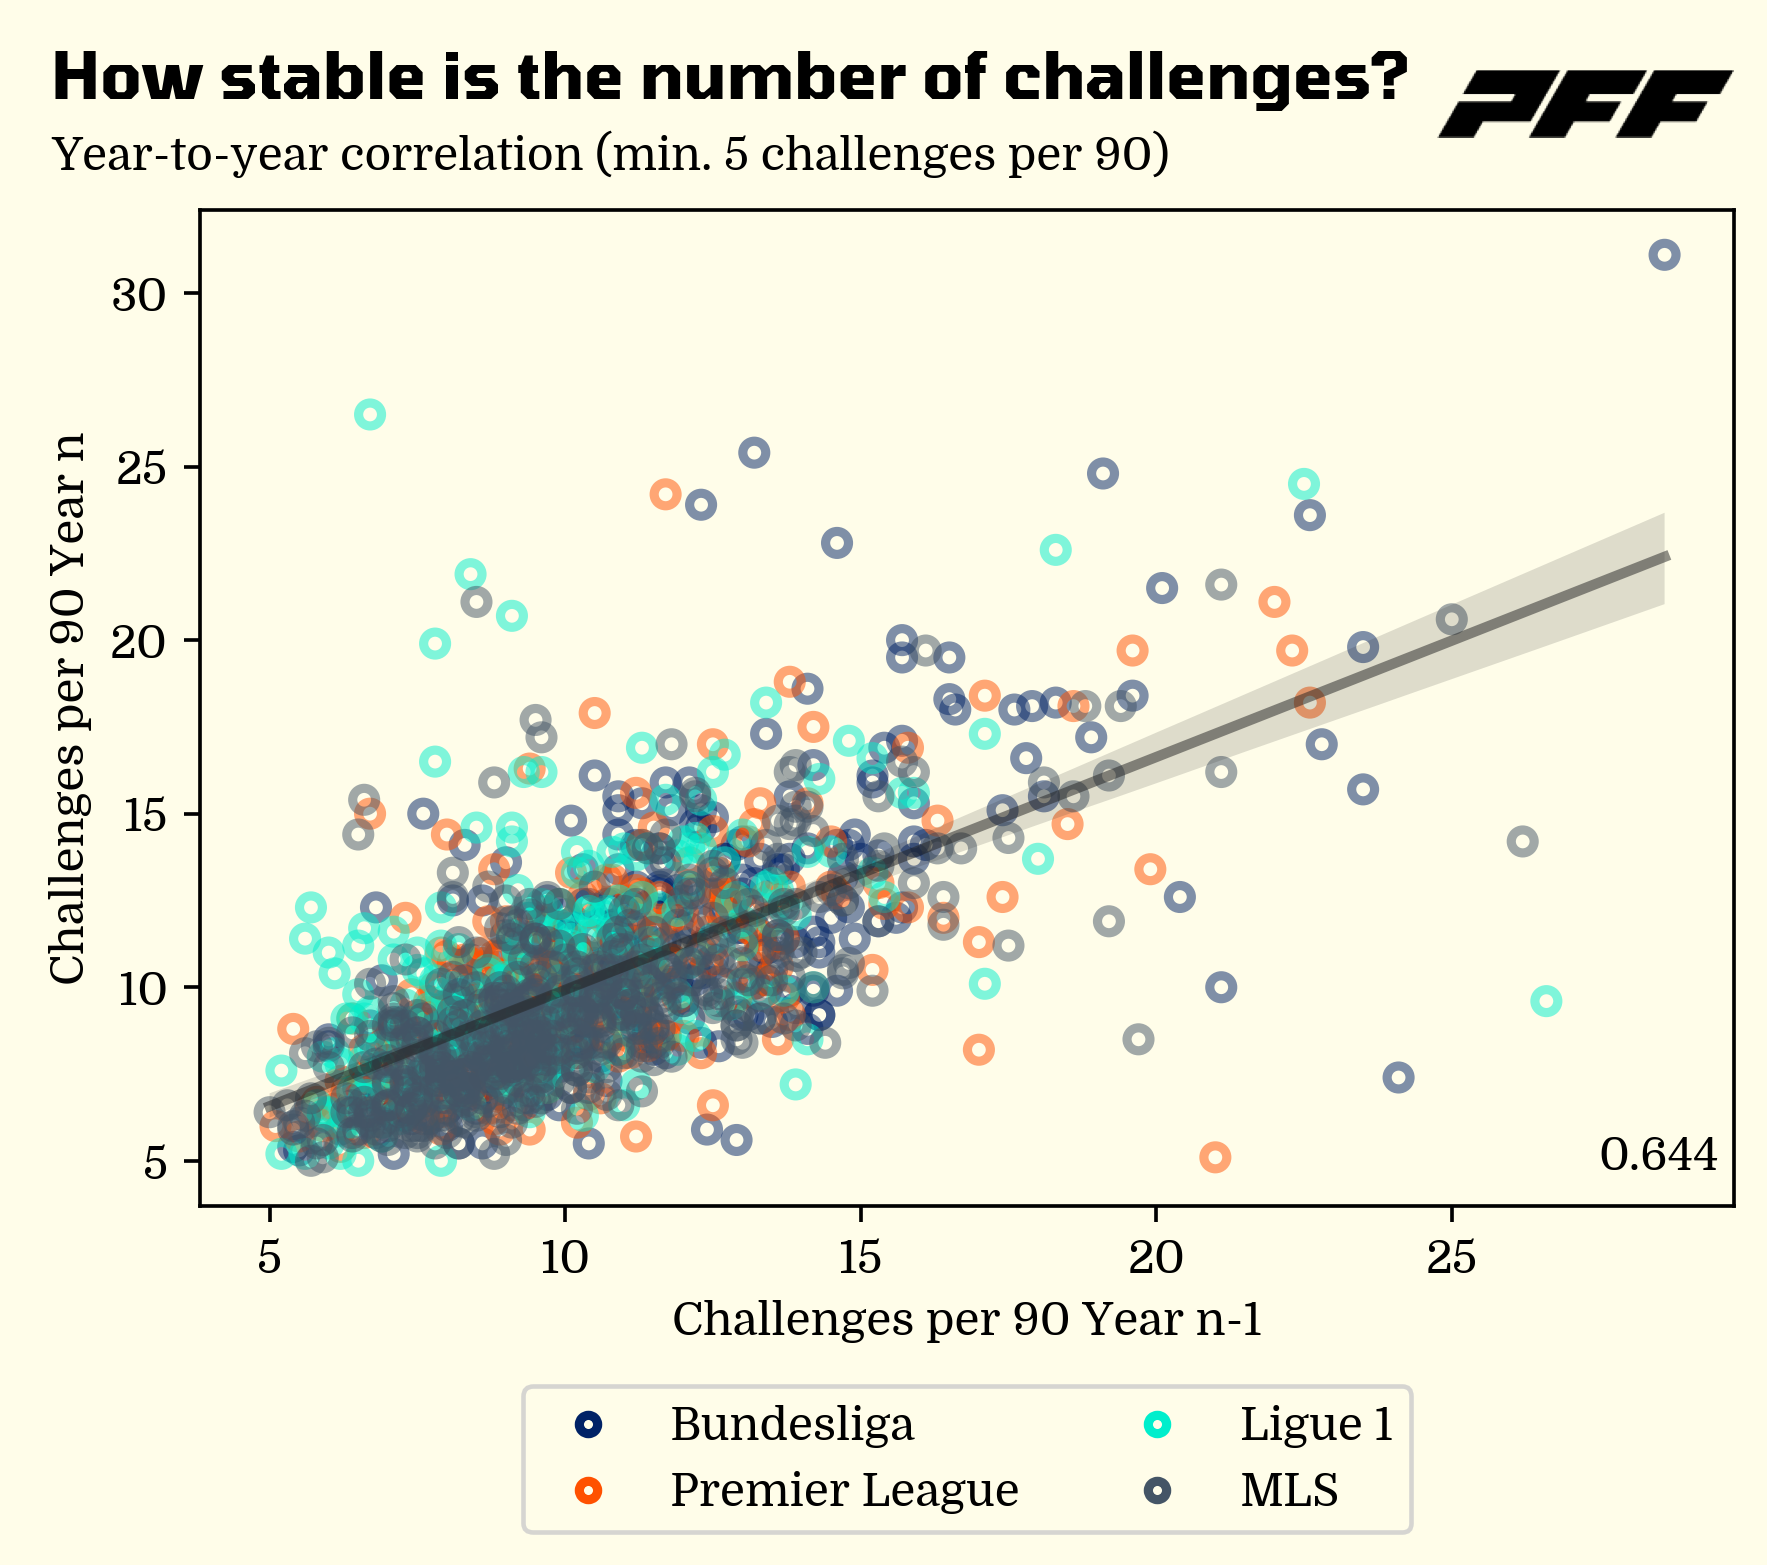
Let's begin by looking at the number of challenges from year to year. In the graph below, we see the number of challenges per-90 minutes in the previous season plotted against the next. For MLS, this compares 2021 to 2022, and 2021-2022 to 2022-2023 for the other competitions. The year-to-year correlation is 0.644, which suggests that there is a moderately positive relationship between the number of challenges a player faced in the previous season and the number they will face in the next. In other words, players who face a higher number of challenges in a season are likely to face a similarly high number in the next.
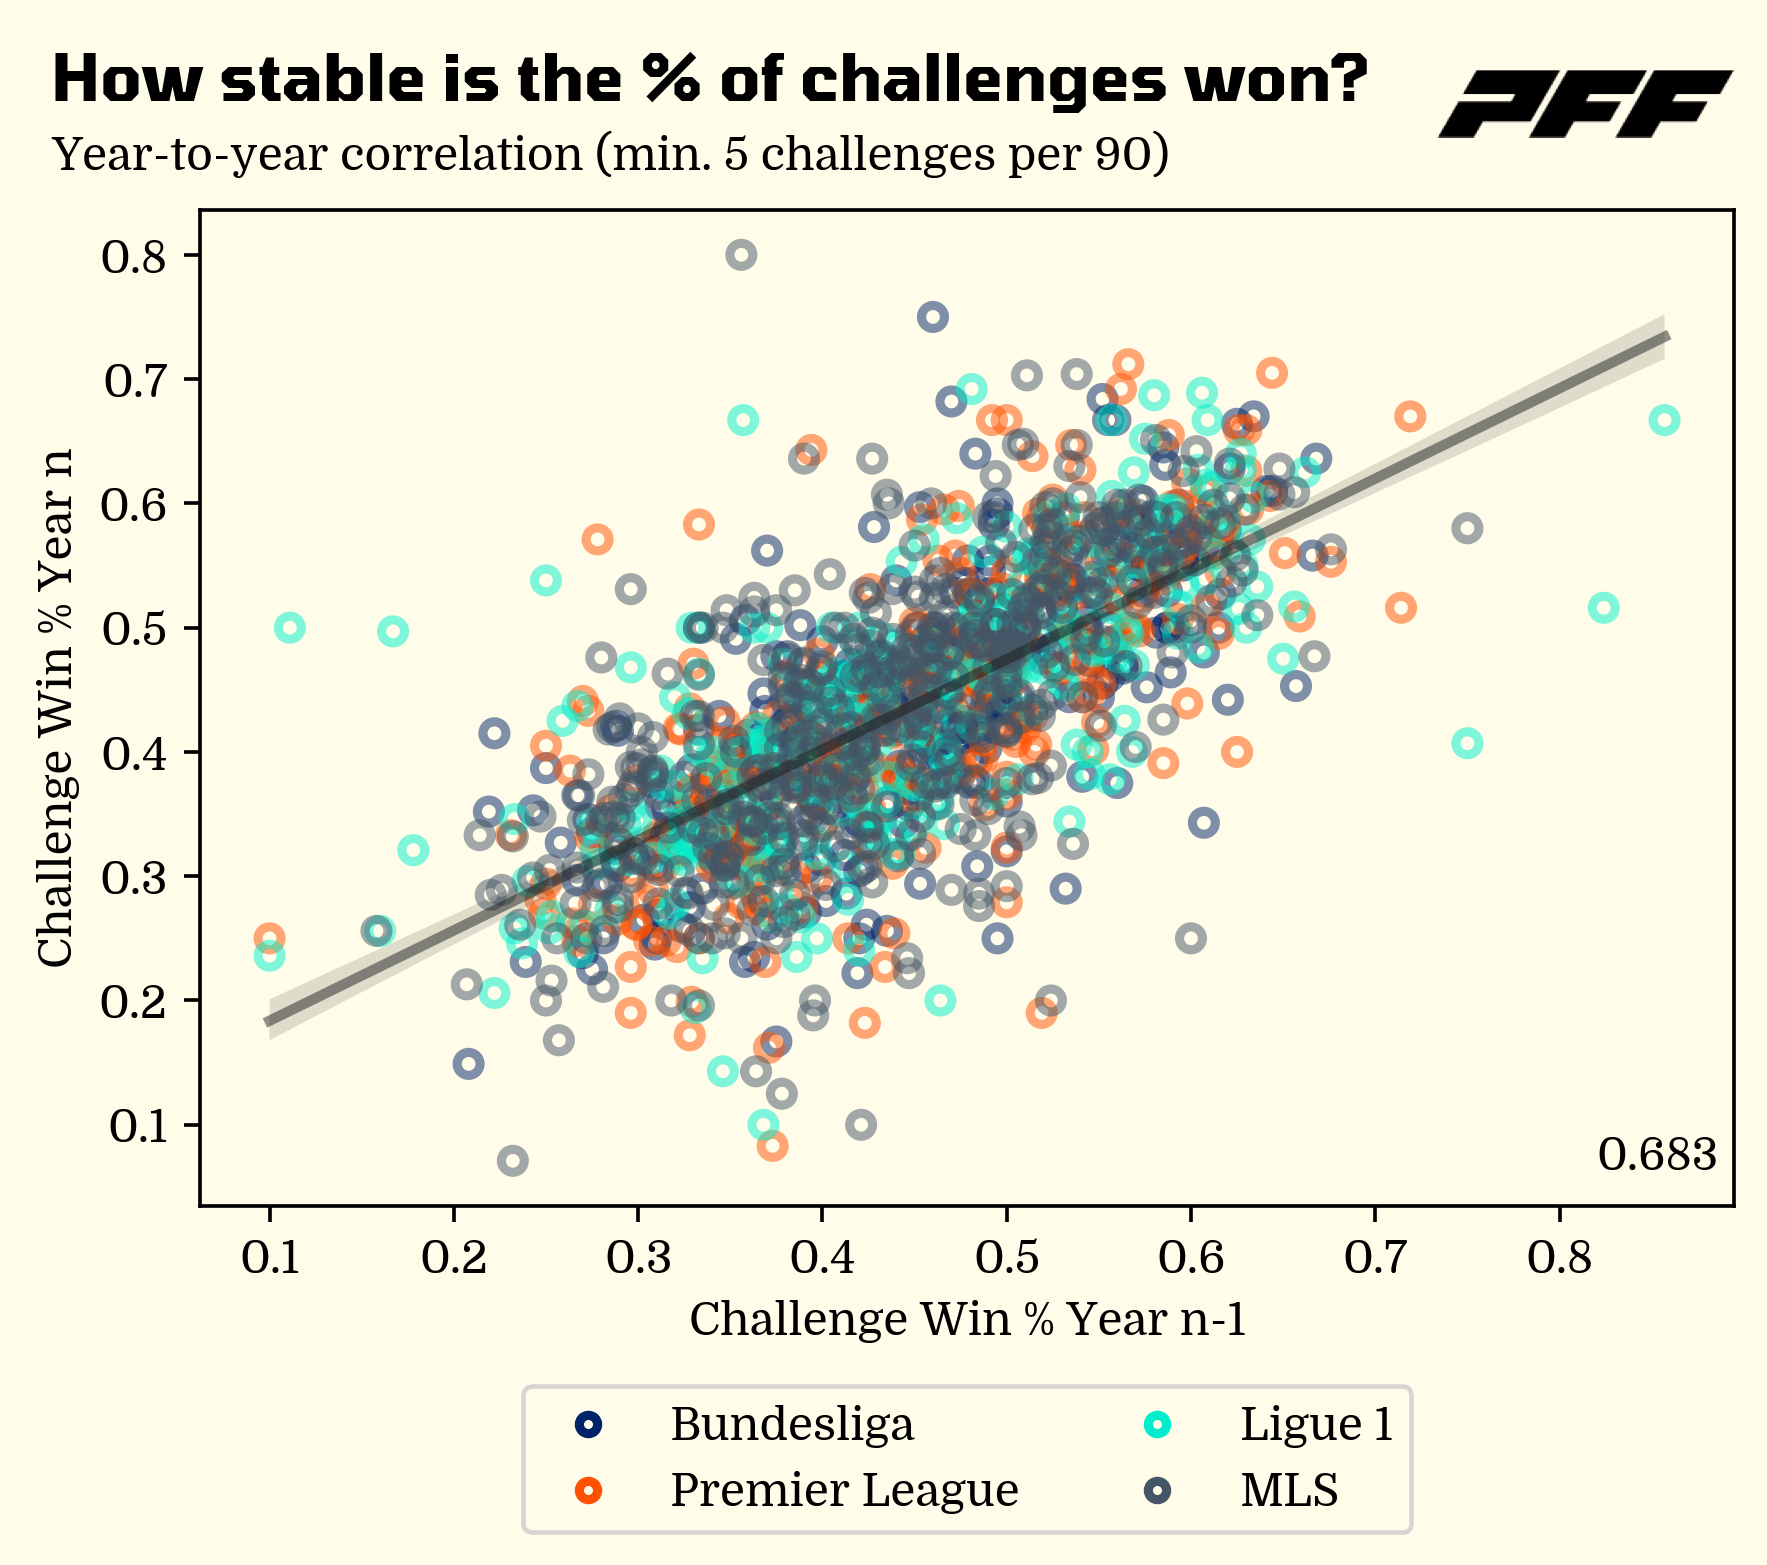
But the amount of challenges a player is involved in does not tell us anything about his performance. The graph below plots the percentage of challenges won in both seasons for the same sample of players.
The correlation rises somewhat compared to challenges per-90 minutes. At 0.683, the correlation suggests that there is also a moderately positive relationship between a player's success rate in challenges from the previous season to the next.
In other words, players who win a high percentage of challenges in a season are likely to reproduce their success rate in the next, but there are numerous exceptions to be found.
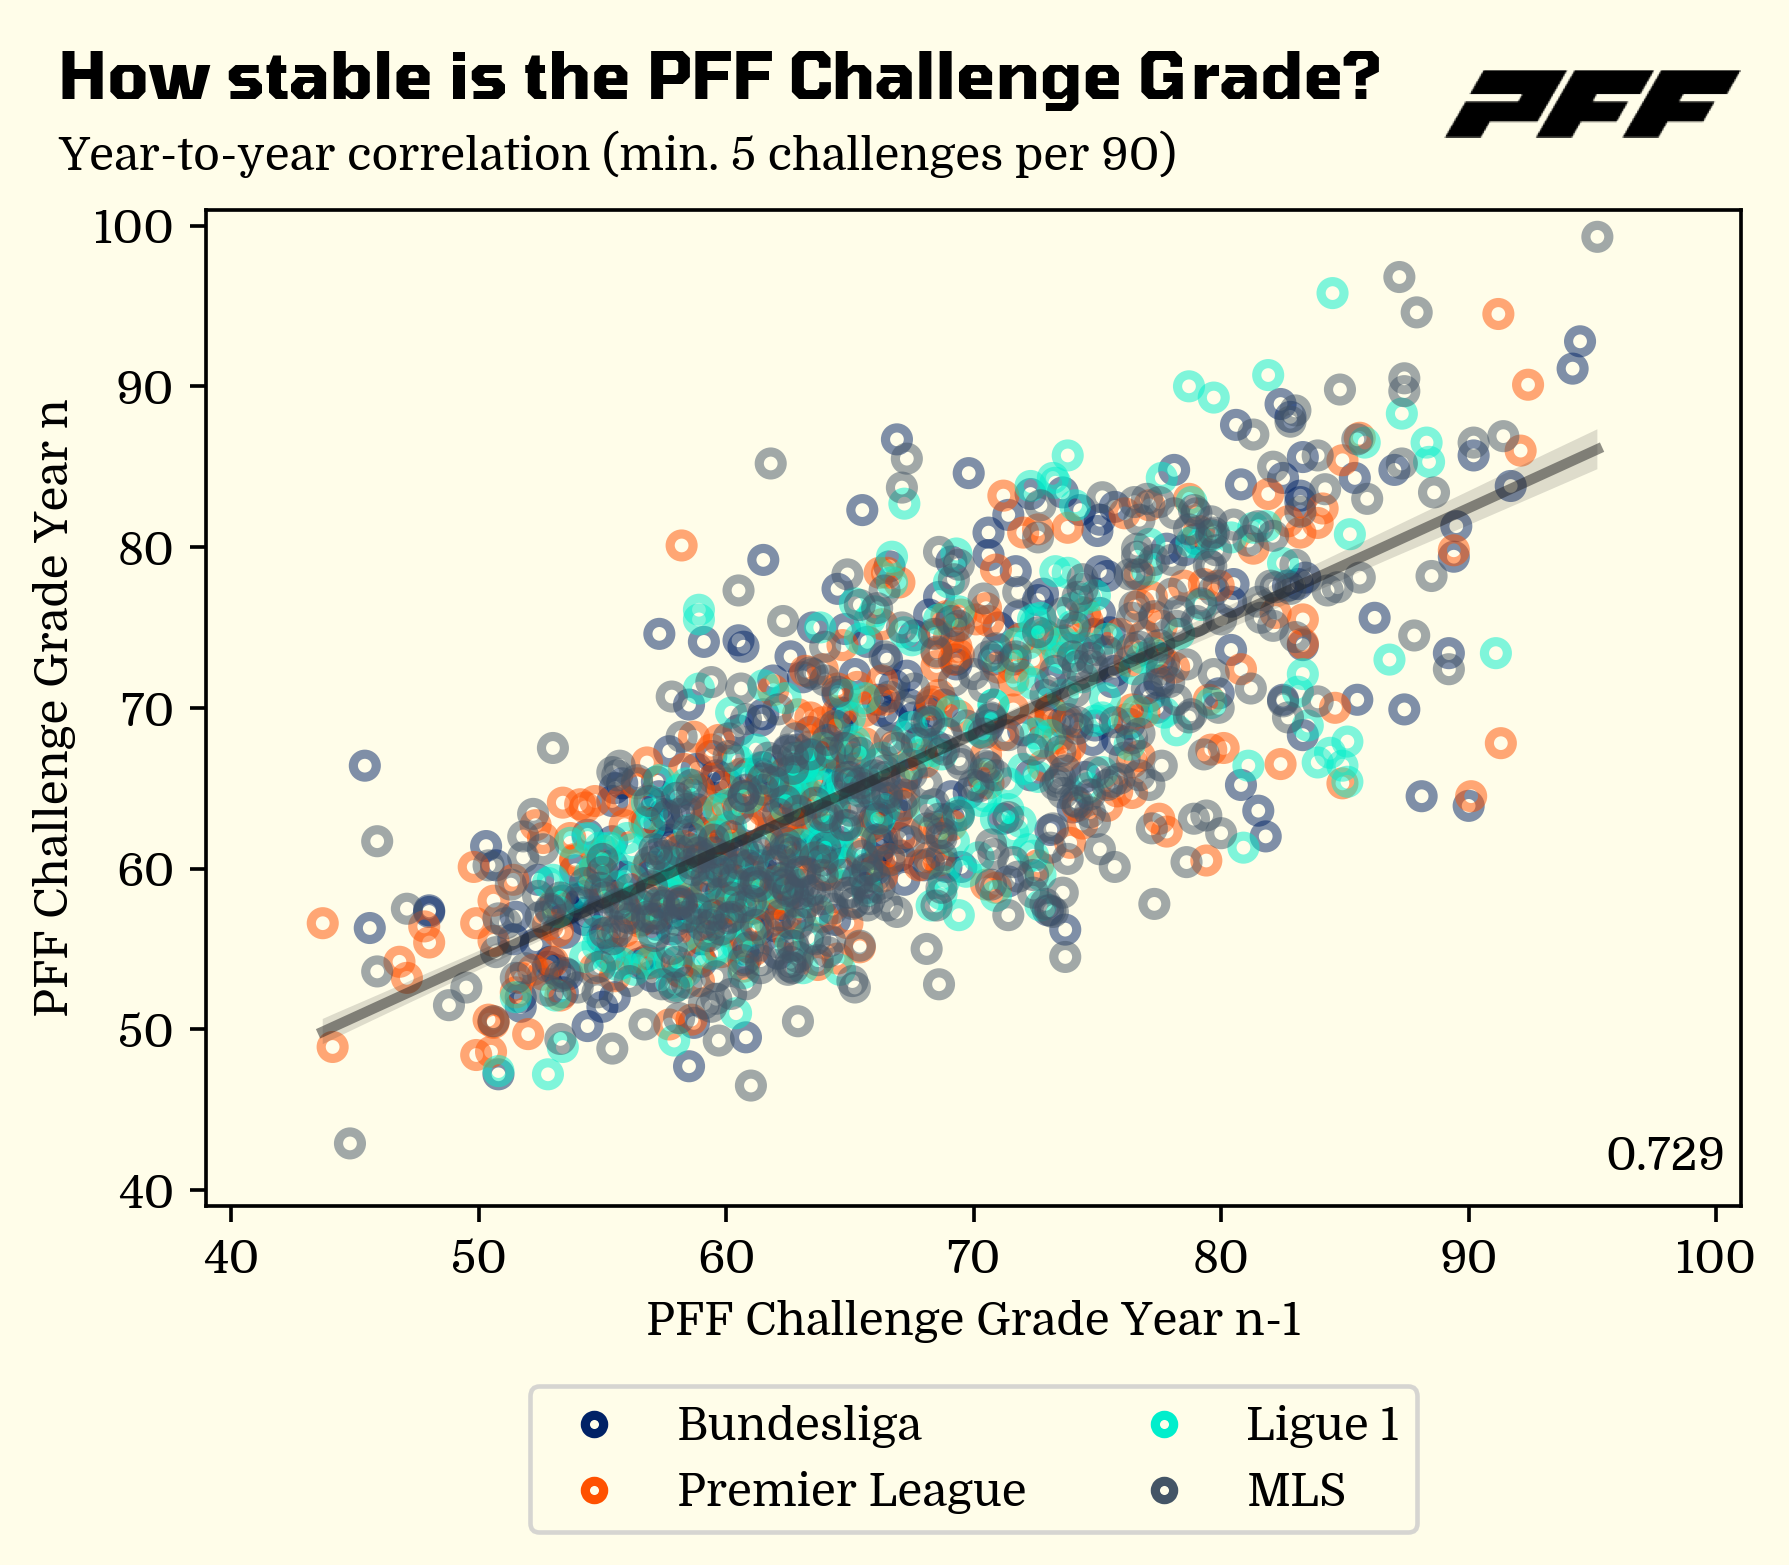
It is important to keep in mind that challenge success rate does not necessarily equal performance, because it only captures which player made contact with the ball first. However, winning the ball and succeeding are two different things. This leads us next to look at the year-to-year correlation of the PFF Challenge Grade in the graph below.
The correlation has jumped to 0.729, suggesting that the PFF Challenge Grade is a more reliable metric for evaluating a player's performance in challenges from one season to the next. This stronger correlation indicates that a player's PFF Challenge Grade from the previous season is a better predictor of their future success in challenges.
By using the PFF Challenge Grade as a metric, coaches and analytics staff can make more informed decisions about which players to recruit or retain based on their actual performance in individual challenges, rather than just the number of challenges or the success rate.
The PFF player grading system evaluates every player for every event during a game. The approach used in this study can be extended to other areas of the game to determine the extent to which past performance can predict future success.
Ultimately, the goal of using data to evaluate player performance is to improve decision-making and team performance, and PFF's grading system is a valuable tool for achieving this objective.
