Mexican culture is widely established in America’s restaurants. Some 11% of restaurants in the United States serve Mexican food, according to a Pew Research Center analysis of data from SafeGraph, which curates information about millions of places of interest around the globe, and the user review site Yelp.
Although especially common in California and Texas, Mexican restaurants are found in a large majority of counties in the U.S. Some 37.2 million people in the U.S. trace their ancestry to Mexico, making Mexican Americans by far the largest Hispanic origin group in the nation.
Pew Research Center conducted this analysis to examine the geographic distribution and characteristics of Mexican restaurants in the United States, including Puerto Rico. We focused on Mexican restaurants because Mexican Americans are the nation’s largest Hispanic origin group – and because Mexican food is so widespread in the U.S. Throughout this analysis, we use phrases such as “Mexican restaurants” and “restaurants that serve Mexican food” interchangeably.
To conduct this analysis, we purchased restaurant data from SafeGraph, which curates information about millions of places of interest around the globe. “Restaurants” are places defined by the North American Industry Classification System (NAICS) as “Restaurants and Other Eating Places” (NAICS code 7225). When we collected this data on March 23, 2023, SafeGraph had records for 788,018 operational restaurants nationwide.
We used SafeGraph’s category tags to build an initial list of Hispanic or Latino restaurants in America. This list includes restaurants tagged with the following categories: Argentine, Brazilian, Cuban, Mexican, Peruvian, Portuguese and Spanish, along with catchall categories for “Caribbean food” and “Latin American food.”
As part of this analysis, we also matched the restaurants in the SafeGraph data with data from the review site Yelp, using the official Yelp API. We matched the Yelp restaurant identifiers (restaurant name and address) to the corresponding restaurants in the SafeGraph dataset using Python’s FastLink package, an implementation of the Fellegi-Sunter probabilistic record linkage model. This matching supplemented the SafeGraph data with more detailed food origin and dish categories, as well as restaurant details such as average price range.
Of the 101,009 restaurants with some sort of Hispanic or Latino food category tag in the SafeGraph data, we were able to find matching entries for 92,718 restaurants (92%) on Yelp. After examining a selection of unmatched restaurants, we found two main reasons why. In some cases, the business did not have any reviews on Yelp (the Yelp API does not return information for businesses with no user-contributed enhancements). In other cases, these restaurants had closed between the time we purchased the SafeGraph data in March 2023 and when we conducted the Yelp matching in September 2023.
After matching the original SafeGraph records with the Yelp data, the final combined dataset included restaurants serving the following types of Hispanic or Latino food: Argentine, Brazilian, Colombian, Cuban, Dominican, Haitian, Honduran, Mexican, Nicaraguan, Peruvian, Portuguese, Puerto Rican, Salvadoran, Spanish, Trinidadian and Venezuelan, as well as categories for “Caribbean food” and “Latin American food.” Our analysis of restaurants other than Mexican is limited due to the small number tagged this way.
The data also included tags for specific types of food such as “Tex-Mex,” “tacos” and “empanadas.” Restaurants with “Tex-Mex” and “tacos” tags are included in the “Mexican food” category, while those tagged with “empanadas” are included in the “Latin American food” category, unless the restaurant is already tagged with a more specific category.
Individual restaurants can be tagged with multiple categories. For instance, a restaurant may include tags for “Mexican food” and “Salvadoran food.” These restaurants are counted under all categories listed in the dataset.
County-level population estimates for the U.S. come from table B01003 of the American Community Survey’s 5-year 2019 estimates, which include counties and county equivalents (such as Fairbanks North Star Borough, Alaska).
Which states and counties have the most Mexican restaurants?
This analysis finds that 85% of U.S. counties have at least one Mexican restaurant. In turn, the counties that don’t have Mexican restaurants tend to have small populations. The 15% of counties without any Mexican restaurants have about 4 million people living in them. That is just 1% of the total U.S. population.
Related: 71% of Asian restaurants in the U.S. serve Chinese, Japanese or Thai food
Mexican restaurants are most common in California and Texas. These two states, which are home to a majority of the Mexican American population, have around 40% of all Mexican restaurants in the country: 22% are in California, while 17% are in Texas.
In California, Los Angeles County alone is home to 30% of the state’s Mexican restaurants. In Texas, 17% of the state’s Mexican restaurants are in Harris County, which includes Houston; 9% each are located in Bexar County, which includes San Antonio, and in Dallas County.
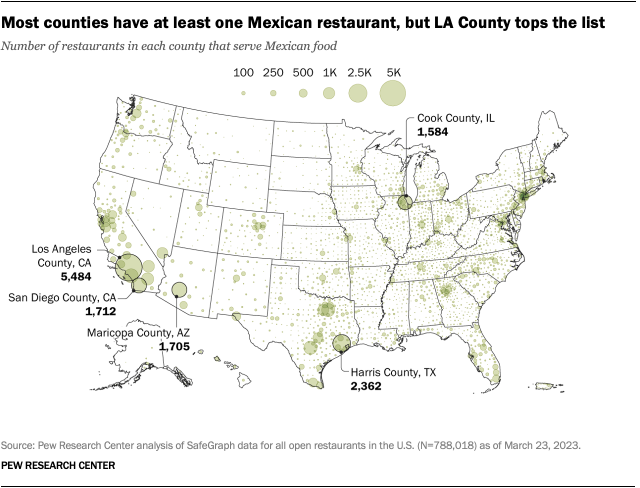
Florida, New York and Illinois also contain large numbers of Mexican restaurants. Each state has 4% of the nationwide total of these restaurants. All told, 51% of all Mexican restaurants in the U.S. are in California, Texas, Florida, New York or Illinois.
Where do Mexican restaurants make up the largest share of eateries?
In addition to examining which parts of the country have the most Mexican restaurants, we also looked at where they make up the largest share of restaurants.
By this metric, Mexican restaurants make up an especially large share of all restaurants in Southwestern states that border Mexico. They account for 22% of all restaurants in New Mexico, 20% in Texas, 18% in Arizona and 17% in California.
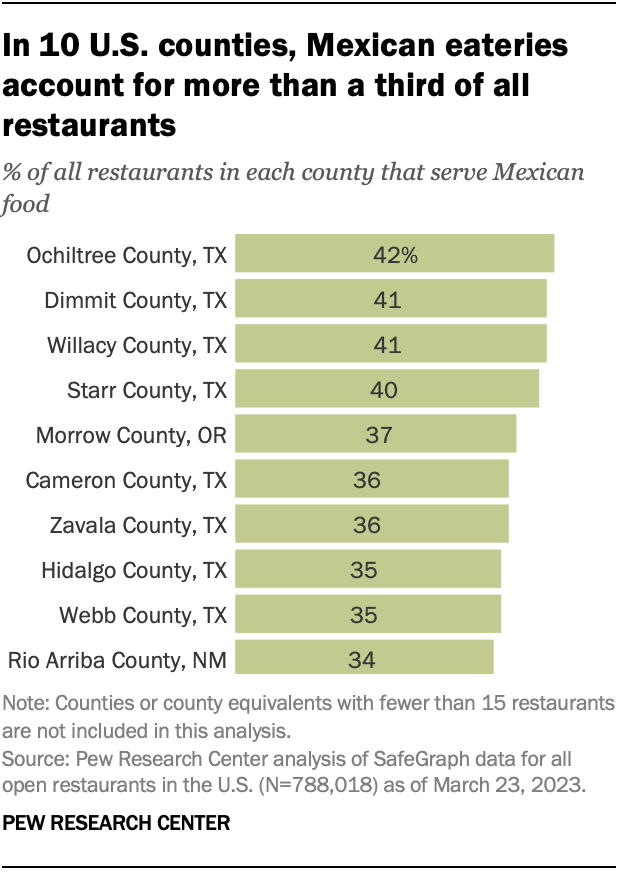
At the county level, there are 10 where Mexican restaurants account for more than 33% of all restaurants. Eight of these 10 counties are in Texas, and most are along the U.S.-Mexico border. (This analysis excludes counties that have fewer than 15 restaurants of any type.)
What are some common features of Mexican restaurants?
This analysis finds that 22% of Mexican restaurants nationwide are “fast food” restaurants, 12% specialize in serving tacos, 8% are classified as food trucks or carts, and 6% offer “Tex-Mex” food.
Mexican restaurants also tend to be modestly priced. Among restaurants with pricing data, 61% of Mexican restaurants are rated as one “dollar sign” on Yelp’s four-point pricing scale. Less than 1% of all Mexican restaurants nationwide – just 251 in total – have a rating of three or four dollar signs on the Yelp scale. Around a quarter of these more expensive Mexican restaurants are in Los Angeles County; Cook County, where Chicago is located; and New York County, home of Manhattan.
How common are other types of Latino or Hispanic restaurants in the U.S.?
Mexican Americans are the largest Hispanic group in the U.S., but 40% of the nation’s Latinos claim another Hispanic origin. Yet our analysis finds that only 2% of U.S. restaurants serve Hispanic or Latino cuisine other than Mexican.
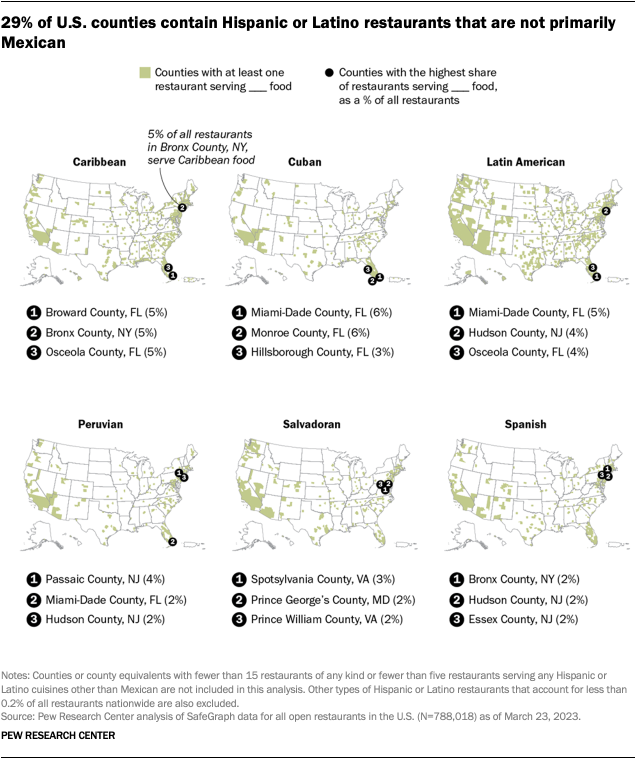
The most common types of non-Mexican Hispanic restaurants include Caribbean, Cuban, “Latin American,” Peruvian, Salvadoran and Spanish restaurants. But none makes up more than 1% of restaurants nationwide. (There are other types of Hispanic restaurants in addition to these, but they each make up 0.1% or less of restaurants nationwide and are not included in this analysis.)
Put differently, Mexican restaurants account for the vast majority of Hispanic or Latino restaurants of any kind. And although many non-Mexican restaurants also offer Mexican food, the reverse is less often true. For example, 38% of Salvadoran and 25% of Honduran restaurants in the U.S. also serve Mexican food. But just 3% of Mexican restaurants also serve other kinds of Hispanic or Latino food.
Hispanic or Latino restaurants that are not Mexican are also much less geographically widespread than Mexican restaurants. Fully 85% of U.S. counties have at least one Mexican restaurant, but 29% have some type of Latino or Hispanic restaurant that is not primarily Mexican.
These Latino or Hispanic restaurants make up a relatively large share of restaurants in places like Florida – especially in and around Miami-Dade County – or in New York and New Jersey near New York City. But even in these areas, Mexican restaurants make up for a comparable – and sometimes larger – share of all restaurants than those serving other Hispanic or Latino food.

