The Run Away! app part 2: Drawing curves with SkiaSharp

This article is the follow-up to https://www.sharpnado.com/run-away-app/.
In the previous article I talked about the challenge of displaying gradient lines on top of Google Maps, on this article I will go through some of the questions and issues I raised previously, and add a nice functionnality to have a better understanding of our .NET Athletes.
Using Xamarin.Forms.Maps instead of Xamarin.Forms.GoogleMaps
In the first post, I used the famous library from amay077 instead of the classic Xamarin.Forms.Maps package.
The reason was that the classic package didn't have CameraChanged events. At the same time I ran into issues initializing consistently the maps on the 3 different platforms. Also, the amay077 package doesn't really support UWP.
So why not add the CameraChanged event to the Xamarin.Forms.Maps package?
I am very excited about this: my first PR to Xamarin.Forms \o/
Of course I ran into some issues trying to have a consistent API between the 3 platforms. The iOS and UWP map component don't have a Zoom property. But you can easily compute it.
I have 2 remaining issues on UWP that prevent the merge for now (plus of course the upcoming review from the XF team).
- something which looks like thread starvation:
The
ActualCameraChangingevent seems to be aggressively invoked and seems to take a lot of UI thread time. I tried numerous tactics without much success... It works but it is a bit laggy in my sharpnado example.
- The zoom computation seems a bit off, close but not on point.
If any UWP MapControl expert is around here :)
Improving performance and rendering
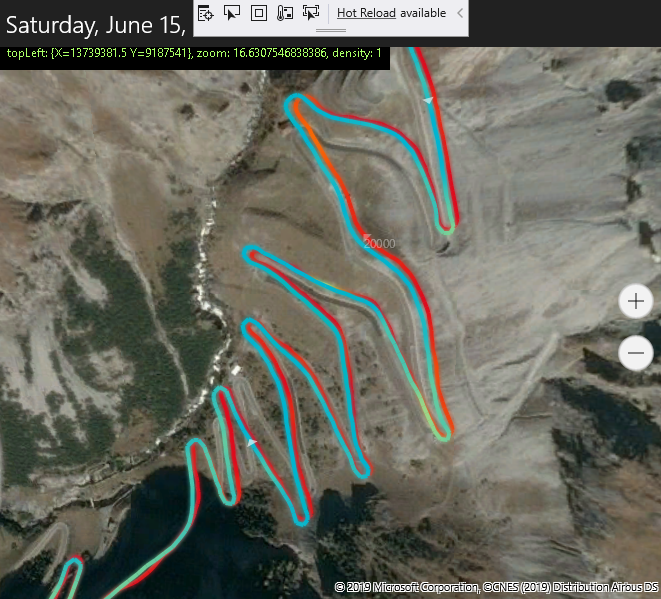
If you remember, I had some lag issues when displaying large data. Per instance Steve's session had 7136 lines to render, which resulted in lags and numerous GC calls when I moved the map around.
Following tests were run on a Pixel 3.
[0:] MapOnPaintSurface: pos: 46,3169664962972, 6,70844044536352
09-09 12:24:32.850 I/harpnado.sampl(20989): Explicit concurrent copying GC freed 6931(480KB) AllocSpace objects, 13(248KB) LOS objects, 49% free, 8395KB/16MB, paused 24us total 15.147ms
09-09 12:24:32.850 D/Mono    (20989): GC_TAR_BRIDGE bridges 195 objects 195 opaque 0 colors 195 colors-bridged 195 colors-visible 195 xref 0 cache-hit 0 cache-semihit 0 cache-miss 0 setup 0.03ms tarjan 0.03ms scc-setup 0.03ms gather-xref 0.00ms xref-setup 0.00ms cleanup 0.03ms
09-09 12:24:32.850 D/Mono    (20989): GC_BRIDGE: Complete, was running for 16.24ms
09-09 12:24:32.850 D/Mono    (20989): GC_MINOR: (Nursery full) time 5.74ms, stw 6.01ms promoted 233K major size: 28352K in use: 25877K los size: 2048K in use: 696K
[0:] MAP: 7136 lines drawn
[0:] END OF => MapOnPaintSurface (00:00:00.2409123)
[0:] MapOnPaintSurface: pos: 46,2632954843037, 6,69294867664576
09-09 12:24:33.154 I/harpnado.sampl(20989): Explicit concurrent copying GC freed 5761(274KB) AllocSpace objects, 18(304KB) LOS objects, 49% free, 8499KB/16MB, paused 25us total 15.569ms
09-09 12:24:33.155 D/Mono    (20989): GC_TAR_BRIDGE bridges 130 objects 130 opaque 0 colors 130 colors-bridged 130 colors-visible 130 xref 0 cache-hit 0 cache-semihit 0 cache-miss 0 setup 0.03ms tarjan 0.02ms scc-setup 0.01ms gather-xref 0.00ms xref-setup 0.00ms cleanup 0.03ms
09-09 12:24:33.155 D/Mono    (20989): GC_BRIDGE: Complete, was running for 16.49ms
09-09 12:24:33.155 D/Mono    (20989): GC_MINOR: (Nursery full) time 6.07ms, stw 6.42ms promoted 225K major size: 28576K in use: 26102K los size: 2048K in use: 696K
[0:] MAP: 7136 lines drawn
[0:] END OF => MapOnPaintSurface (00:00:00.2519872)
[0:] MapOnPaintSurface: pos: 46,0912646390846, 6,63965821266174
09-09 12:24:33.458 I/harpnado.sampl(20989): Explicit concurrent copying GC freed 3671(176KB) AllocSpace objects, 0(0B) LOS objects, 49% free, 8482KB/16MB, paused 25us total 15.138ms
09-09 12:24:33.458 D/Mono    (20989): GC_TAR_BRIDGE bridges 39 objects 39 opaque 0 colors 39 colors-bridged 39 colors-visible 39 xref 0 cache-hit 0 cache-semihit 0 cache-miss 0 setup 0.03ms tarjan 0.01ms scc-setup 0.01ms gather-xref 0.00ms xref-setup 0.00ms cleanup 0.02ms
09-09 12:24:33.458 D/Mono    (20989): GC_BRIDGE: Complete, was running for 15.73ms
09-09 12:24:33.458 D/Mono    (20989): GC_MINOR: (Nursery full) time 5.60ms, stw 5.93ms promoted 213K major size: 28784K in use: 26315K los size: 2048K in use: 806K
[0:] MAP: 7136 lines drawn
[0:] END OF => MapOnPaintSurface (00:00:00.2408342)
[0:] MapOnPaintSurface: pos: 46,1324846481286, 6,64180465042591
09-09 12:24:33.761 I/harpnado.sampl(20989): Explicit concurrent copying GC freed 4599(224KB) AllocSpace objects, 0(0B) LOS objects, 49% free, 8482KB/16MB, paused 27us total 15.138ms
09-09 12:24:33.761 D/Mono    (20989): GC_TAR_BRIDGE bridges 221 objects 221 opaque 0 colors 221 colors-bridged 221 colors-visible 221 xref 0 cache-hit 0 cache-semihit 0 cache-miss 0 setup 0.03ms tarjan 0.04ms scc-setup 0.03ms gather-xref 0.00ms xref-setup 0.00ms cleanup 0.03ms
09-09 12:24:33.761 D/Mono    (20989): GC_BRIDGE: Complete, was running for 16.34ms
09-09 12:24:33.761 D/Mono    (20989): GC_MINOR: (Nursery full) time 5.78ms, stw 6.08ms promoted 236K major size: 29008K in use: 26552K los size: 2048K in use: 806K
[0:] MAP: 7136 lines drawn
[0:] END OF => MapOnPaintSurface (00:00:00.2450493)
[0:] MapOnPaintSurface: pos: 46,2446977759653, 6,6833084821701
[0:] MAP: 7136 lines drawn
[0:] END OF => MapOnPaintSurface (00:00:00.2360280)
We can see an average rendering time of 250 ms, nearly every rendering triggers a GC call...
Optimization
I talked about downsampling, but I went a more naive and yet effective road.
I add a condition to determine whether or not a line should be drawn between 2 points:
bool isDistanceEnough = Math.Abs(pathPoint.X - previousPoint.X) > SkiaHelper.ToPixel(4)
                     || Math.Abs(pathPoint.Y - previousPoint.Y) > SkiaHelper.ToPixel(4);
So if the line is more than 4 independent pixels on the X or Y axis, the line is drawn, if not, we just discard the current point.
Doing the same test with this little optimization:
[0:] MapOnPaintSurface: pos: 46,2098011118348, 6,71078503131866
[0:] MAP: 182 lines drawn
[0:] END OF => MapOnPaintSurface (00:00:00.0259747)
[0:] MapOnPaintSurface: pos: 46,2036817686071, 6,71021170914173
[0:] MAP: 182 lines drawn
[0:] END OF => MapOnPaintSurface (00:00:00.0266567)
[0:] MapOnPaintSurface: pos: 46,2017539171176, 6,70723143965006
[0:] MAP: 182 lines drawn
[0:] END OF => MapOnPaintSurface (00:00:00.0259888)
[0:] MapOnPaintSurface: pos: 46,2004015033122, 6,70161958783865
[0:] MAP: 182 lines drawn
[0:] END OF => MapOnPaintSurface (00:00:00.0263178)
[0:] MapOnPaintSurface: pos: 46,1972289551882, 6,68723691254854
[0:] MAP: 182 lines drawn
[0:] END OF => MapOnPaintSurface (00:00:00.0251176)
[0:] MapOnPaintSurface: pos: 46,195690304337, 6,67871419340372
[0:] MAP: 182 lines drawn
[0:] END OF => MapOnPaintSurface (00:00:00.0254509)
[0:] MapOnPaintSurface: pos: 46,1946700831266, 6,67306814342737
09-09 12:02:20.021 I/harpnado.sampl(13781): Explicit concurrent copying GC freed 14966(495KB) AllocSpace objects, 0(0B) LOS objects, 49% free, 11MB/22MB, paused 22us total 16.088ms
09-09 12:02:20.022 D/Mono    (13781): GC_TAR_BRIDGE bridges 273 objects 273 opaque 0 colors 273 colors-bridged 273 colors-visible 273 xref 0 cache-hit 0 cache-semihit 0 cache-miss 0 setup 0.03ms tarjan 0.05ms scc-setup 0.03ms gather-xref 0.00ms xref-setup 0.00ms cleanup 0.07ms
09-09 12:02:20.022 D/Mono    (13781): GC_BRIDGE: Complete, was running for 17.68ms
09-09 12:02:20.022 D/Mono    (13781): GC_MINOR: (Nursery full) time 2.87ms, stw 3.10ms promoted 87K major size: 39040K in use: 36387K los size: 4096K in use: 2475K
[0:] MAP: 182 lines drawn
[0:] END OF => MapOnPaintSurface (00:00:00.0466124)
182 lines drawn instead of 7k, about 25 ms rendering time (divided by 10!), and only one GC every 5 rendering \o/
New feature: drawing curves with SkiaSharp
So now we have smooth and nice gradient lines on top of our maps components.
But what valuable information does it give us?
We have a nice summary of our sessions, average values, sure... But what about some details?
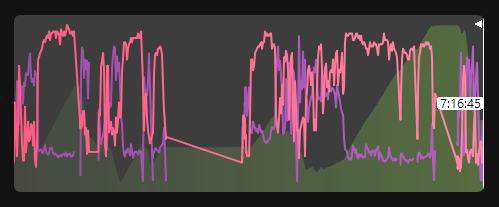
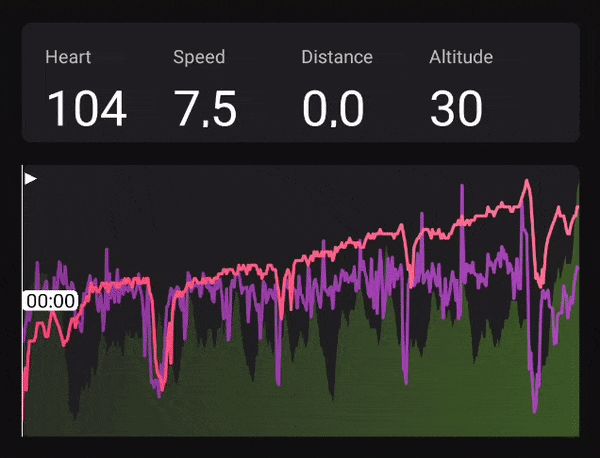
For this we will draw graph of useful values such as:
- Heart rate (pink)
- Speed (purple)
- Altitude (commodore 64 green gradient)
Altitude is here really interesting cause there is a correlation between elevation and heartrate.
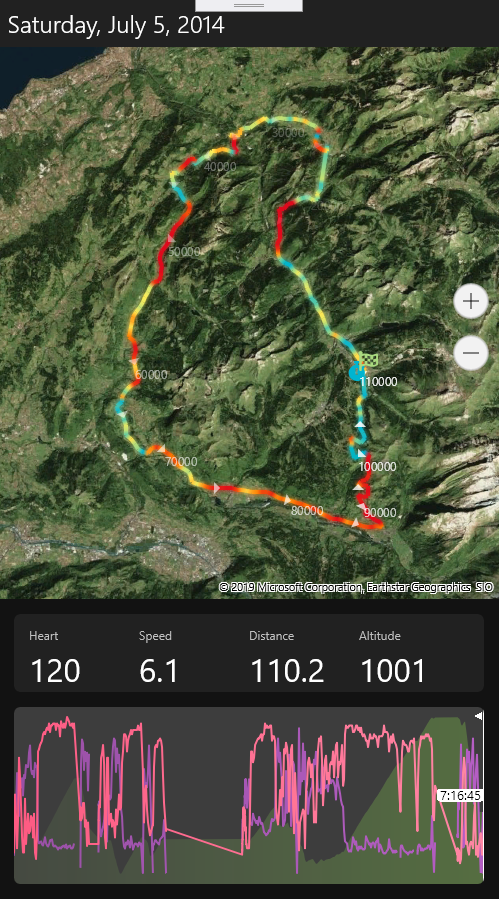
We can see that steven's heart rate was constantly high while climbing the Joux-Plane pass. It's nice, we have now some kind of "performance profile" for a session.
But wouldn't it be nice to analyze more closely some of the session parts?
Remember this mysterious MaxTime property of our SessionMap ?
Well it turns out that this property limits the displayed points on the map. We can choose to only display the first 10 minutes of the training session per instance. Another thing interesting about this property is that it is a BindableProperty. Each time it is changed, the skia canvas will be invalidated.
But what does it have to do with our new skia curves?
Drawing curves with SkiaSharp
I created a SessionGraphView which is just a SKCanvasView with a touchable overlay:
<ContentView.Content>
    <Grid>
        <forms:SKCanvasView x:Name="Graph"
                            PaintSurface="GraphOnPaintSurface" />
        <Grid.Effects>
            <forms1:TouchEffect Capture="True"
                                TouchAction="OnTouchEffectAction" />
        </Grid.Effects>
    </Grid>
</ContentView.Content>
The touch effect comes from a well known Xamarin.Forms documentation on effects: https://docs.microsoft.com/en-US/xamarin/xamarin-forms/app-fundamentals/effects/touch-tracking.
Luckily someone made it a nuget package: https://www.nuget.org/packages/TouchTracking.Forms/
This will give us touch action like dragging.
I have two BindableProperty:
SessionGraphInfoProperty: gives all the info needed for displaying our curvesCurrentCursorTimeProperty: is current selected time
Now let's have a look to the GraphOnPaintSurface method:
private void GraphOnPaintSurface(object sender, SKPaintSurfaceEventArgs e)
{
    SKSurface surface = e.Surface;
    SKCanvas surfaceCanvas = surface.Canvas;

    var sessionGraphInfo = SessionGraphInfo;

    if (sessionGraphInfo == null)
    {
        return;
    }

    InitializeGraphResourcesIfNeeded();

    if (_curvesPicture == null)
    {
        var pictureRecorder = new SKPictureRecorder();
        var canvas = pictureRecorder.BeginRecording(e.Info.Rect);

        DrawSurface(
            canvas,
            sessionGraphInfo.SessionPoints,
            sessionGraphInfo.Altitude,
            AltitudeSurface,
            sessionPoint => sessionPoint.Altitude);

        DrawCurve(
            canvas,
            sessionGraphInfo.SessionPoints,
            sessionGraphInfo.Speed,
            SpeedColor,
            sessionPoint => sessionPoint.Speed);

        DrawCurve(
            canvas,
            sessionGraphInfo.SessionPoints,
            sessionGraphInfo.HeartRate,
            BpmColor,
            sessionPoint => sessionPoint.HeartRate);

        _curvesPicture = pictureRecorder.EndRecording();
        pictureRecorder.Dispose();
    }

    surfaceCanvas.Clear();
    surfaceCanvas.DrawPicture(_curvesPicture);

    int cursorX = TimeToPixels(CurrentCursorTime);
    surfaceCanvas.DrawRect(new SKRect(0, 0, cursorX, Graph.CanvasSize.Height), _overlayPaint);
    surfaceCanvas.DrawLine(cursorX, 0, cursorX, Graph.CanvasSize.Height, _cursorPaint);

    DrawArrows(surfaceCanvas, _cursorPaint, cursorX);
    DrawTime(surfaceCanvas, cursorX);

    ReleaseGraphResources();
}
I first display my altitude surface, then the speed curve, then the heart rate. After that, I create a transparent overlay with the time cursor.
I won't go into details cause it's really just some straightforward pixel computation.
You just have to know that I am using some simple interpolation to get X pixel value from CurrentCursorTime, and Y pixel value from the max and min (ValueBounds type) of the wanted value (see the GetY function).
Now the interesting part is that the time cursor can be dragged around thanks to the TouchEffect:
private void OnTouchEffectAction(object sender, TouchActionEventArgs args)
{
    if (args.Type == TouchActionType.Moved && SessionGraphInfo != null)
    {
        float positionX = SkiaHelper.ToPixel(args.Location.X);

        CurrentCursorTime = TimeSpan.FromSeconds(
            ComputationHelper.Clamp(
                SessionGraphInfo.TotalDurationInSeconds * positionX / Graph.CanvasSize.Width,
                0,
                SessionGraphInfo.TotalDurationInSeconds));

        Graph.InvalidateSurface();
    }
}
Which gives this:
Composing
The indicators above the curves are not in the same views. I really love modularity and composition, so I try to make all my components pluggable between each others. The plug point is the CurrentCursorTime property. And the indicators are brought by the ActivityPageViewModel:
public class ActivityPageViewModel : ViewModelBase
{
    private readonly ITcxActivityService _activityService;

    private TimeSpan _currentTime;
    private string _currentHeartRate;
    private string _currentSpeed;
    private string _currentAltitude;
    private string _currentDistance;

    public ActivityPageViewModel(INavigationService navigationService, ITcxActivityService activityService)
        : base(navigationService)
    {
        _activityService = activityService;

        Loader = new ViewModelLoader<SessionMapInfo>(emptyStateMessage: AppResources.EmptyActivityMessage);
    }

    public SessionGraphInfo GraphInfo { get; private set; }

    ...

    public TimeSpan CurrentTime
    {
        get => _currentTime;
        set
        {
            SetProperty(ref _currentTime, value);
            OnCurrentTimeChanged();
        }
    }

    public string CurrentHeartRate
    {
        get => _currentHeartRate;
        set => SetProperty(ref _currentHeartRate, value);
    }

    public string CurrentSpeed
    {
        get => _currentSpeed;
        set => SetProperty(ref _currentSpeed, value);
    }

    public string CurrentAltitude
    {
        get => _currentAltitude;
        set => SetProperty(ref _currentAltitude, value);
    }

    public string CurrentDistance
    {
        get => _currentDistance;
        set => SetProperty(ref _currentDistance, value);
    }

    ...

    private void OnCurrentTimeChanged()
    {
        if (GraphInfo == null)
        {
            return;
        }

        var currentPoint = GraphInfo.SessionPoints.First(p => p.Time >= CurrentTime);

        CurrentHeartRate = currentPoint.HeartRate?.ToString() ?? AppResources.NoValue;
        CurrentSpeed = currentPoint.Speed?.ToString("0.0") ?? AppResources.NoValue;
        CurrentAltitude = currentPoint.Altitude?.ToString() ?? AppResources.NoValue;
        CurrentDistance = currentPoint.Distance != null
            ? (currentPoint.Distance.Value / 1000f).ToString("0.0")
            : AppResources.NoValue;
    }

    ...
}
In the ActivityPage:
<graph:SessionGraphView x:Name="GraphView"
                        CurrentCursorTime="{Binding CurrentTime, Mode=OneWayToSource}"
                        SessionGraphInfo="{Binding GraphInfo}"/>
Now, I think you saw it coming, we can plug our SessionGraphView to our SessionMap:
<map:SessionMap x:Name="SessionMap"
                PathThickness="4"
                SessionMapInfo="{Binding Loader.Result}"
                MaxTime="{Binding Source={x:Reference GraphView}, Path=CurrentCursorTime, Mode=TwoWay}"/>
Curves showcase
For this, we welcome two new .Net VIPs:
- Bart Lannoeye (@bartlannoeye)
- Dominique Louis (@SoftSavage)
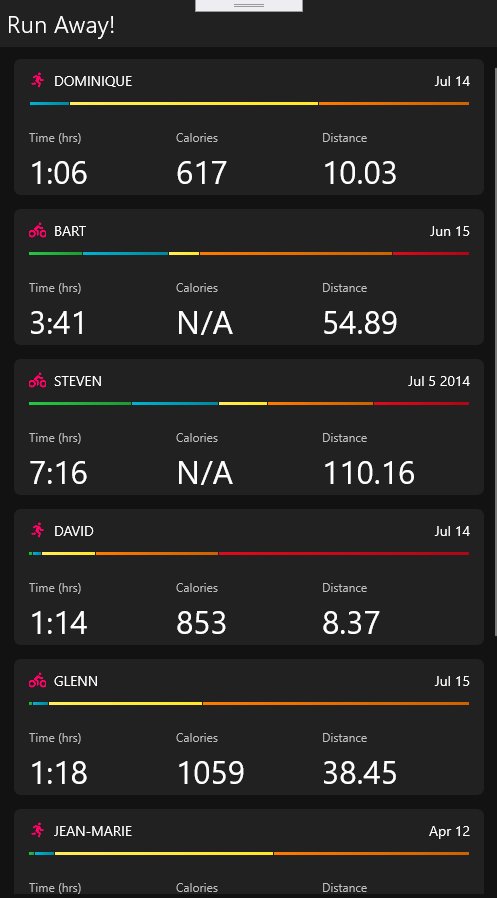
Bart Stelvio pass
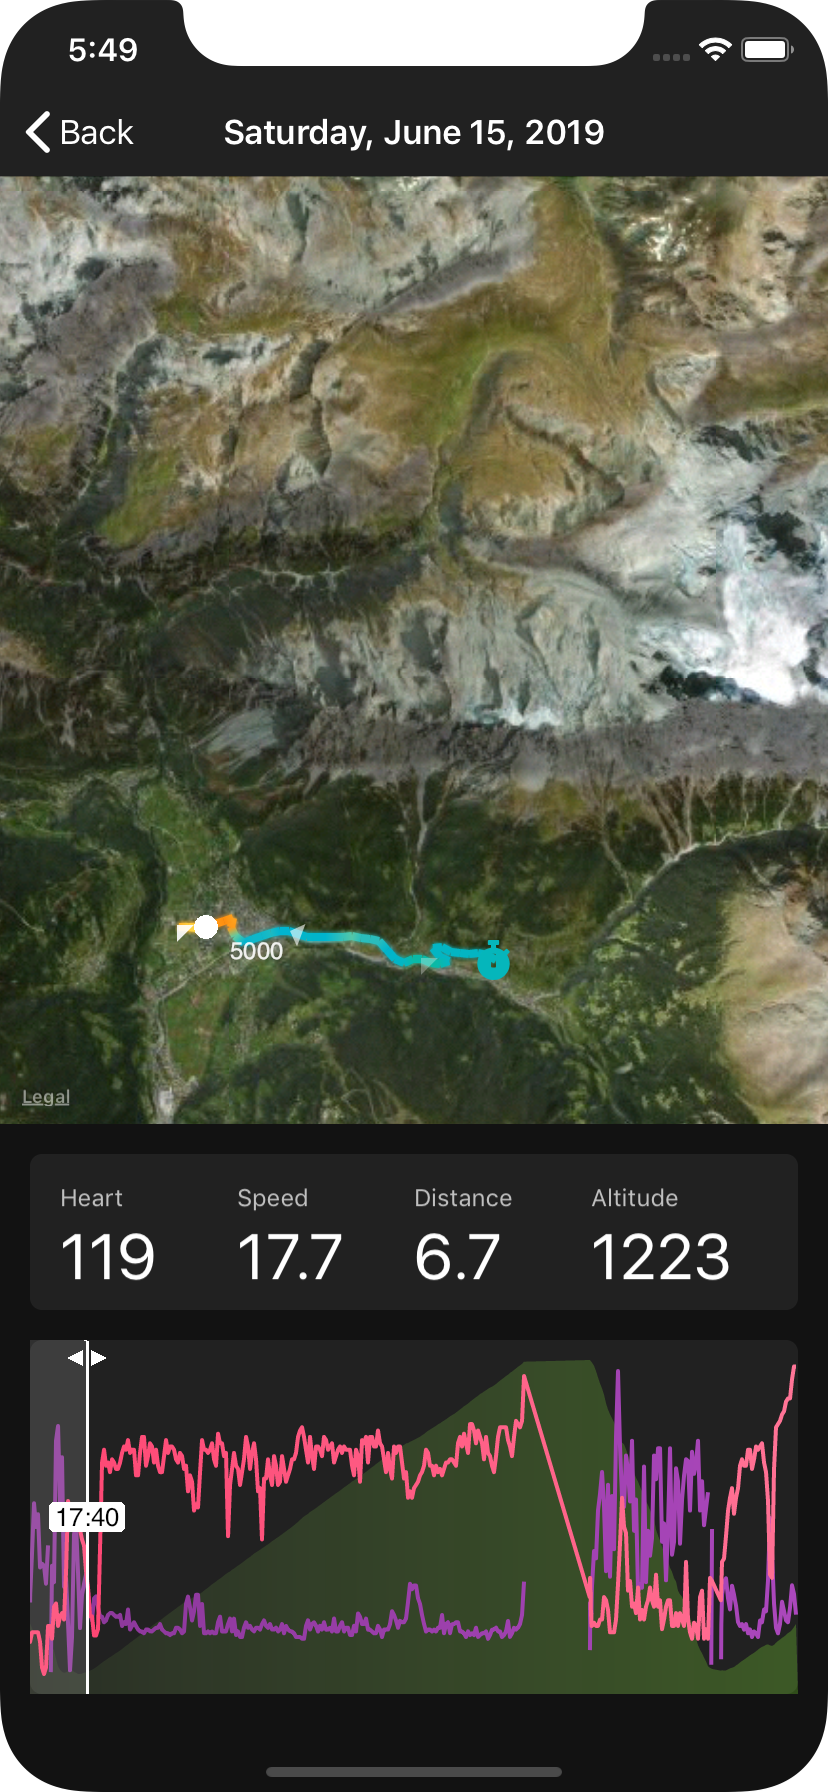
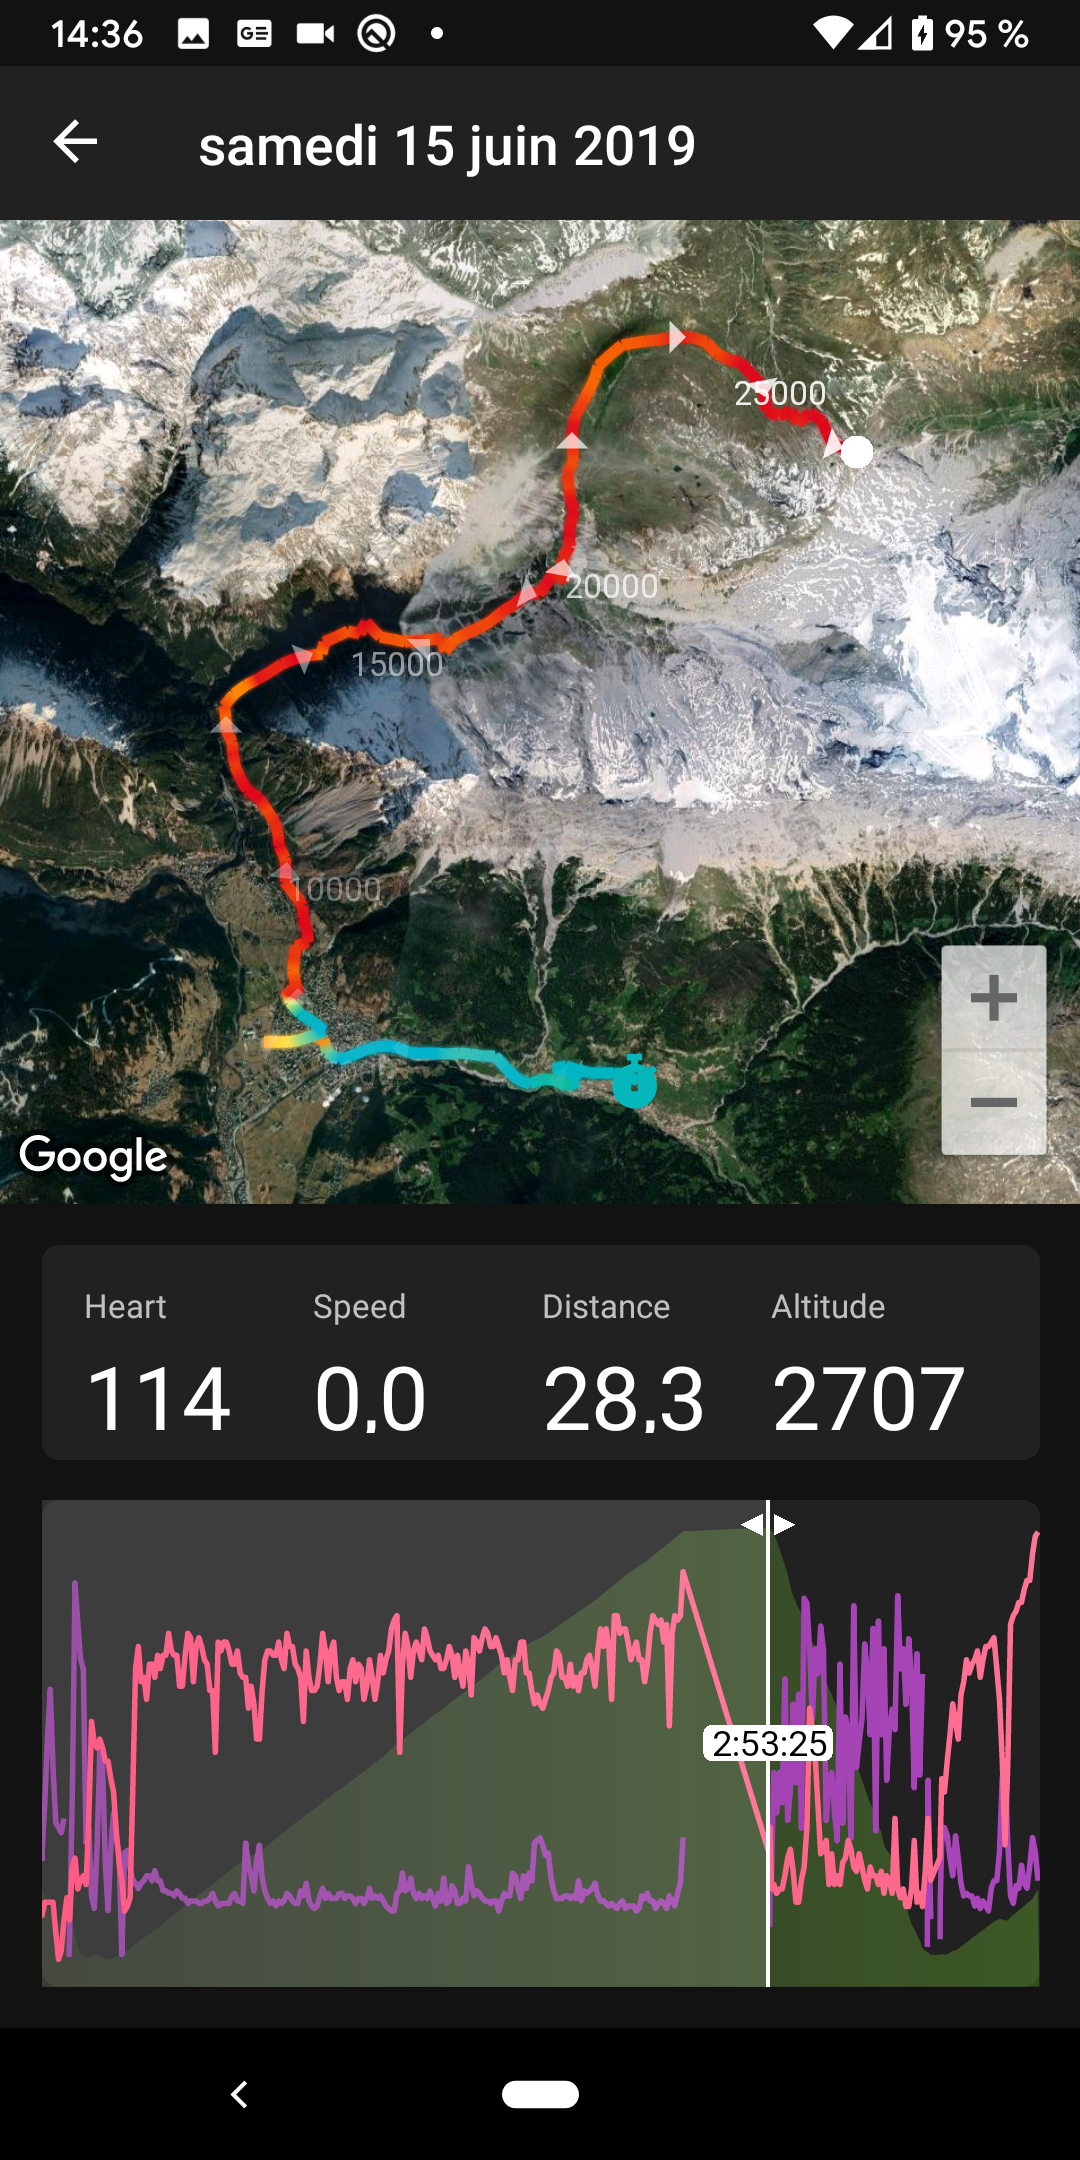
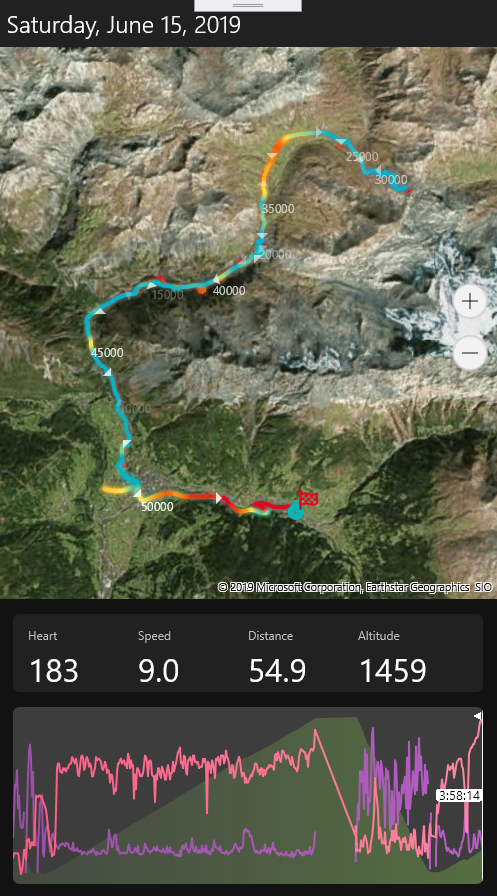
With Bart tcx data, we continue our journey through the european famous pass. Today il "Passo dello Stelvio":
- Famous "Giro" pass
- The second highest paved mountain in the Alps
- 2 757 meters (9 045 ft)
This data is great to see the correlation between the heart rate and the elevation. We can see a constant effort around (160bpm) from the start of the pass to the end of it. Then the bpm collapses during the descent (and after a little well deserved spritz stop). Then climbs again and reaches the max rate of the session (183) for the final sprint.
| Ascent start | End of pass | Final sprint |
|---|---|---|
 |
 |
 |
Dominique London run
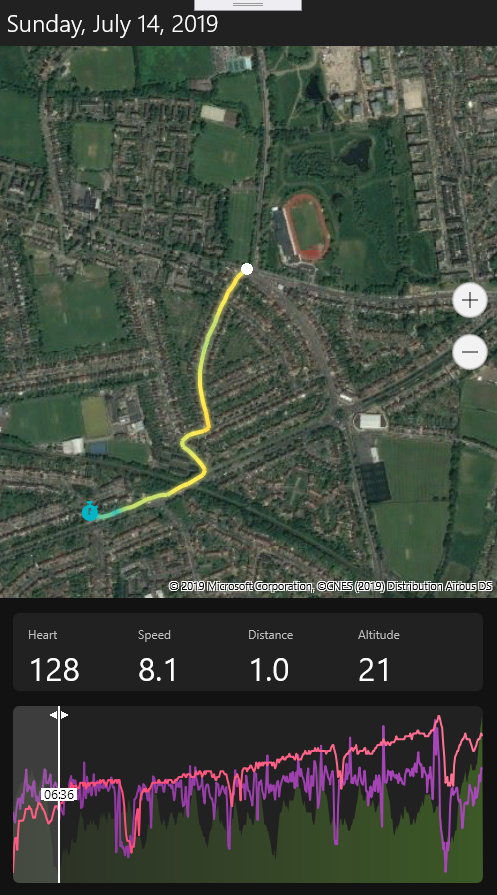
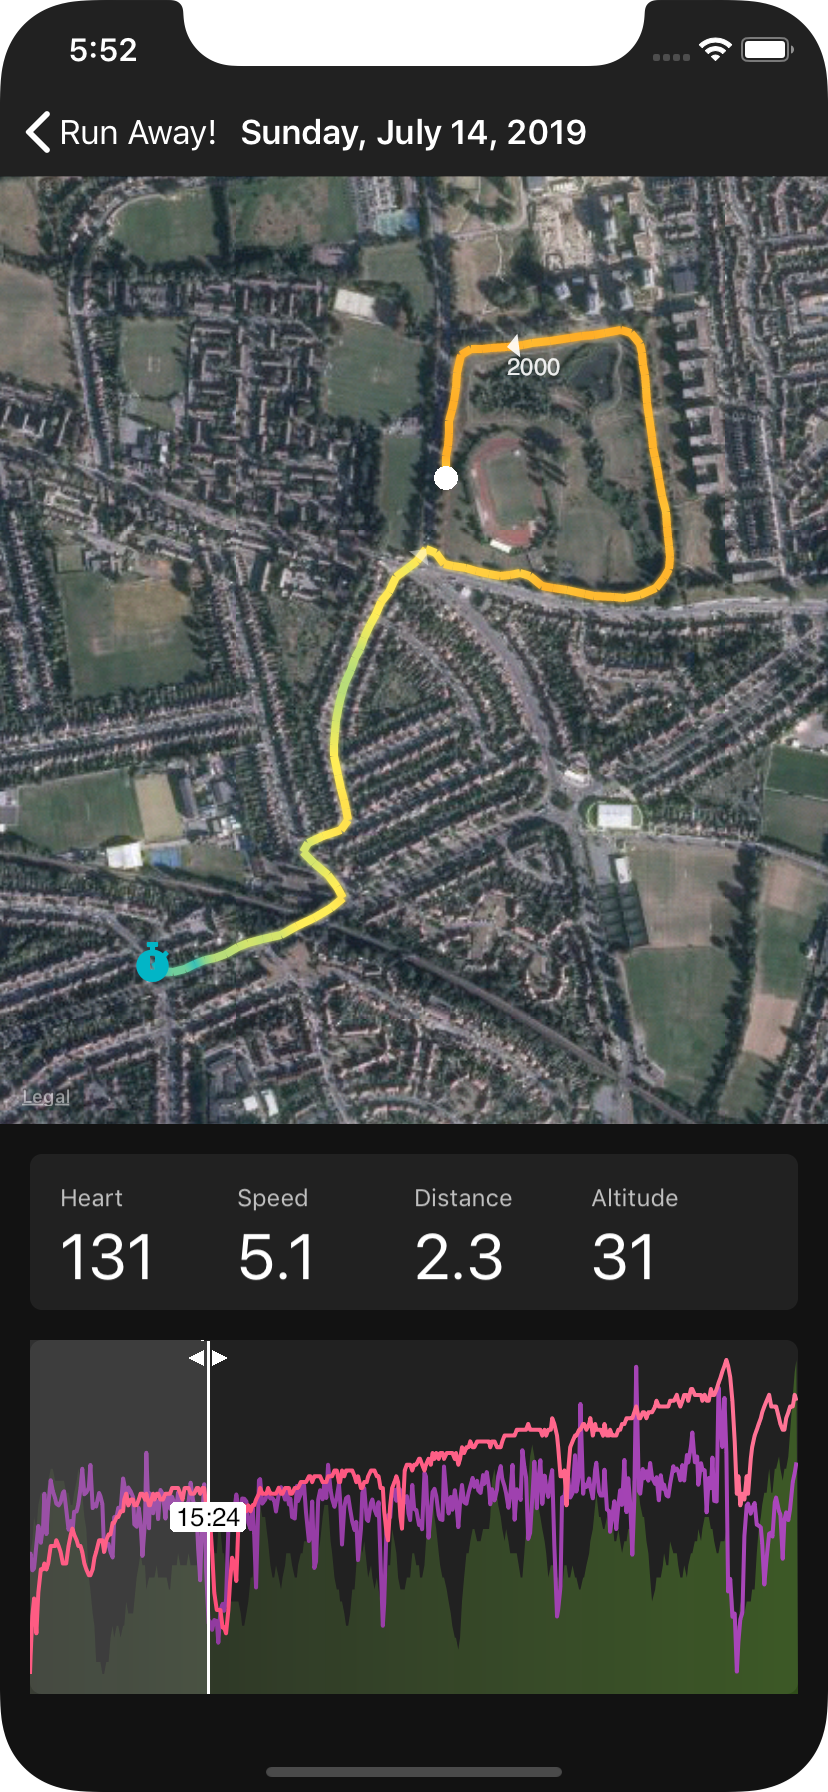
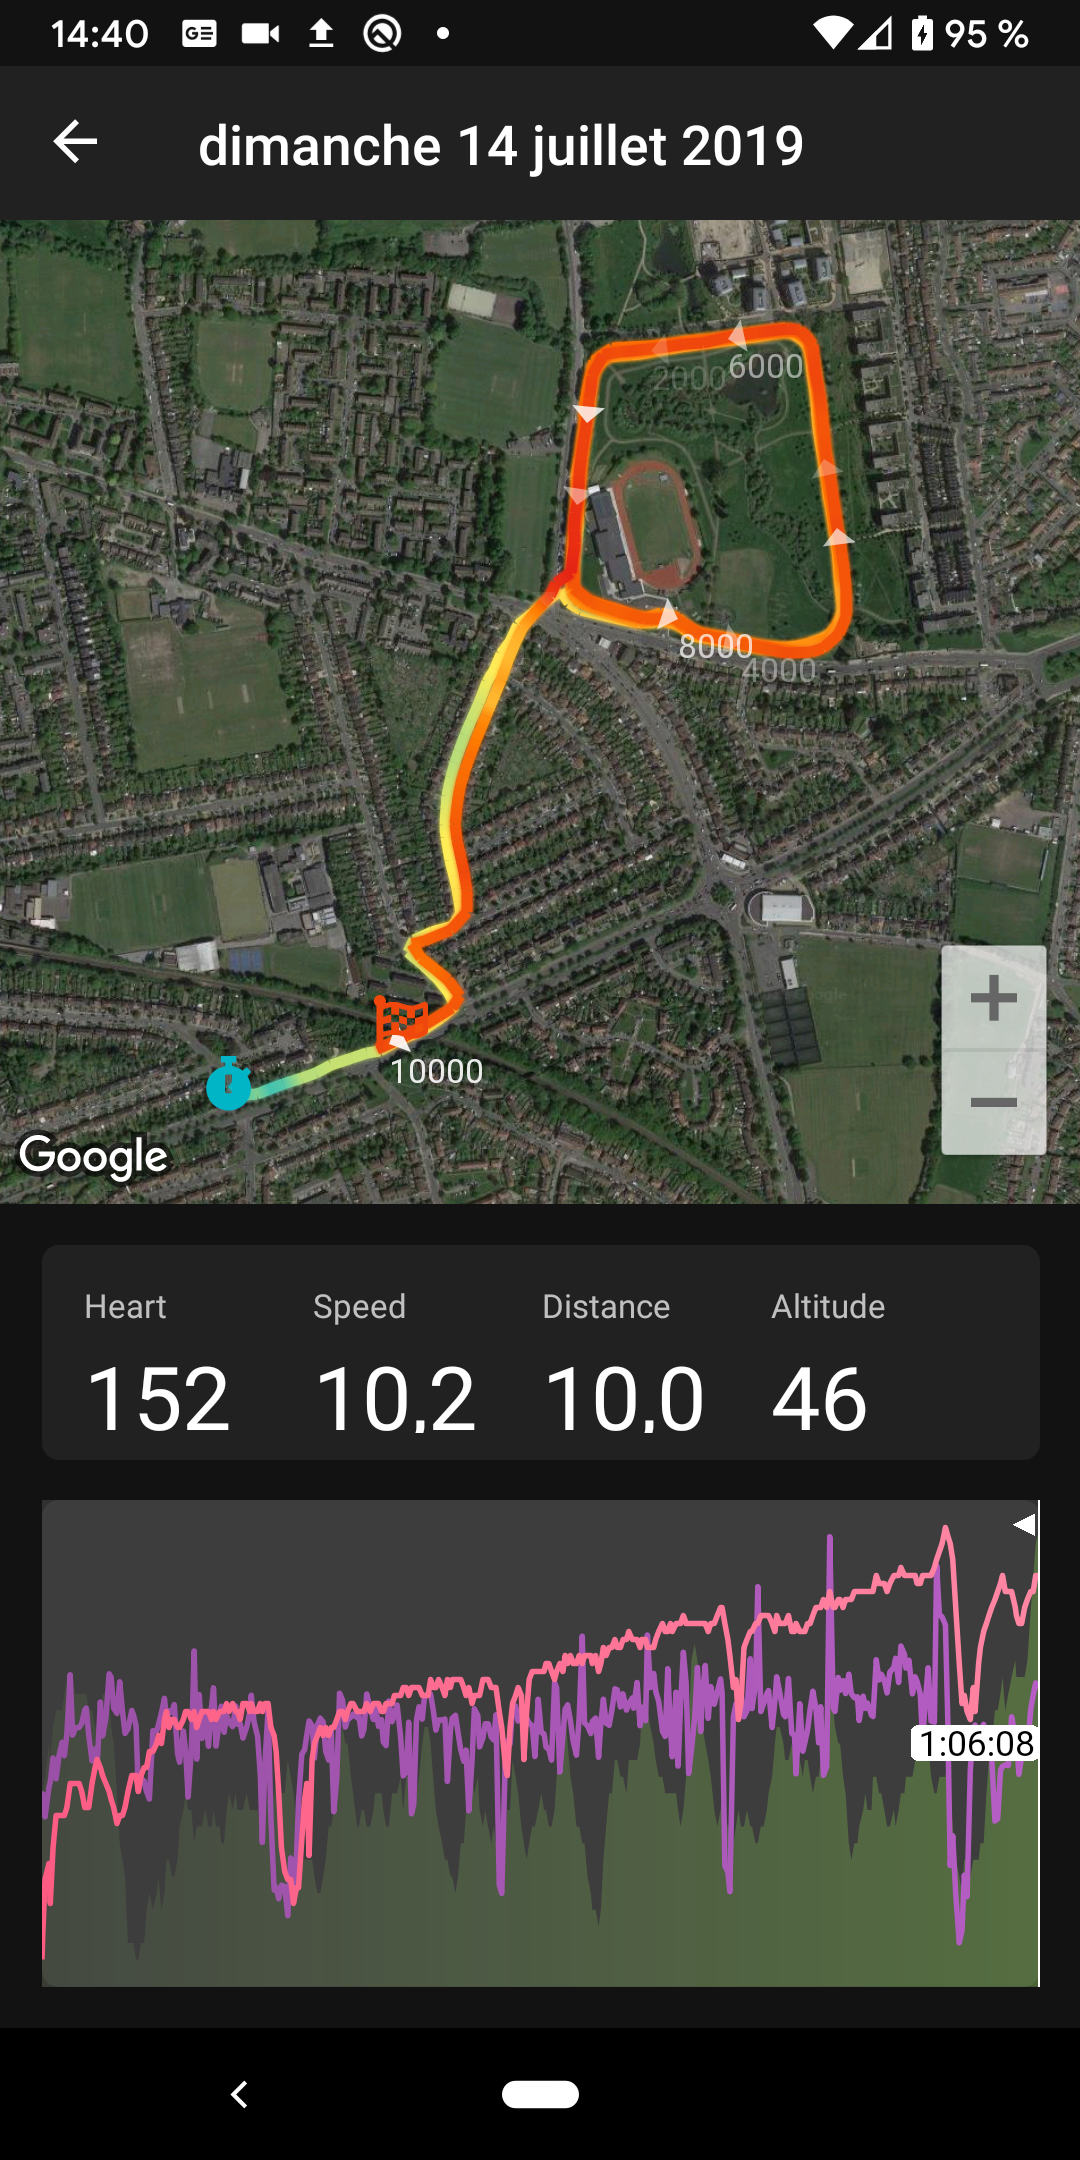
Some classic day to day training for Dominique here: 6 laps of the Sutcliffe Park for a perfect 10 km run.
Data shows a real mastery of heart rate since it is constantly climbing till reaching its peak at 158 bpm after exactly 1 hour of training. It took 7 minutes to reach the park. We notice a collapse of the BPM and speed at minute 15, and some other minor changes at minute 30, and 45, indicating maybe fractionnal exercise.
| Park | First slow down | End |
|---|---|---|
 |
 |
 |
Small SkiaSharp optimization and thanks
You may have noticed this in the GraphOnPaintSurface code:
if (_curvesPicture == null)
{
    var pictureRecorder = new SKPictureRecorder();
    var canvas = pictureRecorder.BeginRecording(e.Info.Rect);

    ...

    _curvesPicture = pictureRecorder.EndRecording();
    pictureRecorder.Dispose();
}

surfaceCanvas.Clear();
surfaceCanvas.DrawPicture(_curvesPicture);
In our case, the curves never change: only the overlay and cursor above move. So we can use a really cool feature of SkiaSharp: picture recorder.
Using a SKPictureRecorder, you can draw in a picture canvas, creating a kind of cache for your skia objects (store here in _curvesPicture). This improves performance dramatically since the most cpu consuming code is executed only once!
You can find all the code above in my github repo: https://github.com/roubachof/SkiaSharpnado
Thanks again to all the .NET athletes which helped me to show the unlimited powers of SkiaSharp and Xamarin.Forms:
- David Ortinau
- Glenn Versweyveld
- Steven Thewissen
- Bart Lannoeye
- Dominique Louis
Special thanks go to Sharpnado's product owner for its continuous support and dedication during the Sharpnado's summer camp: