While traditional, "closed system" models might seem familiar, they miss the unpredictable nature of real user arrivals. This article highlights how open system models, which mimic real-world user behavior, expose performance bottlenecks at high load that closed models can't catch. Remember, arrival rates, not virtual user counts, are the key to unlocking accurate load testing results.
Load testing is a part of the quality assurance process designed to help predict how a computer system will perform in production or to help predict the performance effects of proposed changes.
This entails subjecting the system under test to a synthetic and predictable load, and then measuring its performance. This load should be a reasonable facsimile of the work that the system will encounter in production. Almost always, the load is generated by an automated test script intended to simulate a group of people performing one or more specific tasks.
When performing a load test we present those tasks to the system on a schedule. Characterizing and implementing that schedule is the focus of this article.
Many load test tools are based on a “closed system model”. One mental model of such a system is a factory, where a fixed number of workers start work when the whistle blows. The arrivals are synchronized by some external event and are limited by the number of users.
Another mental model is the “open system model”, where each user decides independently when to start a task. This kind of schedule is by far the most common arrival distribution we see in real systems and can be modeled statistically by what is termed a “Poisson arrival process”. The beauty of a Poisson open system model is that it produces a simple number that is easy to measure and that relates clearly to business goals. This number is the arrival rate: the average number of arrivals per unit time.
The irregularity of arrival times has an important effect on system performance. In order to illustrate this, I will present a series of simulated load tests showing side-by-side comparisons of tests based on open system models and on closed system models. These are simulations of a single service request (for example, a single web page load), with the service times being drawn from a random distribution. I’ll show the very different effects of increasing load under the two models.
For the open system model tests, I’ll use a schedule created by drawing the required number of arrival times from a uniform random number generator, so that each instant in the timeline is equally likely to be chosen. This is simple to implement, guarantees a predictable number of arrivals during the test, and is a good approximation of a Poisson process. I’ll label these simulations “Arrival Rate”.
For the closed system model tests, I’ll use a fixed number of virtual users, with each user performing the task repeatedly until the test ends. I’ll adjust the number of virtual users to get roughly the same number of tasks as in the paired open model test. I’ll label these simulations “VU” (Virtual User).
Each simulation result will be presented in a figure containing a pair of graphs. In the main graph, the horizontal axis is the time of the simulation in seconds, while the left vertical axis (in blue) is the observed concurrency (the number of tasks active in the system at any point in time). The right vertical axis is the time consumed for each task, including wait time and active service time, with a mark (in red) for each completed job.
The smaller graph in each figure is the distribution of the task time for all tasks, with the width of the blob proportional to the number of tasks taking that amount of time. I add lines at the minimum, mean, and (in black) the 95th percentile of the task times. I emphasize the 95th percentile as it is the most common and useful summary number for performance measurements.
I’ll show that the difference between models is minimal when our simulated load level is below the capacity of the tested system, but can become enormous as we approach and exceed the system capacity. A closed-model VU test can miss a disastrous system overload that an open-model test will accurately predict.
Light Load
When the simulated load is comfortably below the system capacity, there is not much difference in the predicted task times.
Figure 1
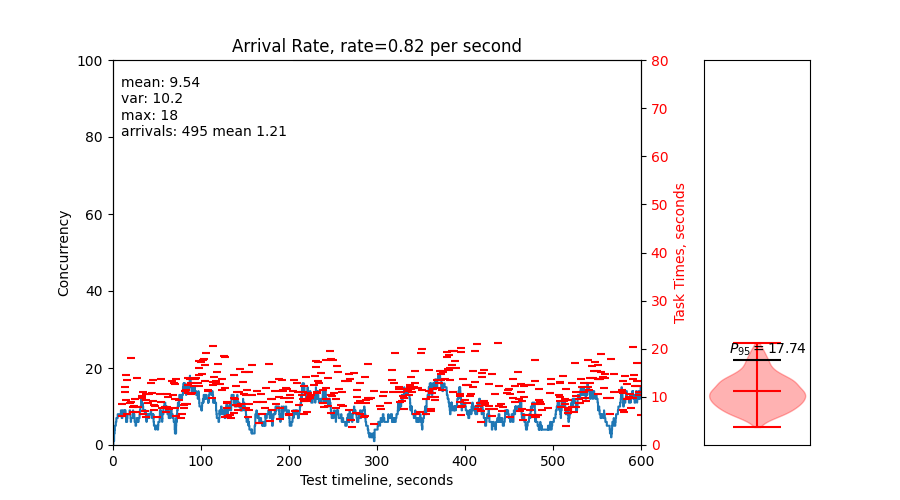
Figure 2
There is noticeably more variance in the concurrency (the number of tasks in the system at any instant), and this causes a slight increase in task times. In the arrival rate test, there are times when the concurrency is greater than the system capacity, causing a momentary slow-down; this does not occur in the VU-based test, as the concurrency is capped by the number of VUs.
Full Load
When the system is working at full capacity, we see that the choice of system model has a strong effect on the load test results.
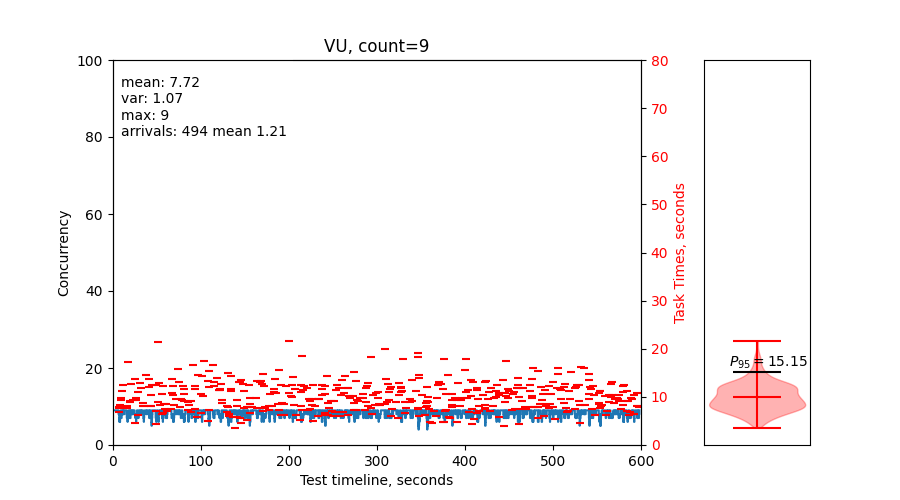
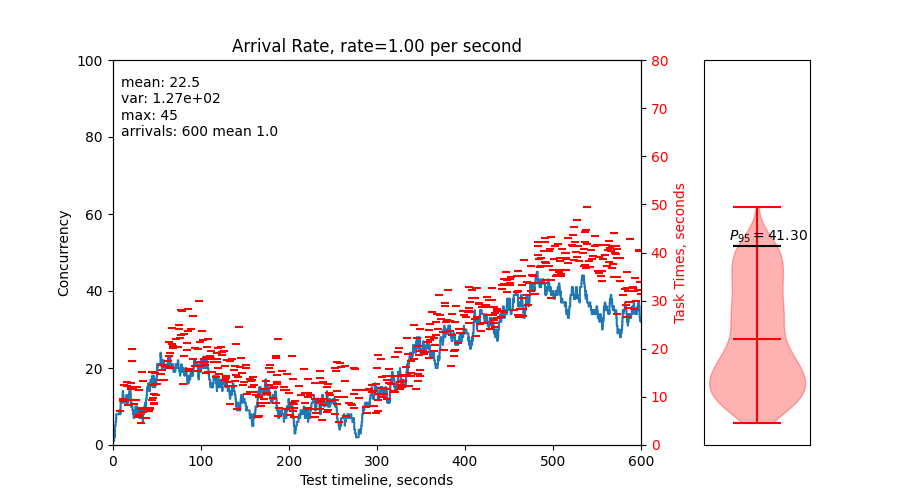
Figure 3
Figure 4
At (or near) capacity, the tested server has trouble with random peaks in the workload; the open system model test reveals that the server sometimes falls behind, resulting in a cascading increase in the number of concurrent tasks. This test predicts an increase in the average and especially in the variation of the task times; the 95th percentile is more than double the paired VU test.
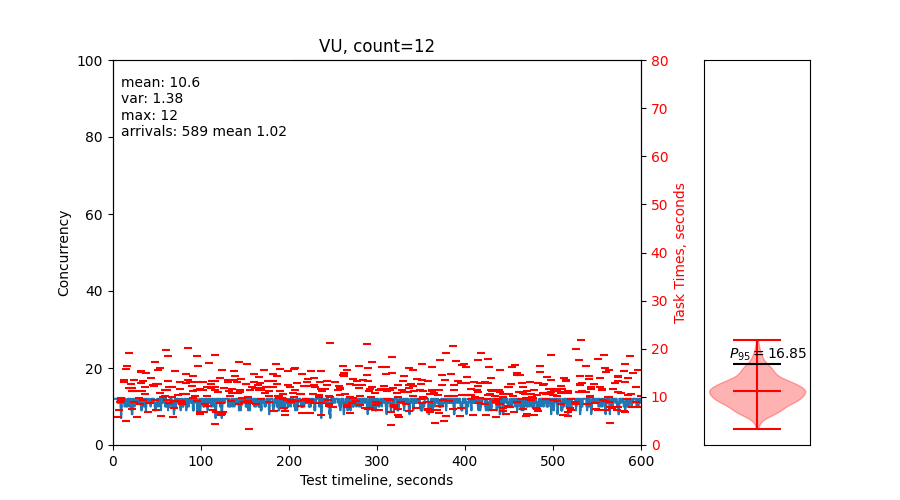
With a closed-system model test, these peaks in workload are clipped from the test, so the system seems to plug along, predicting performance very similar to that of the lightly loaded system. Looking at the results of a VU-based load test would mislead us into thinking that everything was fine at this level of load. In fact, the system is on the verge of failure and is delivering sub-par performance.
Overload
Figure 5
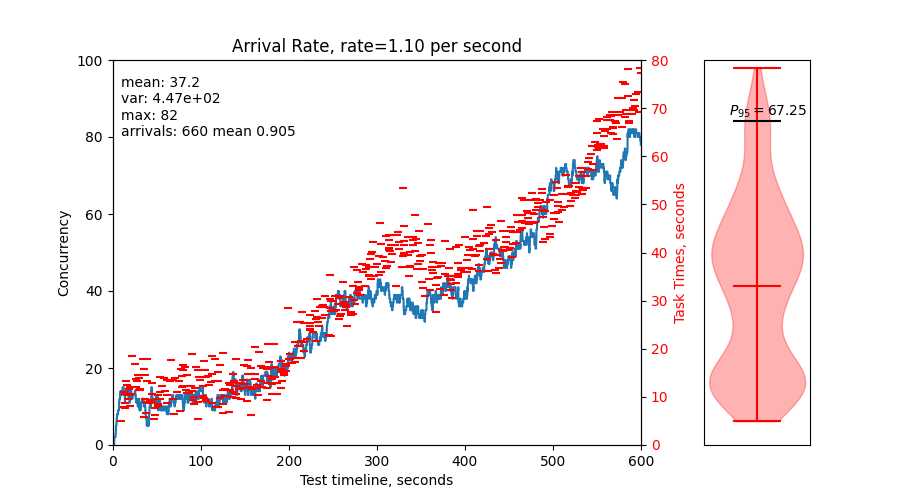
Figure 6
This arrival rate test shows that the system is clearly over capacity. The number of outstanding tasks is continually increasing and will continue to go up until something breaks. Task times are getting longer and longer as the test goes on.
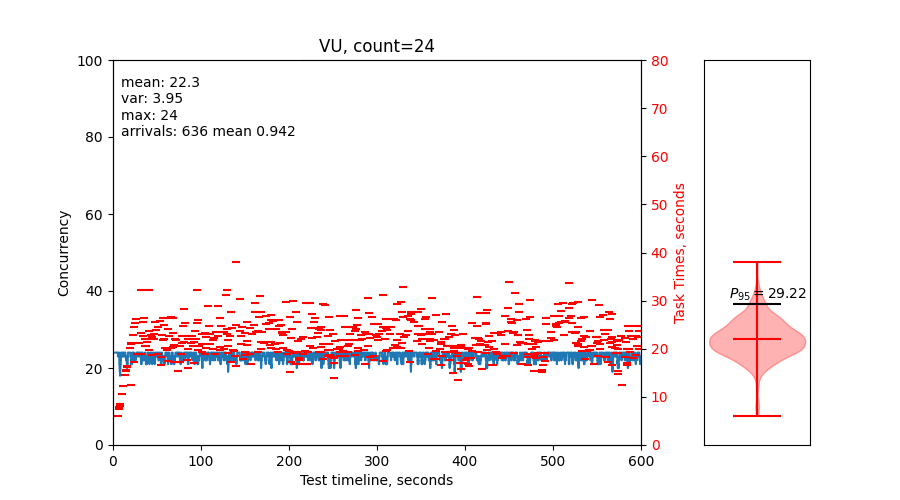
The VU test shows an increase in task times compared to the previous graphs because the tasks are waiting for service. You can see in the graph that the tasks stack up at the start of the test, and then execute in the same pattern as in previous VU tests. However, the system is never actually driven into overload. Since each virtual user waits for previous tasks to finish before starting the next task, the load test has throttled itself down to the capacity of the system. Thanks to this auto-throttling behavior, it’s very difficult to use a VU system to produce a realistic test of a system overload.
The above results show some of the dangers of using a closed system model to construct a load test. We know that most real-world systems are better fit by an open system model, so unless you have good reason to believe you are in a closed system situation, we recommend using an open system model for load testing.
Our first recommendation is to discuss workloads in terms of arrival rates. If, as is likely, your actual workloads are best represented by an open system model, it’s best to use an arrival rate to describe the workload. Don’t use a count of virtual users, as that is likely to mislead.
Our second recommendation is to be very cautious about the results of any VU-based load test. Such a test can lead to overly optimistic performance predictions and can miss failures that a better test would predict.
Our third recommendation is to either use an arrival-rate-based tool (like Tsung or Gatling) for load testing or adapt a VU system to do arrival rate simulation. If you’re using the popular JMeter tool, which is VU-based by heritage, there are plugins (Precise Throughput Timer and Open Model Thread Group) that effectively convert it to a rate-based tool. If you’re using a VU-based system that lacks a rate-based scheduling option, you can get the effect of arrival rate scheduling by delaying each task start according to a rate-based schedule.
