
Historically, building an iOS application was always a simple task, a small lightweight application that simply displayed a list of items or made very few network calls. Most of the processing happens server-side and therefore making iOS applications very slim.
Because of this reason, collecting metrics was always the last thought and never really considered that important, or you’d grab the basics that you got for “free” from an SDK you’d already implemented like Firebase or Google Analytics.
As the industry has exploded with growth over the years, iOS applications have become a fundamental piece to most companies portfolios. This means, iOS applications have become much more than lightweight apps, now, you can book an entire holiday or even write code.
This means, iOS applications have so much more than a list of data, instead we’re now deploying critical services to millions of customers, and unlike deploying something on the web, once your application has been deployed on the App Store, you’re ultimately left wondering “How is my application performing?”.
Introducing MetricKit
Apple always provided some level of reporting via App Store Connect (previously iTunes Connect) but the level of detail was small and even down in the API layer it was difficult to grab the information.
In 2019, Apple announced MetricKit, a brand new framework written in Swift that I had the pleasure of watching live during WWDC19 in California. It provided a brand new API that would provide “out of the box” reporting linked directly inside your Xcode Organizer.
But more so, they provided all of this raw data (either as JSON or a dictionary) so you can upload it directly to your server to digest and display in real-time.
Out of The Box Metrics
By default, you’re using MetricKit, because Apple is pulling out key bits of information and displaying for you directly in either App Store Connect or Xcode Organizer.
Open Xcode and Navigate to:
Window -> Organizer
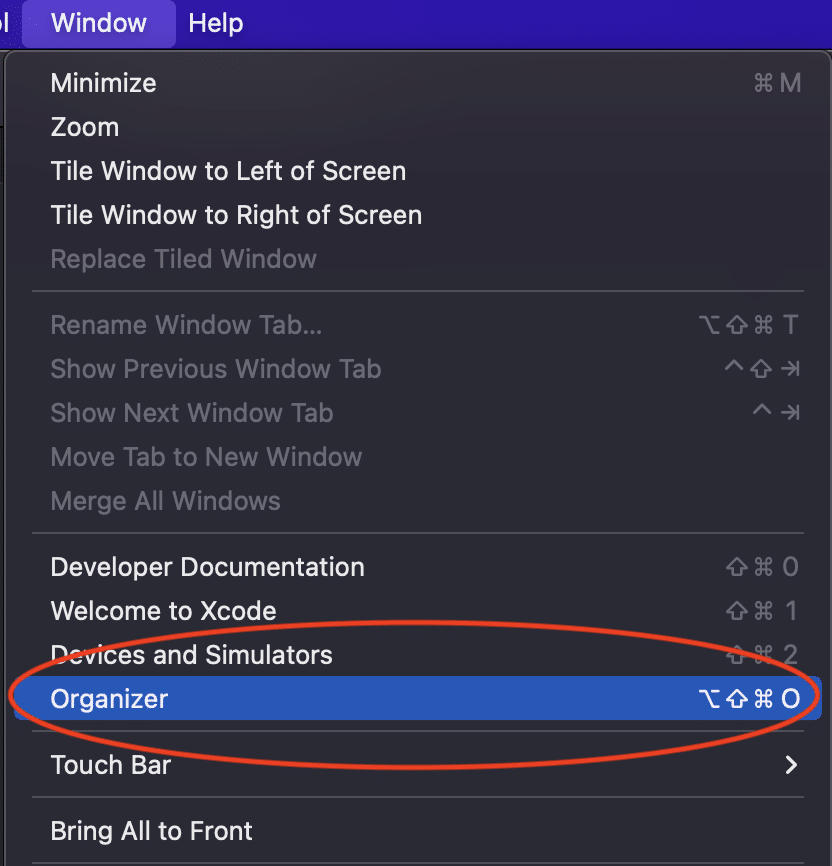
You need to make sure your iOS application is selected.
On the left-hand side of your Organizer window, you will see the tab which is grouping all of your MetricKit data that is getting pulled automatically from the OS.

In some cases, you might see the “Insufficient Metrics Data” error message. MetricKit is pulling data from users that have enabled “Share Anonymous Data to App Developers” when setting up their phone, if they disabled this then you won’t get that information from this user, and overall this error means you have little data to report on. You should visit in a couple more days or weeks.
This data can be super powerful, you’re able to compare to previous versions for example:
“Did version 1.0 perform better than version 1.2”
Answering this question previously was difficult but now can be improved with the data you’re provided. For example, did memory usage increase? How was scrolling performance handled?
Using the MetricKit Framework
All of the above is given “out of the box” and very little effort is required by you. However, if you want to dig deeper into the metrics you’re gathering or even upload them to your own server, then you’ll want to utilise the MetricKit API which is provided as a brand new framework written in Swift.
The way metrics are gathered is a very simple piece of logic. The device will collect logs for your application for the previous 24hours and will be made available to you in the API to download as either individual pieces of data or the entire JSON or Dictionary payload.
💡 Unfortunately, this is only available in iOS 13+
Let’s go ahead and explore using the MetricKit framework.
Create a brand new iOS application

In this example, you’re going to be using Swift and Storyboard.
Open your AppDelegate.swift file
import UIKit
import MetricKit
Next, change your didFinishLaunching function to be:
func application(_ application: UIApplication, didFinishLaunchingWithOptions launchOptions: [UIApplication.LaunchOptionsKey: Any]?) -> Bool {
    let metricManager = MXMetricManager.shared
    metricManager.add(self)
    return true
}
You’re creating a new instance of the MXMetricManager, a singleton object within the framework to register your delegate call back to.
You will start receiving an error from Xcode because you need to conform to the MXMetricManagerSubscriber.
extension AppDelegate: MXMetricManagerSubscriber {
  func didReceive(_ payloads: [MXMetricPayload]) {
    guard let firstPayload = payloads.first else { return }
    print(firstPayload.dictionaryRepresentation())
  }

  func didReceive(_ payloads: [MXDiagnosticPayload]) {
    guard let firstPayload = payloads.first else { return }
    print(firstPayload.dictionaryRepresentation())
  }
}
Add this code at the very end of your AppDelegate.swift file, to conform to the MXMetricManagerSubscriber protocol.
Both of these functions are called by the OS when a new batch of data is available from the user device. You won’t know when these are called because it’s completely determined by the OS, AppDelegate is a use-case here but you could also move this outside of the AppDelegate if you prefer.
In your code, you’re printing the contents of the very first payload object, the OS will return this as an array type because you can collect an array of previous days if you missed them.
Go ahead and run your project
Debugging MetricKit
You’ll quickly realize that the function is never called, firstly, this is only testable using a real device, but even then it’s not an easy straight forward process to test.
Start by plugging in your real device.
Run the sample app on your device.
Navigate to Xcode then Debug > Simulate MetricKit Payloads
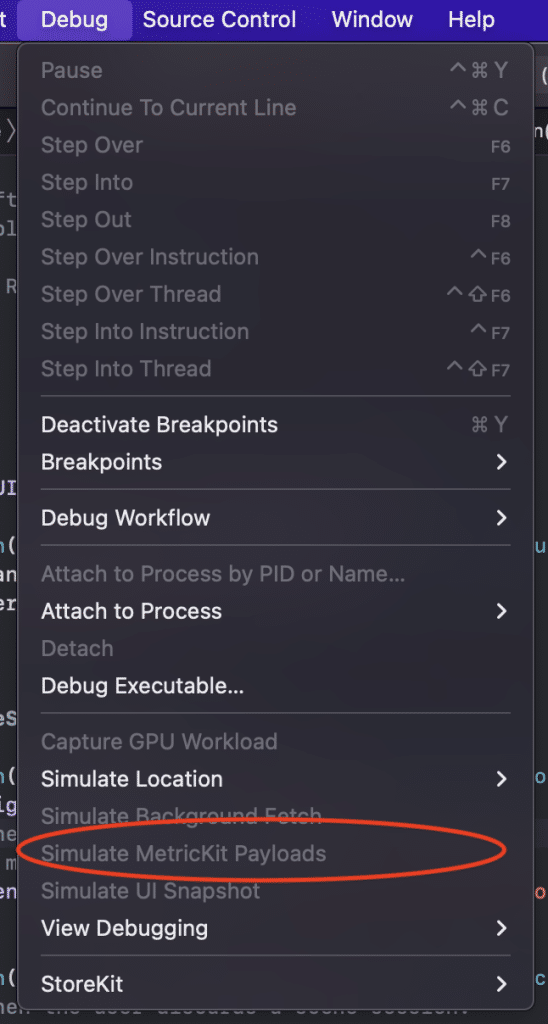
This will immediately trigger the MetricKit update from the OS and your functions should be printing out the contents. It’s worth noting that this is sample data you’re provided so don’t be worried too much by the contents. However, know the contract won’t change when you’re sending this data elsewhere.
Implementing Custom Metrics
Even though Apple is providing you with so much information, for example, Battery Usage, Cellular details (number of bars on average used) it’s also worthwhile to add your own custom metrics. You can do this by utilising MXSignpostMetric.
In your AppDelegate, just beneath the creation of the MXMetricManager add the following code:
let logHandle = MXMetricManager.makeLogHandle(category: "SwiftlyRush")This is creating a new LogHandle category within the MetricManager class. You can visualise this as a “bucket” a place where you can drop all different pieces of information relating to this category. In your real application, it might be a bucket defined by a piece of functionality or screen that is being used.
mxSignpost(
  .event,
  log: logHandle,
  name: "Loading SwiftlyRush application")
Calling the mxSignpost function along with the type, log and name of the event means you’re adding this to the MetricKit pool of data, that will be exposed alongside all the other data within the payloads object.
This is a very simple example of how to log custom data within the MetricKit framework, the possibilities are endless.
What’s Next?
MetricKit is a great way to access existing vital bits of information so you can better support your users, understand the smallest bits of detail so you can keep on improving.
Keep on exploring MetricKit and see how it could fit your application, the framework also provide Diagnostics data + lots more.
There are many WWDC videos that I would recommend watching, like this one here. Also, Apple keeps on improving this framework and you can see the changes in this updated video here.
I look forward to seeing what you do with MetricKit next!

