
For community managers, data and analytics are critical at every stage of community building. They must leverage the data gathered from the behavior of the community members to make decisions that encourage community expansion and growth. As an online community builder, I feel that there is more insight to be gleaned from community behavior, and I am never satisfied with the out-of-the-box analytics from community platform vendors. Instead, I have found that data science tools and techniques have allowed me to harvest deeper, more valuable insights, enabling me to understand the community members’ needs and make better operational and strategic decisions. In this article, I show how you too can utilize data science to become a more effective and successful community manager.
For this analysis, I used my client Liferay’s data from the Liferay Community Forums. In their open source spirit, Liferay has allowed me to publish this analysis of their member activity over the past 10 years. For Liferay and other large, active online “Shop Talk” communities, where discussions focus on accomplishing a task or getting technical help, community managers’ biggest challenges are:
- To continuously improve the experience for the members
- To get good, quick answers to the questions in the forums
- To optimize the operations of the community
- To manage the strategy for the community
Understanding Member Lifespans
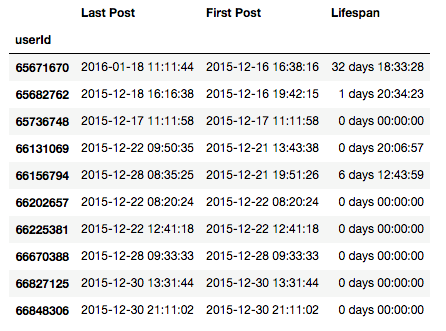
Understanding the member journey over time can allow the community manager to understand how users evolve and how to best engage them during this process. The first step in this process is to understand how long users remain active on the forum. Using a “groupby” feature in Python, I calculated users’ lifespans by grouping each user’s posts together and computing the difference in time between the first and last post.
The plot below demonstrates that almost 800 members had a life span of 1 day, with a large drop in frequency thereafter.

I was also interested in understanding the veteran members. I zeroed in on the veterans’ lifespans by changed the scale on the graph above from days to years.
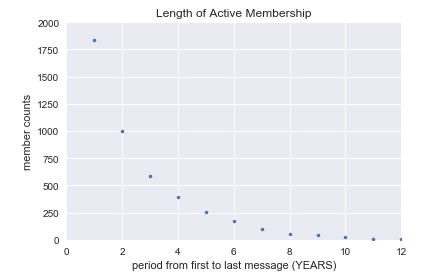
This chart shows that the majority of members had forum lifespans of 1-2 years, with activity drastically decreasing thereafter.
Using the Data to Manage the Strategy for the Community
With this data in hand, you can initiate a special outreach campaign after a member writes 1 post, and send personalized messages to new members, encouraging continuing engagement. Perhaps you could even award new members points in a “gamification” system to foster further interaction.
Understanding Forum Content to Improve User Experience
Word clouds are a visual way to identify words that often appear in a forum, and they are a great way to visualize popular topics in the community (see word cloud examples below). Furthermore, these word clouds can be leveraged to improve the community members’ experiences. For example, the same popular words identified through the word clouds can be used to influence the member’s activity feed, making the feed more relevant and interesting for each user.

It is also helpful to understand the community’s popular topics. The chart below contains the word counts from the subject lines in 2 Liferay discussion groups.
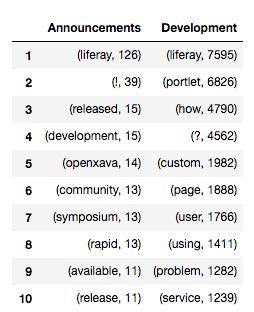
The “?” and word “How” that appear in the Liferay Development category are typical of Shop Talk communities where the primary use case is members asking other members technical or product-related questions. This “Q & A” content structure can be confirmed by looking at the most common trigrams (3 word combinations) below.

Data Science Can Help Optimize Operations
NLP can also help with routine, but essential, community management operations. I explored common words in the large “development” category that could be used to form smaller, more manageable discussion categories, which would allow users to get more relevant answers in the forums.
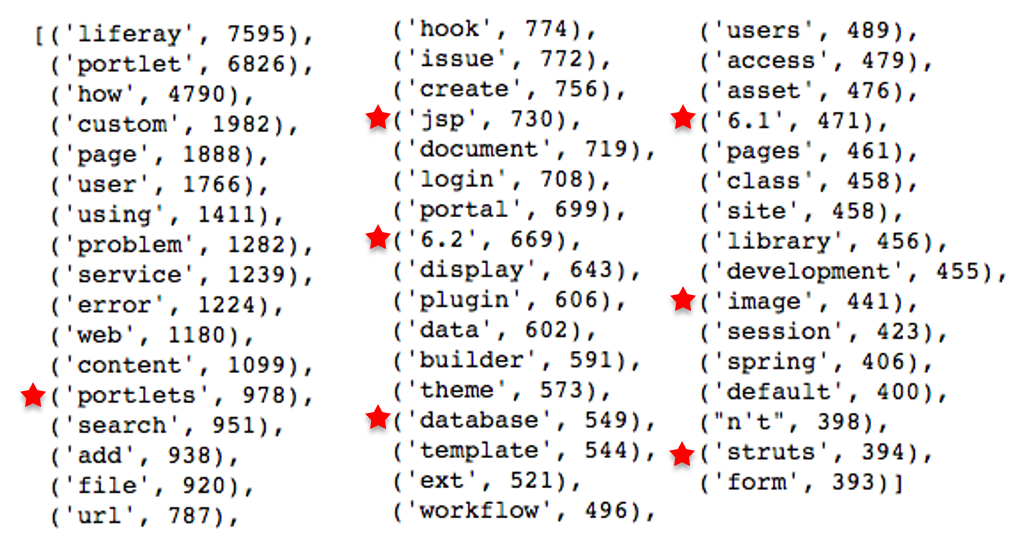
It is clear that there are some good candidates here for topics that can be separated out to form new sub-groups.
- Portlet
- JSP
- Builder
- Theme
- Database
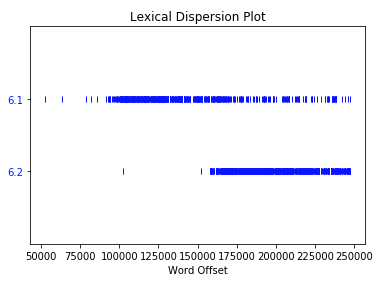
Lexical dispersion plots are another way to visualize trending topics in the forums, allowing you to strategically introduce new subjects or create new discussions on existing popular issues.
The below plot indicates that the community talked intensely about “6.1” (presumably, a version of Liferay), with an overlap of “6.1” and “6.2” as “6.2” was released.
There is much more that can be discovered by analyzing user behavior and the content itself. Yet, even the relatively basic but targeted data science techniques I have demonstrated can help you gain insight and improve your community management strategies.
Warning: Attempt to read property "base" on array in /home3/trusten9/public_html/leadernetworks/wp-content/plugins/wp-user-profile-avatar/shortcodes/wp-user-profile-avatar-shortcodes.php on line 665
Warning: Attempt to read property "base" on array in /home3/trusten9/public_html/leadernetworks/wp-content/plugins/wp-user-profile-avatar/shortcodes/wp-user-profile-avatar-shortcodes.php on line 665
Warning: Attempt to read property "base" on array in /home3/trusten9/public_html/leadernetworks/wp-content/plugins/wp-user-profile-avatar/shortcodes/wp-user-profile-avatar-shortcodes.php on line 665
Warning: Attempt to read property "base" on array in /home3/trusten9/public_html/leadernetworks/wp-content/plugins/wp-user-profile-avatar/shortcodes/wp-user-profile-avatar-shortcodes.php on line 665
Related Posts

Online Community Success Metrics – New Guide and Framework
To help community leaders link community performance with business impact – we…

What does customer intimacy really look like?
Our events were unique because they delivered something our customers couldn’t…
This is really cool; can you share a bit more about how you compiled the data? Were you looking at a complete data dump from the community, or using an online tool to analyze?
Thanks Rosemary. I started with a complete data dump (CSV files), and then did a lot of cleaning to make a table for analysis in Python. I ff you want more details, including code and test data take a look at GitHub.
Great to see applied science coming to community understanding and management.