Code quality issues can cost time, money, and frustration.
However, just because some code lacks in quality, that doesn’t mean it’s an immediate problem. The impact of code quality depends on context.
This article presents a novel approach to visualize code quality so that – at a quick glance – we can:
- identify any problematic modules,
- rank their relevance, and
- tell how deep the code quality issues go.
To make it specific, we will look at measurements from real-world codebases like jUnit, Zookeeeper, SonarQube, Kubernetes, and React. This is code like you haven’t seen it before, so let’s dig in!
A gallery of code: examples on visualizing code health at scale.
Measuring Code Quality: beyond a single metric
I have to admit that I dislike the word “code quality”. It suggests an absolute whereas the reality is much more complicated. Software complexity itself is, well, complex. There just isn’t a single number that can capture the multi-faceted concept we refer to as “code quality”.
Instead, I have taken a lot of inspiration from a paper by Fenton (Software Measurement: A Necessary Scientific Basis, N. Fenton, 1994). Fenton’s research finds that the most promising approach is to identify specific attributes of code complexity and measure these separately. This view formed the basis of the code health concept.
By visualizing the code health, we can quickly detect problematic modules and – more importantly – see how deep any problems go. Is it just a few modules, or are their pervasive code health issues throughout the codebase?
What is Code Health?
Code health is an aggregated metric based on properties of both code and organizational factors. These factors are known to correlate with increased maintenance costs and with higher risks of defects (common examples include Brain Methods, DRY violations, Developer Congestion, Low Cohesion, etc.).
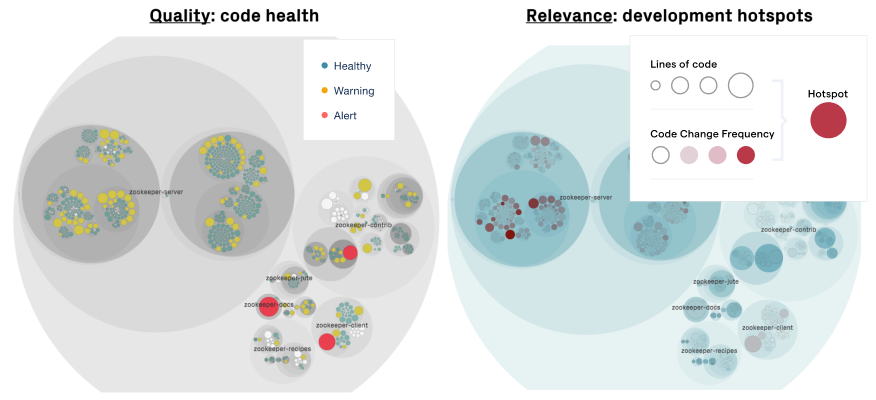
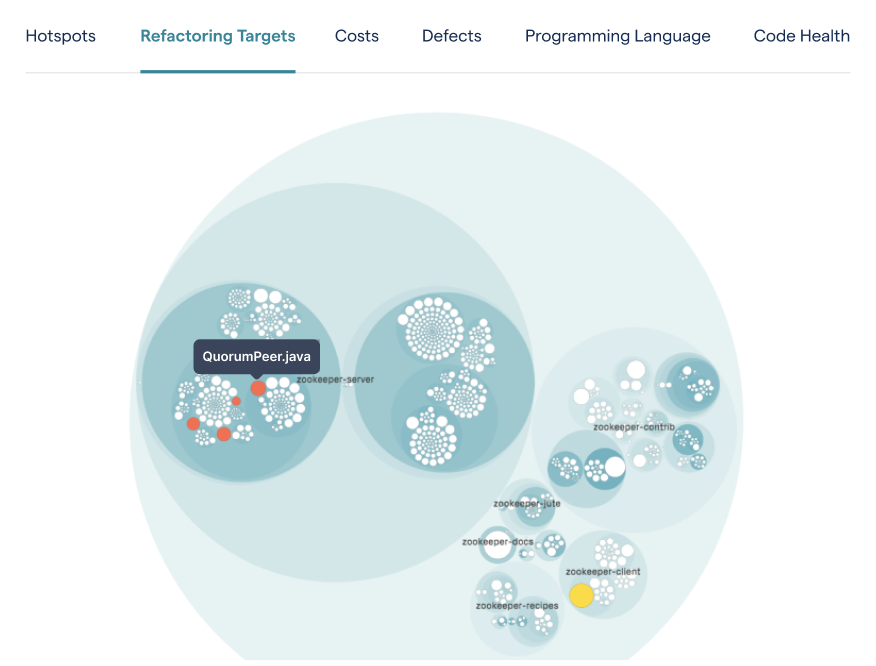
Visualize the code health in the context of development activity to prioritize and assess the relevance of the findings.
The preceding figure visualizes code health in the Apache Zookeeper codebase. Each file with source code is represented as a circle, and the color of the circles reflect the code health. We see that there are a number of problematic modules – indicated using the red alert color – but the hotspot map to the right reveals that most of these modules are stable, meaning there’s low development activity in these areas.
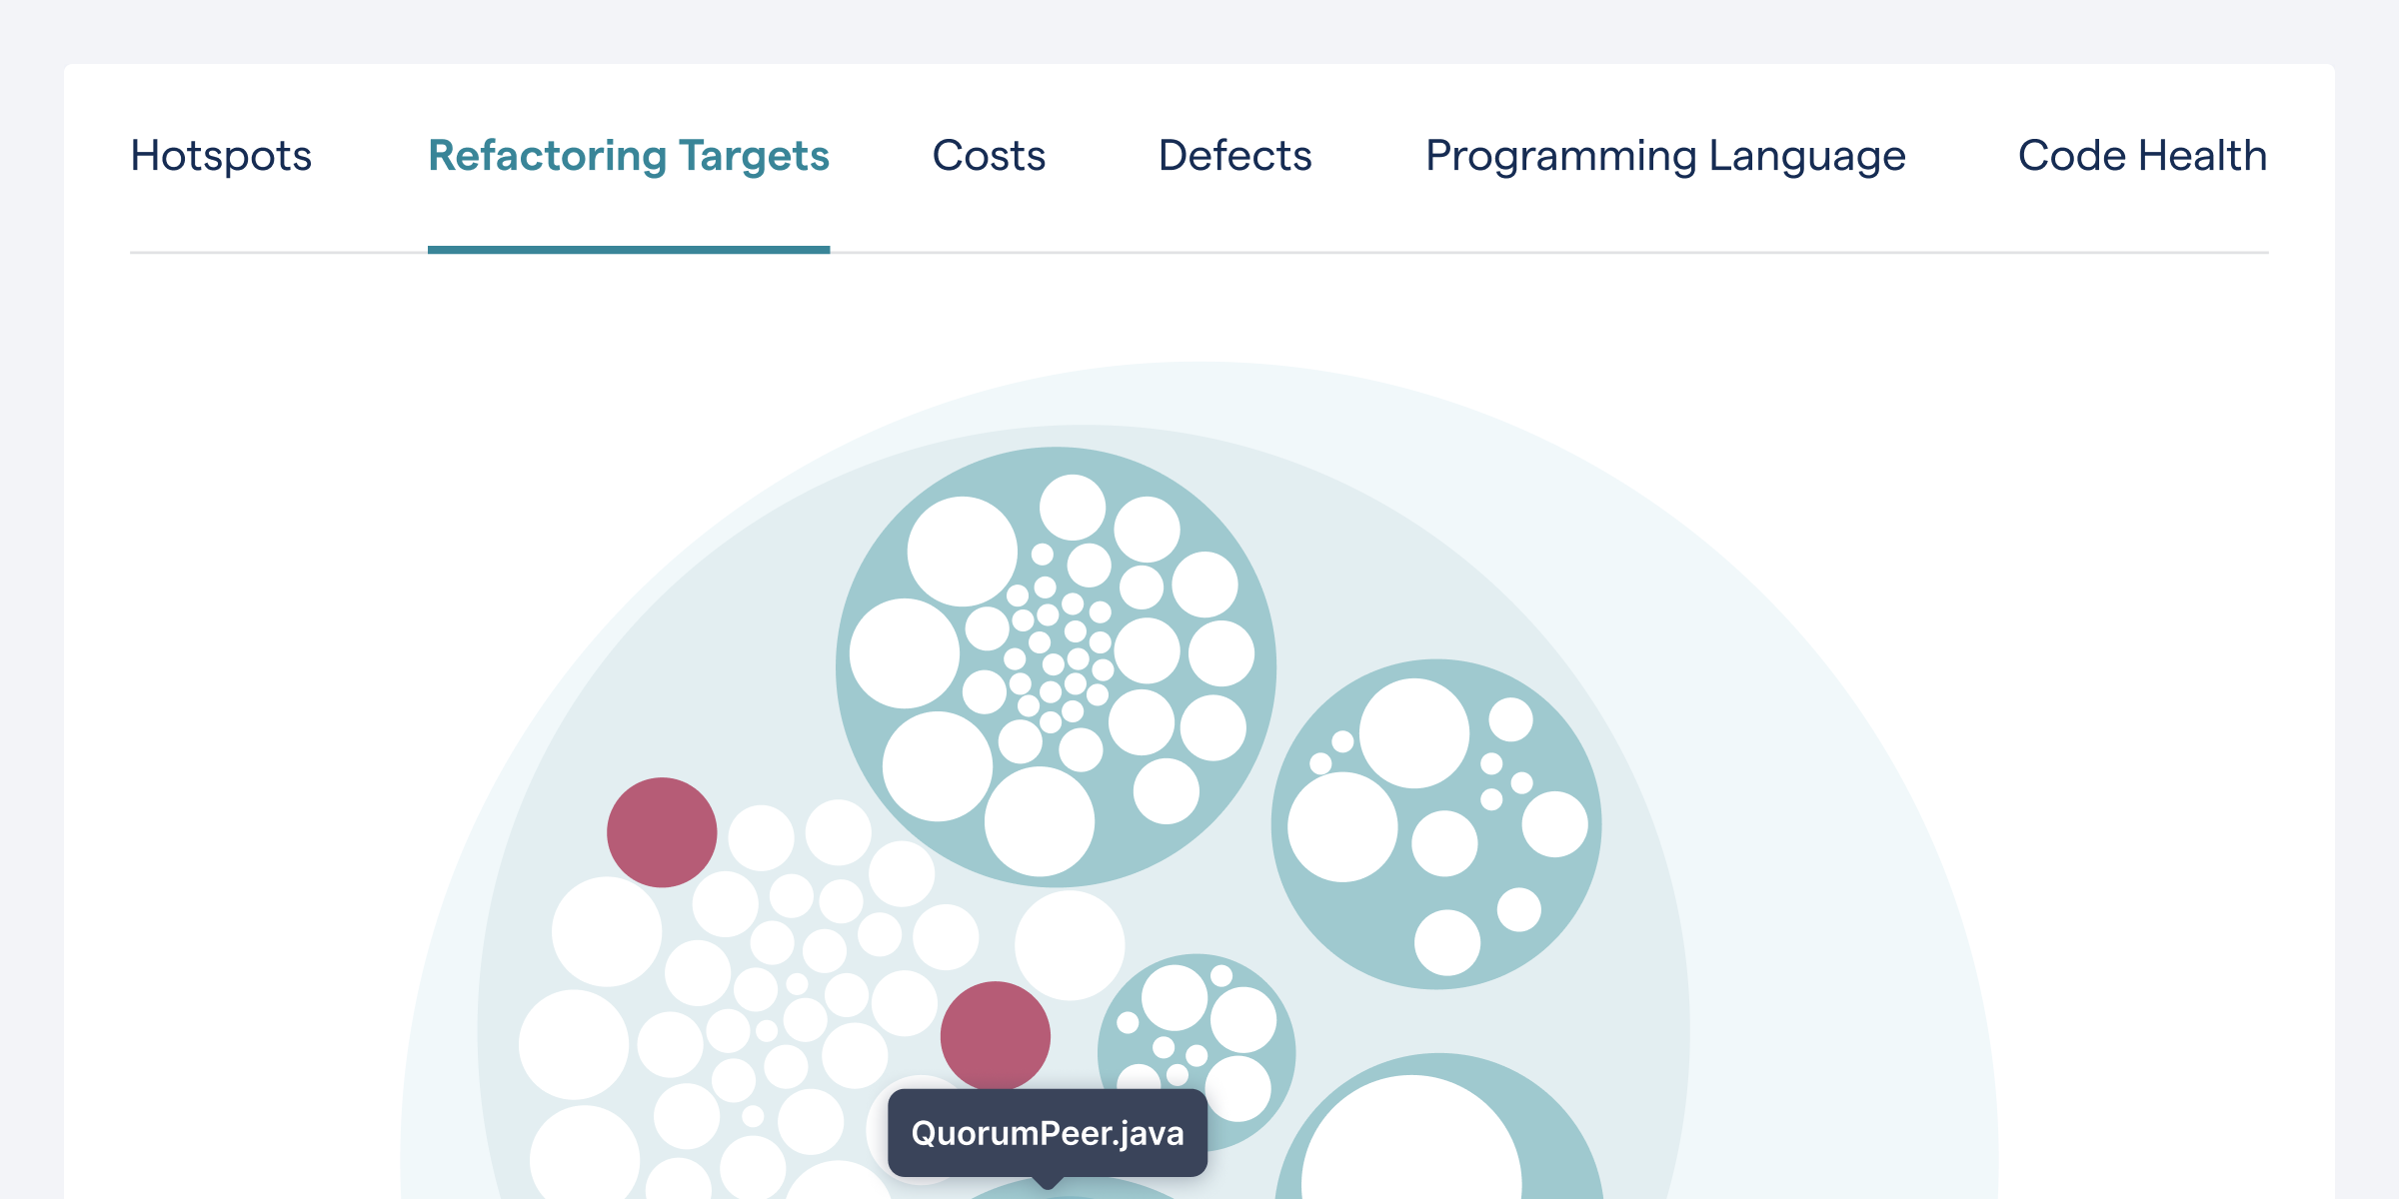
This combination of quality attributes with development relevance is powerful. It gives us a tool to prioritize our findings. Let’s see what the intersection looks like:
Prioritize code health issues that need your attention using a combination of hotspots and complexity metrics.
The preceding view shows prioritized hotspots that have code health issues. Even though I’ve worked with these techniques for years, there are two things that keeps me fascinated:
- It’s not always the code with the most severe quality issues that should be fixed first. In fact, in many codebases, even problematic code can stabilize over time.
- Hotspots give us super powers. Even in large codebases, we can quickly get clear priorities on where we need to focus our attention. And this is all based on behavioral data from how we developers interact with the code we’re building. Hotspots are like a collective vote for the importance of each module.
A Code Health Gallery
Now that we know how to interpret these graphs, I’d like to take you on a tour of some well-known open-source projects. The purpose of this tour is a) to demonstrate how quickly you can assess the overall code health of an unfamiliar system, and b) show you something cool; there’s a certain beauty to systems at scale.
Code Health in JUnit5
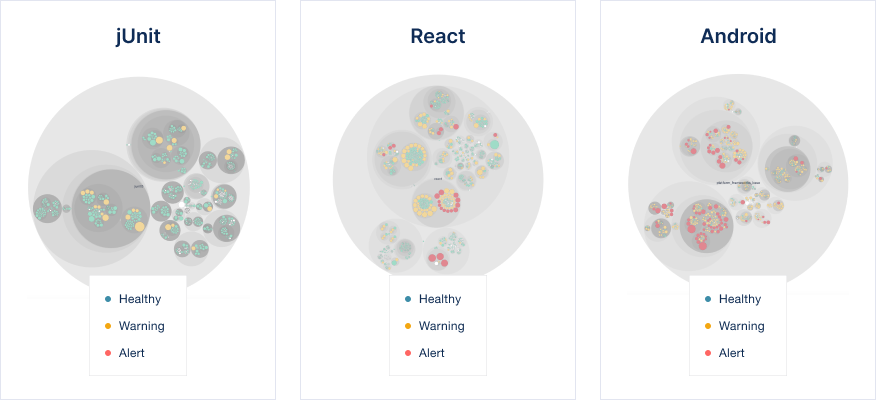
The unit test library JUnit has a rich history, and its origins go back more than 20 years. JUnit is still under active development. Looking at its code health visualization, we see that all code is in good shape. This is clear proof that code doesn’t have to degrade over time; with care, a codebase can remain maintainable. Impressive.
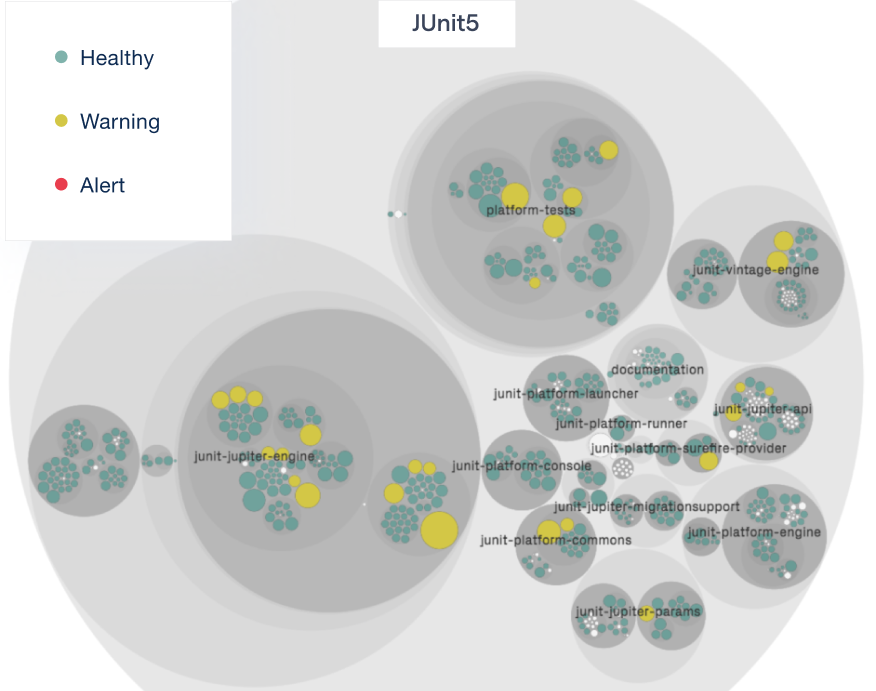
Visualizing the JUnit5 code health.
Code Health in Kubernetes
Kubernetes is a popular infrastructure for container orchestration with lots of development activity. It’s also a massive codebase with 4 million lines of code. Sure, lots of it seems auto-generated, but a code health visualization points out a cluster of code health alerts in the API validation packages:
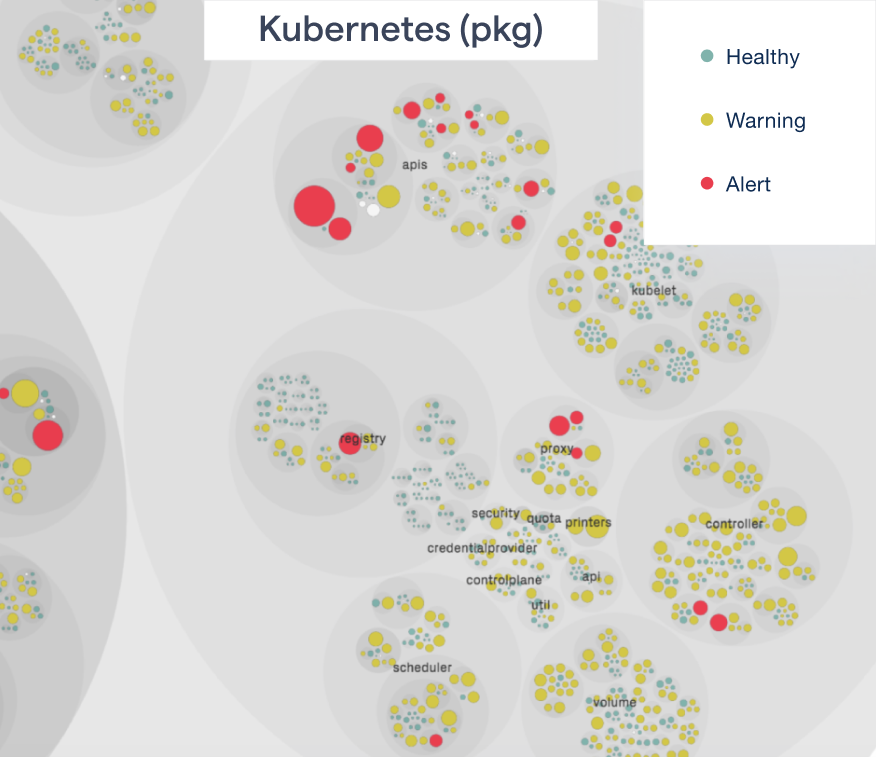
Visualizing the Kubernetes code health.
Code Health in React
React is a powerful JavaScript library for building user interfaces. I prioritized the technical debt in React back in 2019 when I published an article called Under the Hood: Prioritizing Technical Debt in React. Back then, we noticed a number of development hotspots that were growing in complexity.
These hotspots are still clearly visible in the react-reconciler package highlighted below. However, we also note that the React team seems to have started refactoring and has – partly – reworked these hotspots:
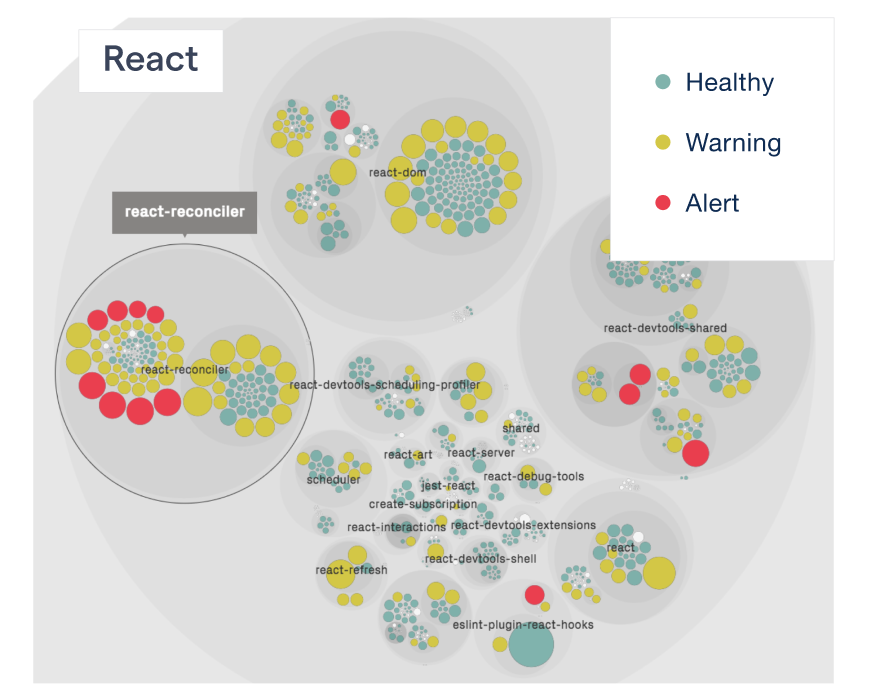
Visualizing the React code health.
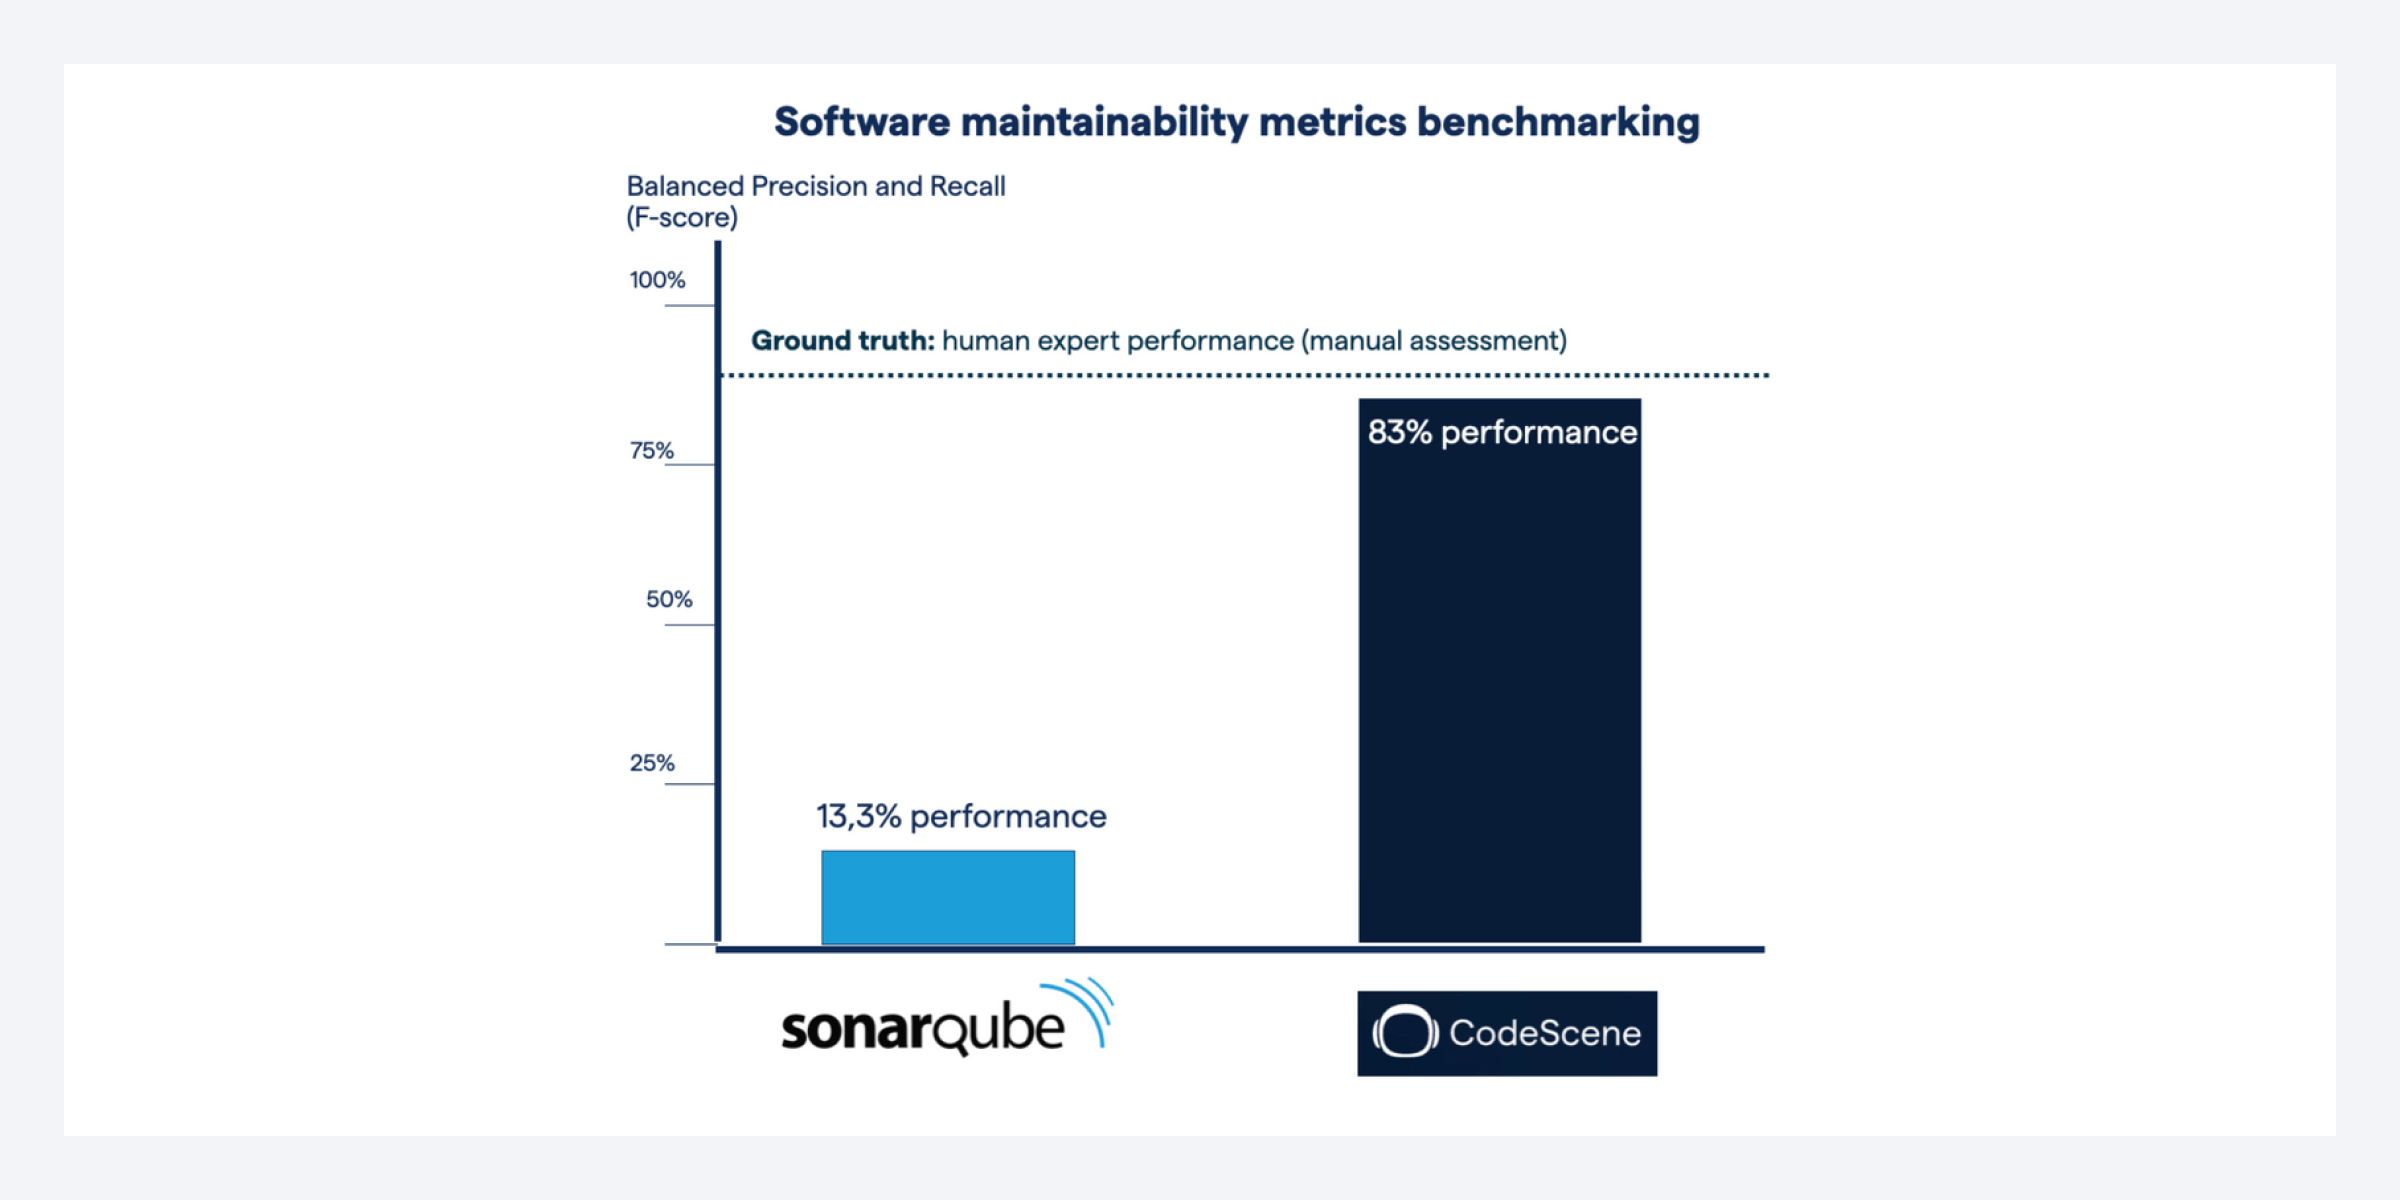
Code Health in SonarQube
I have to admit that SonarQube has a special place in my heart. I’ve never used the tool myself, but I had to learn about it since I’m frequently asked how CodeScene differs from SonarQube. I’ve also been fortunate to meet one of the founders, and we both agree that CodeScene and SonarQube are very different tools that serve different purposes. SonarQube is a strong static analysis tool; CodeScene is all about prioritizing and making the invisible visible, such as the intersection of code and the organization. If you’re serious about delivering high quality code, then you want to combine static analysis with behavioral code analysis techniques.
Now, back to the code health gallery – here’s the SonarQube code health view:
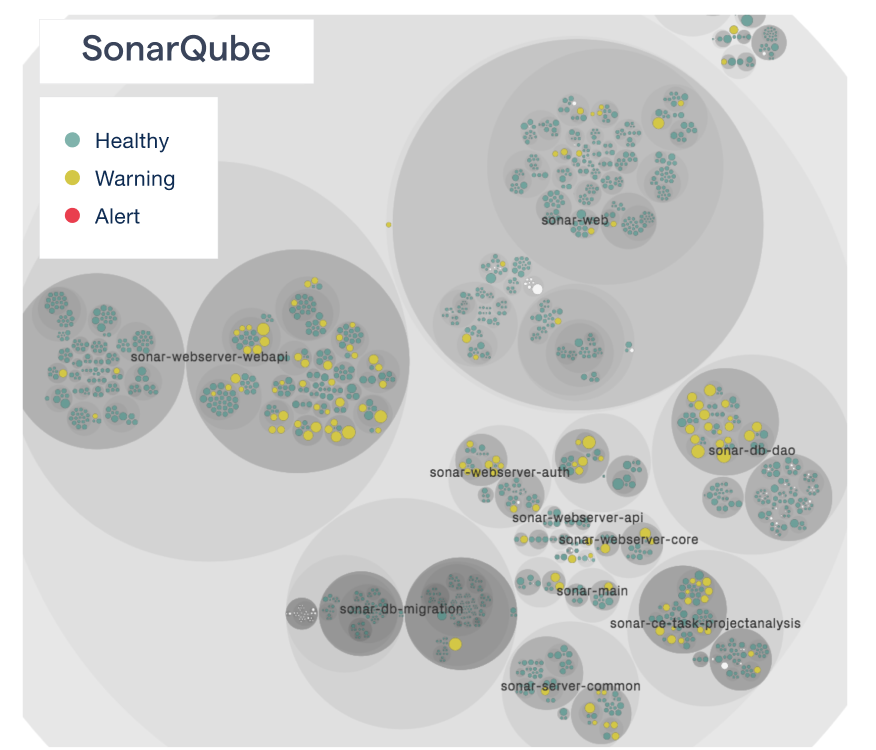
Comparing the application code with the test code in the SonarQube codebase.
The code health is high overall, which is not surprising given the domain. What’s most interesting about the SonarQube codebase, though,is that there’s a noticeable difference between application code and test code.
Here are some examples:
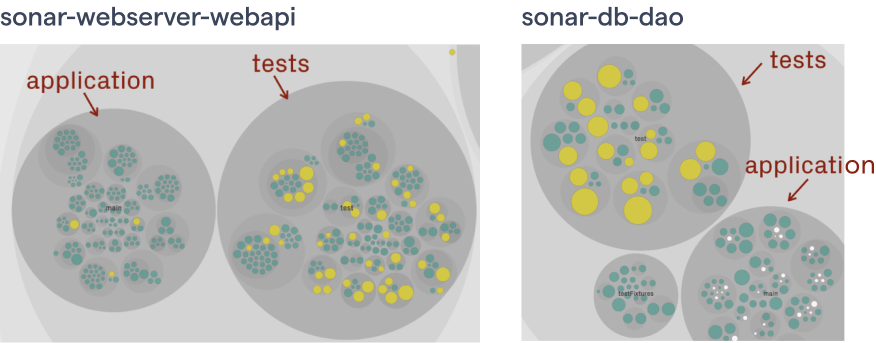
Comparing the application code with the test code in the SonarQube codebase.
This is a pattern that I’ve seen in many codebases: as developers, we seem to make a mental distinction between test code and application code. Consequently, some of the most problematic code that I tend to find is in the test code. So is that important? Well, from a cost and maintenance perspective, there’s no difference between test code and application code; if your tests lack in quality, then they will hold back your overall efforts.
There’s more: know the trade-offs
Before I wrap up, I have to point out that there’s more to code quality than the health of the individual modules. In software, we have this trade-off where we need to balance cohesion with coupling. When we fail, we can have modules
that are superficially simple, yet complex to understand due to their inter-dependencies with other modules.
So when analyzing code, I always consider the change coupling too – if I need to modify this piece of code, what else is likely to change as well? Combining code health with a change coupling view helps me to make a quick assessment of any codebase.
..svg)
Change coupling measures the logical coupling between modules that are frequently changed together (example from a SonarQube hotspot).
Prioritize complex code that has a business impact
Low code quality is disastrous to a product under active feature development. In this article I wanted to share a technique that helps you to quickly:
- Identify any problematic areas in a codebase.
- Prioritize those findings based on the relevance and likely business impact.
- Use them at scale with clear prioritizes even in codebases with million lines of code.
And the best thing is that it’s all fully automated and available today! It is easy to create and set up a free account or a paid plan for larger projects, and try out CodeScene. It is free for all open source repositories and (very) affordable for closed source projects.