The Serverless Framework has amazing monitoring and alerting; however, until today, this has only been available for the Node runtime. Now, we are adding support for Python to the Serverless Framework Dashboard to enable monitoring, alerts, and much more for your Python serverless applications.
Python is the second most popular runtime for building serverless architectures, making up over 20% of applications built using the Serverless Framework. Considering that AWS Lambda started as Javascript-only, it is impressive that Python has been able to get so much traction amongst Serverless Framework developers.
If you want to configure free monitoring and alerts for your Serverless Python project you can get started now here.
Let’s have a look at some of the great things you get as a Python developer using the Serverless Dashboard.
Serverless Monitoring
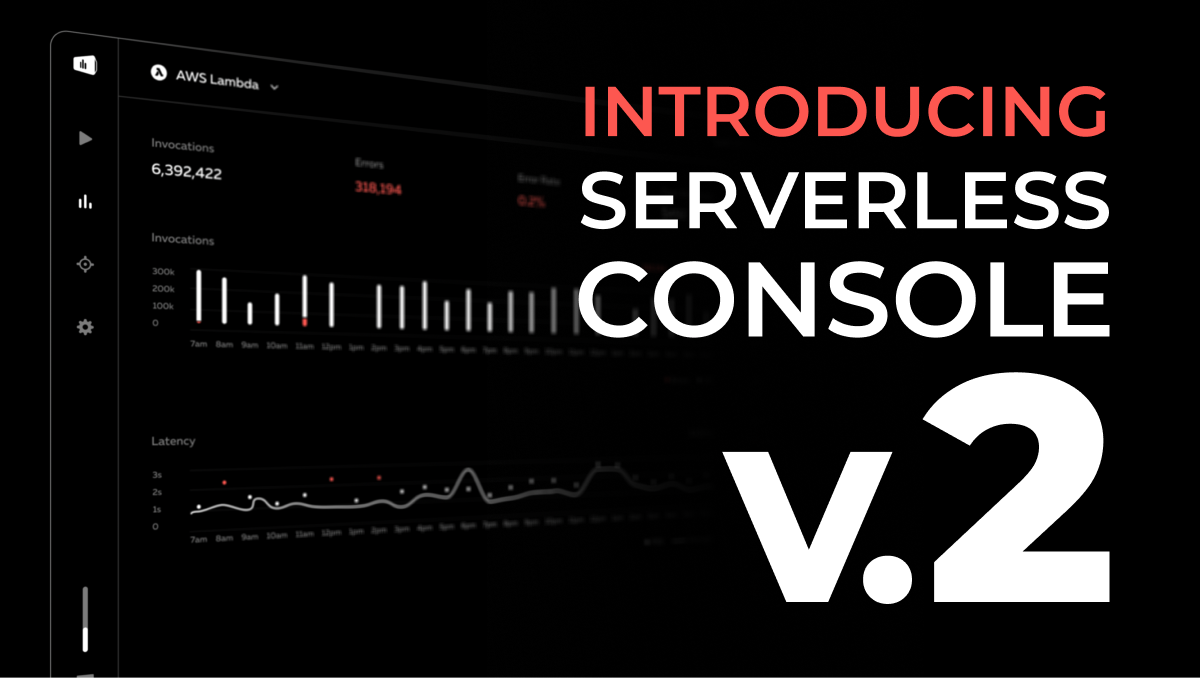
The minute you deploy your Python service with the Serverless Framework Dashboard, metrics will be collected and displayed in your dashboard. Without any additional configuration you’ll get access to invocations, errors, and cold starts across API Gateway and Lambda functions.

Invocation Explorer
The invocation explorer is one of the most powerful troubleshooting tools in the Serverless Framework Dashboard.
Its powerful, yet simple, querying enables you to find the needle in the haystack. Filter by function, memory usage, duration, error status, and more, to find the invocation you need. No more sifting through CloudWatch! The invocation details will show you all of the details you need to identify the root cause of a problem. You’ll get the CloudWatch logs, stack trace, functions spans, and more.

Stack Traces
If the function invocation crashes, the stack trace is recorded and you can find the root cause in no time. The “new error type” alert will notify you of new errors and you’ll be able to see the errors in the metrics and invocation explorer. You can also use the integrated Python SDK to record handled exceptions even if your function doesn’t crash.

CloudWatch Logs
With the powerful Invocation Explorer you no longer need to sift through CloudWatch to find an invocation, and it provides you with CloudWatch logs for all invocations. The Serverless Framework Dashboard pulls in the CloudWatch logs you need so you have everything all in one place.

Function Spans
Deploy your application with the Serverless Framework Dashboard enabled and it will automatically instrument calls made by your Lambda functions to any AWS service or HTTP endpoint. You’ll be able to see what AWS services were called, what methods they called, and their time span. You’ll also see what HTTP services were called, including the host name, HTTP code response, method, host, path, and the time span.
All of this instrumentation is 100% automatic, no need to add any plugins, wrappers, or instrumentation.

Alerts
Serverless Framework Dashboard comes with nine alerts available out of the box, no configuration or setup needed. Your serverless functions will be monitored for memory usage, durations, and errors the minute you deploy them. You’ll be notified of these alerts in Slack, email, or you can easily set up custom notifications via point and click integrations with SNS and webhooks.

And more...
While I have shown you the monitoring features that the Serverless Dashboard now provides Python users, there are many other powerful features in the Serverless Framework. This includes features like security and operational safeguard policies, deployment profiles, output variables, and more, which together provide Python developers a full-lifecycle solution for their serverless application.
Get started with zero configuration
You can enable all of these powerful features without having to instrument your code or configure anything. This all works out of the box when you enable the Serverless Dashboard. Here is how you get started...
If you are new to Serverless Framework install it with npm install serverless --global. While the framework uses Node & NPM to install, it still supports Python as a runtime. If you don’t have a Serverless Dashboard account, register at https://app.serverless.com/ and then login in the CLI with serverless login.
If you are new to the Serverless Framework, run serverless and select AWS Python. If you have an existing Python Serverless Framework project, run serverless in the directory containing your serverless.yml file. This will make sure all the requirements are met, and then update your serverless.yml to include org and app from your Dashboard.
When you are done setting up the Dashboard, don’t forget to redeploy your service with serverless deploy. And just like that, you’ll have access to metrics and alerts in the Dashboard for your Python Serverless Framework service.