
By: Kobe Chen, Steve Dalla, Michael Hume, Andrew Kelser, Jason Kwak, Ben Meron, and Paurakh Rijal
Introduction
Money talks… or at least the saying goes, and why wouldn’t it? In sports, common sense leads most fans to believe that the more money their team spends on superstars, the more wins and success it would achieve, but is that actually the case? From the Oakland A’s magical 2002 season run to the ’95-’96 Chicago Bulls, we’ve seen teams achieve unprecedented results with payrolls that barely crack the top half of their respective league–if at all–while alleged all-star teams like the ’04 Yankees failed to even reach the World Series. In this article, we investigate the empirical relationship between payroll and success in the MLB and NBA to discover how spending money affects the performance of a team. We also explore how team salary concentration correlates with winning percentage, independent of a team’s total payroll.
Results for MLB
Since there is no salary floor or salary cap in baseball, there is substantial heterogeneity in MLB payrolls. The 2015 Dodgers had the greatest payroll of any team between 2011 and 2022 at $324 million, while the 2013 Astros’ total salary amounted to only $37.8 million. The mean payroll over this time period was $133 million and the standard deviation of team payrolls was an enormous $52.3 million. The mean payroll has changed significantly over time, with teams spending much more now than they did a decade ago: the average team salary was $166 million in 2022 vs $106 million in 2011. When analyzing salaries, it can therefore be useful to contextualize them based on year. Therefore, we created a variable called Relative Salary, which is defined as follows:
Relative Salary = (a team’s payroll in year t) / (the average payroll in year t) * 100
As the plot below, which analyzes teams from 2011 through 2022, shows, teams with higher relative salaries tend to perform better (correlation = 0.38). Based on the results of a linear regression, a team with a relative salary of 100 (meaning that its payroll in year t is equal to the average payroll in year t) would be expected to have a winning percentage of 0.500. In contrast, a team with a relative salary of 110 (meaning that its payroll in year t is 10% higher than the average payroll in year t) would be expected to have a winning percentage of 0.509.

We have shown that baseball teams can win more by spending more, but most teams are unwilling to spend ad infinitum. Thus, teams are faced with the question of how to maximize their winning percentage given a fixed budget. In particular, is it more profitable for a team to concentrate its spending on a few star players or to forgo the stars and pay for a lot of good but unspectacular players?
To answer this question, we used HHI (Herfindahl–Hirschman index) to measure payroll concentration. We define the HHI of a team as follows:
HHI = ((salary of player 1) / (team payroll))2 + ((salary of player 2) / (team payroll))2 + … + ((salary of player n) / (team payroll))2,
where n = the number of players on a team’s roster
A team which paid all of the players on its 40-man roster equally would have an HHI value of 0.025 and a team which spent all of its money on one player and paid everyone else nothing would have an HHI of 1. Thus, higher values correspond to more concentrated payrolls. In practice, the HHI values of baseball teams between 2011 and 2022 ranged from 0.040 (the 2016 Cleveland Indians) to 0.131 (the 2016 Arizona Diamondbacks). The lack of star power on the 2016 Indians is reflected by the fact that their highest paid player, Carlos Santana, earned only $8.45 million (relative to a total payroll of $118 million). In contrast, the 2016 Diamondbacks paid Zack Greinke $34 million (relative to a total payroll of $104 million).
Plotting team winning percentage against HHI shows that there is a moderate negative correlation between the variables (correlation = -0.23): teams with more concentrated payrolls tend to have lower winning percentages.
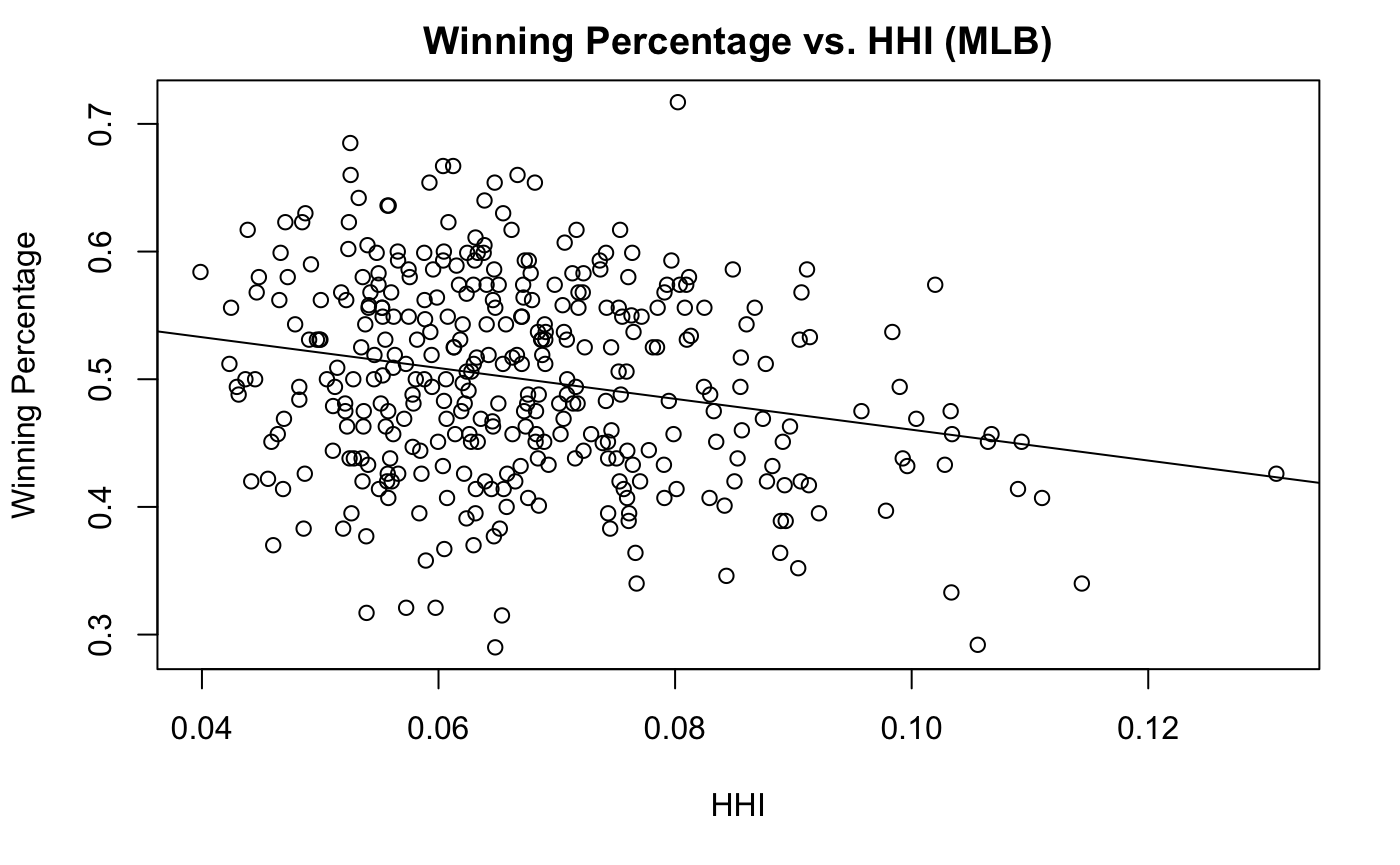
However, this result does not alone prove there is any causal relationship between HHI and winning percentage. If teams with higher relative salaries tend to have lower HHIs, then the fact that teams with lower HHIs perform better could just be picking up the effects of their higher payrolls. In practice, there is essentially 0 correlation between relative salary and HHI (correlation = positive 0.008). This means that holding budget constraints constant, teams with lower HHIs tend to have higher winning percentages. Holding relative salary constant, a team may be able to increase their winning percentage by 0.018 points (i.e., the difference between a 0.500 and 0.518 team) by decreasing their HHI by one standard deviation. Thus, teams on a budget might want to sit out of the bidding war for top free agents that has occurred in the 2022 offseason, and instead focus on signing some good lesser known names.
Results for NBA
The NBA also has significant variation in team salary. As with the MLB, teams with larger relative salaries tend to win more games.

In fact, using data from the 2011-2012 season through the 2021-2022 season, the correlation between relative salary and win percentage in the NBA (0.40) is slightly higher than the correlation in the MLB (.38), though the correlations are very similar. Using linear regression, we see that a team with a relative salary of 100 (payroll in year t = average payroll in year t) can be expected to have a win percentage of .500. A team with a relative salary of 110 however (payroll in year t is 10% more than average payroll in year t) can be expected to have a win percentage of .544 (roughly 2.6 more wins), an effect that is much more pronounced than in the MLB.
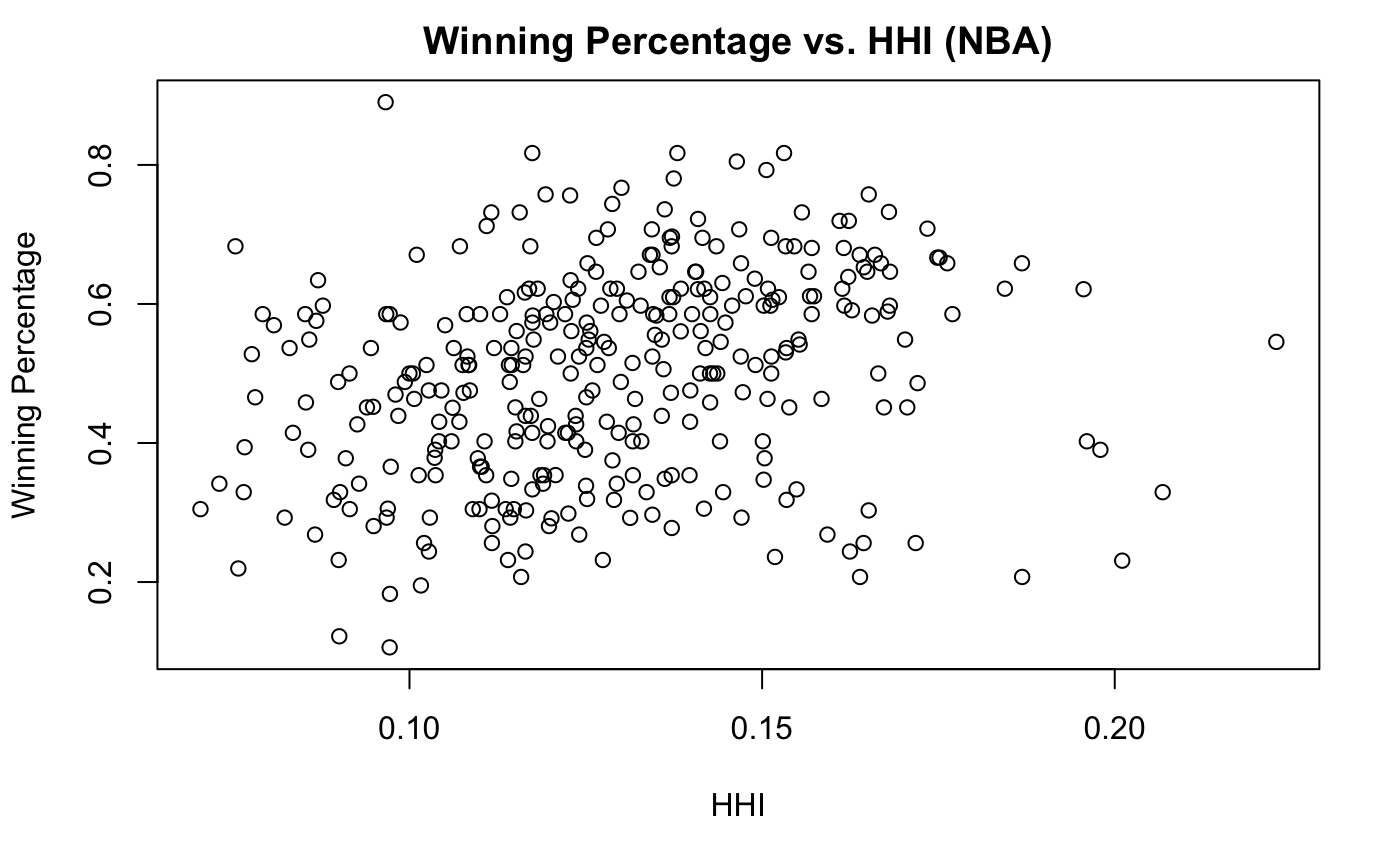
When investigating the effects of payroll concentration, the results become a little murkier. While it appears that higher HHI indexes somewhat correlate with team success, it appears that the teams with the highest HHI indexes tend to perform rather poorly.
NBA Teams with Highest HHI (2011-2022)
| Rank | Team | Year | HHI | Record |
| 1 | New York Knicks | 2011 | 0.2229119 | 36-30 |
| 2 | Los Angeles Lakers | 2013 | 0.2067974 | 27-55 |
| 3 | Golden State Warriors | 2019 | 0.2010619 | 15-50 |
| 4 | New York Knicks | 2015 | 0.1979621 | 32-50 |
| 5 | Los Angeles Lakers | 2021 | 0.1960481 | 33-49 |
| 6 | Los Angeles Lakers | 2011 | 0.1955831 | 41-25 |
| 7 | Los Angeles Lakers | 2015 | 0.1868694 | 17-65 |
| 8 | Houston Rockets | 2013 | 0.1868401 | 54-28 |
| 9 | Philadelphia 76ers | 2021 | 0.1844178 | 51-31 |
| 10 | Miami Heat | 2015 | 0.1769848 | 48-34 |
Looking at the ten top-heaviest teams in the last eleven NBA seasons, we see some repeat offenders. The Melo-era Knicks and Kobe-era Lakers show up multiple times, mostly in underwhelming seasons. We also have two entries from this very last season: the disastrous post-Westbrook Lakers and the underachieving post-Harden 76ers. It appears that having expensive stars on a roster does not guarantee success. Indeed, only half of the teams on the list even made the postseason, with none of them reaching the conference finals.
NBA Teams with Best Records (2011-2022)
| Rank | Team | Season | HHI | Record |
| 1 | Golden State Warriors | 2015 | 0.0966143 | 73-9 |
| 2 | Golden State Warriors | 2016 | 0.15310754 | 67-15 |
| 3 | San Antonio Spurs | 2015 | 0.1379832 | 67-15 |
| 4 | Golden State Warriors | 2014 | 0.11740981 | 67-15 |
| 5 | Miami Heat | 2012 | 0.14641458 | 66-16 |
| 6 | Houston Rockets | 2017 | 0.15060659 | 65-17 |
| 7 | Phoenix Suns | 2021 | 0.13746851 | 64-18 |
| 8 | Milwaukee Bucks | 2019 | 0.1300597 | 56-17 |
| 9 | San Antonio Spurs | 2011 | 0.16511739 | 50-16 |
| 10 | Chicago Bulls | 2011 | 0.11929939 | 50-16 |
The most successful teams instead seem to have employed a rather egalitarian pay structure. The 73-9 Warriors, the epitome of team success, actually have a low HHI, as their highest paid player was Klay Thompson, who ranked as the 31st highest paid player in the league. One has to scroll all the way to the 22nd ranked 2020 Phoenix Suns before finding a team that cracks the top 20 in HHI.
It is important to note that a high HHI index does not translate to a roster being a “superteam.”. While many of the teams with high HHI do indeed have lots of expensive stars on their rosters, it is also possible to achieve a high HHI with a low payroll and only a few players on large contracts. A recent example of this would be the 2021 Rockets, where John Wall accounted for a whopping 34.2% of the team payroll, which was the highest in the league last year and third highest in our dataset only behind the aforementioned Carmelo Anthony and Kobe Bryant. As the Rockets team as a whole only had a relative salary of 92.4, John Wall’s max contract was able to account for a ridiculously high portion of the team payroll. This resulted in the Rockets being fourth in the league last year in HHI. The Melo-era Knicks that frequent the top of the HHI charts would also fall under this category of low payroll combined with a few large contracts. However, these teams are generally rare.

Unlike the MLB, HHI positively correlates with relative salary in the NBA (correlation of 0.38). This is unsurprising when considering how NBA payrolls are structured. The NBA operates under a “soft cap,” where teams can only go over the salary cap to retain their own players. As a result, teams only typically go over the salary cap when they have a good core of players that they want to retain. The ensuing pay raises the players receive will naturally drive up the team’s HHI index. A prime example of this is the aforementioned 73-9 Warriors who had a very low HHI. After giving contract extensions to Steph Curry and Draymond Green, they now have one of the highest HHI indexes, as well as the highest payroll in the league.
In a multiple linear regression of winning percentage on both HHI and relative salary, HHI maintains a slight positive correlation with winning. A one standard deviation increase in HHI was statistically significantly associated with a 0.019 increase in winning percentage, holding relative salary constant. For a .500 team, this would mean moving from .500 to .519. At the very extreme high end of HHI, it seems that higher HHI is associated with winning fewer games. However, across the majority of HHI levels NBA teams actually have, higher HHI seems to be associated with a higher winning percentage, a contrast from the MLB.
This means that it is important for teams in the NBA to find a star(s) to build (and pay) around. Holding salary constant, it is still generally better for teams to concentrate their payroll into a few centerpieces rather than spread their resources between complementary pieces. In the modern NBA, GMs seem to agree with this take. Every year we see teams such as the Timberwolves with the Rudy Gobert trade, or the 76ers with the James Harden trade, push in all of their chips in the hopes of contending for a title. In the NBA, it appears that teams must go big or go home.
Conclusion
As expected, higher salaries are correlated with winning more games in both the MLB and NBA. The effect of concentration, however, does seem to differ between the leagues. In the MLB, higher concentration is associated with winning fewer games, holding payroll constant. This result may be no surprise. In the MLB, a star cannot carry a team. Note how Mike Trout, perhaps the best player of the last decade, has been on a team that has only made the playoffs once during his tenure. Teams that spend a lot on a star may be foregoing the ability to create a well-rounded team.
In contrast, higher concentration in NBA payroll does seem to confer a winning edge. The effect of a single superstar is much more pronounced in the NBA, where a player like LeBron James can single-handedly will his team to title contention. As such, the enormous shares of payroll that teams dedicate to superstars appears somewhat justified. In general, higher salary concentration is associated with winning more games in the NBA. Still, excessively high concentration seems to fare badly for the teams that have tried it.
So money does talk, but in different ways in different sports.
Data
We used all available years of salary data for both the MLB and NBA from Spotrac. For the MLB, we gathered Spotrac’s Adjusted Salary metric for every player on every team, ignoring deferred salaries (which at times reflected salaries paid to players long gone from a team), and salaries to players in the minor leagues (since players in the minor leagues cannot directly improve a Major League team). For the NBA, we gathered Spotrac’s Cap Figure measure for all players. We included the salaries of players granted amnesty (since we included the salary of released players for the MLB).
We gathered winning percentage data from Spotrac for the MLB and from Basketball Reference for the NBA.