When it comes to testing the APIs of our applications, we have lots of tools at our disposal. Most modern browsers have built-in tools for web applications to inspect any network requests made on any given page. Dedicated network inspecting applications such as Fiddler and Proxyman let you track specific traffic in your operating system. There are even some highly advanced tools like Wireshark and tcpdump that can let anyone take a peek at the insides of network traffic in any environment.
Most of these tools work well, but they also have their limitations. For instance, you may have the ability to view some details from your traffic, but it's a pain to filter, keep track, and collect this data when finished. Some other places where you might need to inspect network traffic, like a mobile application or Docker container, aren't a straightforward process. Depending on your use case, you might have difficulty gathering the information you need while testing and debugging applications that make and receive requests from different services across the Internet.
Recently, I stumbled upon a tool called HTTP Toolkit that can help with all of these drawbacks. HTTP Toolkit is an open-source application that gives you the ability to handle most of your HTTP traffic inspection, and it's an ideal way to manage your API requests in a single place. This article will go through the basics of using HTTP Toolkit and explore how it can help you debug and test your APIs. If you have to manage any APIs, mainly through a web application, keep reading.
What does HTTP Toolkit provide?
HTTP Toolkit is a standalone application that works on all major operating systems (Windows, macOS, and Linux) that you can use to gather any HTTP traffic going out from different sources in your system. There's a free, open-source version of HTTP Toolkit with lots of useful functionality, along with a Pro subscription which adds even more features into the mix. We'll explore the free version for this article to give you an idea of what the application can do for you.
When starting up the app for the first time, it greets you with multiple options to get started collecting network traffic, like launching different browsers, terminal windows, and a lot more. Depending on your operating system, you'll have access to use the various browsers and services you have installed. Compared to other similar applications and built-in tools for inspecting these kinds of network requests, having all these choices out of the box is where HTTP Toolkit shines the most, in my opinion.
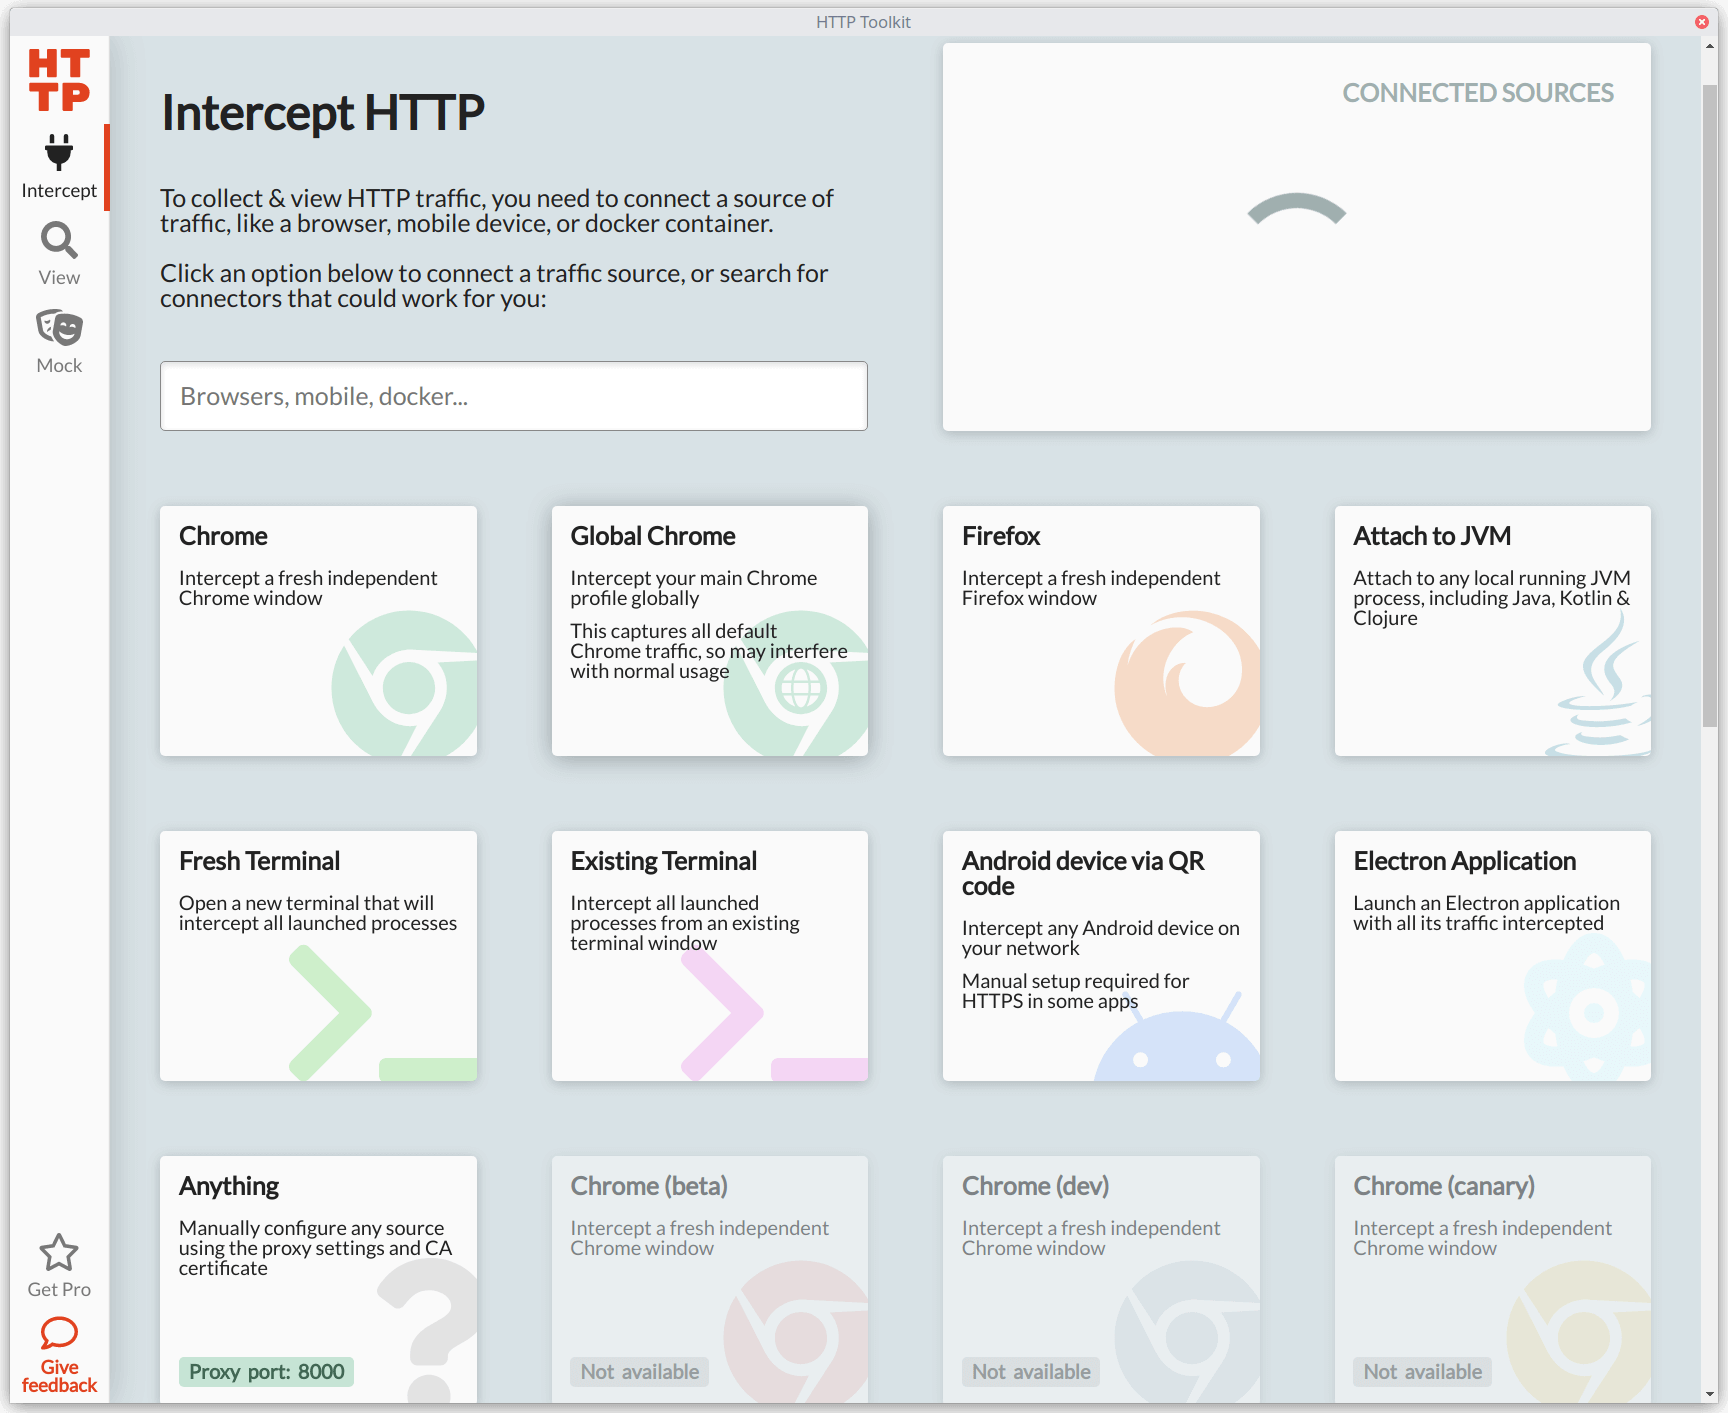
Even better than having multiple options to collect HTTP traffic is how dead-simple it is to begin accumulating valuable data from your applications and services. You don't have to configure anything for web browsers — just click on one of the provided options, and HTTP Toolkit will launch or restart an instance of the browser and immediately start gathering any HTTP requests and responses. For other options, some configuration is necessary, but it's often a straightforward process. If you're using an application or service not supported out of the box, it allows you to spin up a proxy server to route any traffic to HTTP Toolkit.
Once you begin inspecting traffic, HTTP Toolkit will collect every single HTTP request and response made from the apps and services you're tracking with the app. It displays helpful information such as the HTTP method (GET, POST, etc.), the response status codes, the host where the request went to, and the URL path. From there, you can filter the requests or get a detailed view of any specific item and see almost every detail for the request and response. This information is invaluable when debugging apps or services connected to the Internet.
In addition to intercepting and viewing the traffic coming in and out from your apps, HTTP Toolkit also allows you to set rules to match specific requests or responses and pause them. You can view and modify the headers and body for the request or response while paused. If you change anything from the request or response, you can resume the process, and HTTP Toolkit will send your application or service the original network call along with your modifications. It's a great way to experiment and test without diving into the codebase or the underlying app or service.
Now that you have a high-level overview of HTTP Toolkit, let's put it to use to see how it can work for a web application.
Using HTTP Toolkit to intercept traffic from a web application
For this example, we'll use a simple web application I built called Cash Conversion to see how HTTP Toolkit can intercept and help us modify any requests or responses made on the web page.
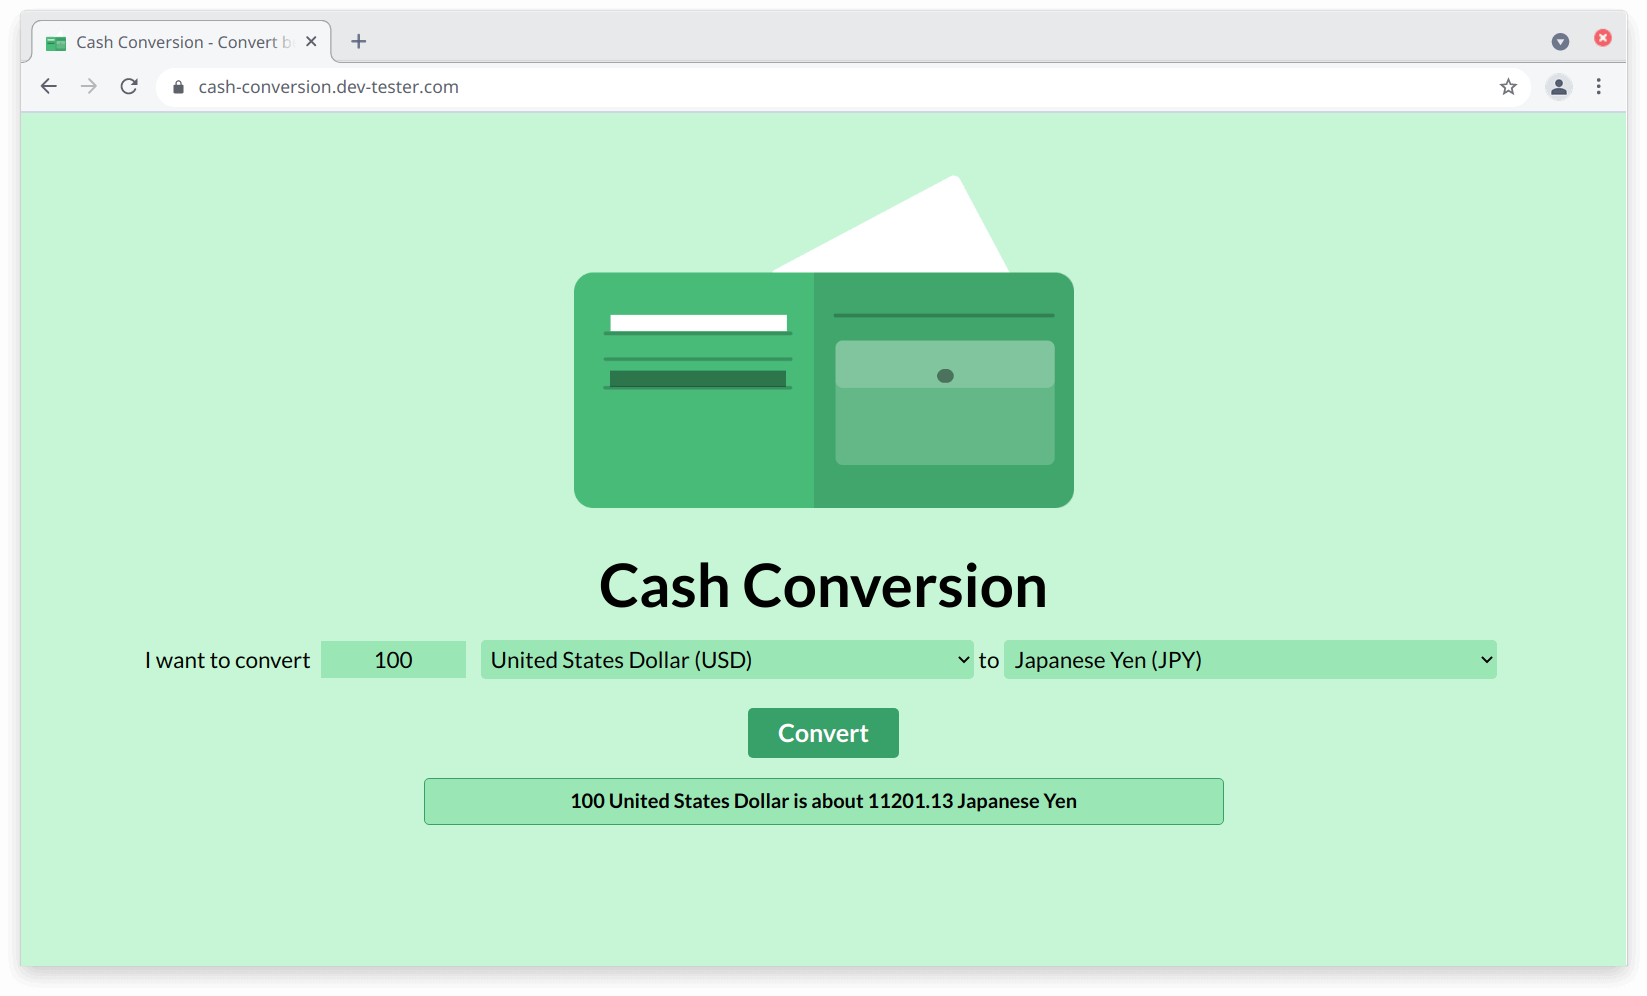
The Cash Conversion application has a single function — converting an amount between two currencies. You enter the amount you'd like to convert, select the currencies you'd like to use for conversion, and click on the "Convert" button. The web page sends an API request to a backend server, which handles the calculation and returns a JSON response. The web page will use this response to display the conversion.
Since the Cash Conversion app makes requests and receives responses through HTTP, we can use HTTP Toolkit to get a glimpse at what's happening in the conversion process between the page and the server. Let's open HTTP Toolkit and launch a fresh instance of Google Chrome to begin intercepting HTTP requests. HTTP Toolkit will open a new browser window and display the "View" section, where you'll start seeing all the HTTP traffic flowing through the new instance of Chrome.
In the new browser window, we can load the Cash Conversion app and make a conversion to capture the details. For almost all web browsers, you'll probably see a ton of HTTP requests made from the moment you launch it using HTTP Toolkit. These requests come from the browser itself, like checking for the latest updates and the address bar auto-complete functionality. We'll also see requests from any assets loaded from the Cash Conversion web page itself, like images and JavaScript files. We won't need these, so let's filter them out using the text field at the bottom of the "View" section and entering the HTTP API host (cash-conversion-api.dev-tester.com):
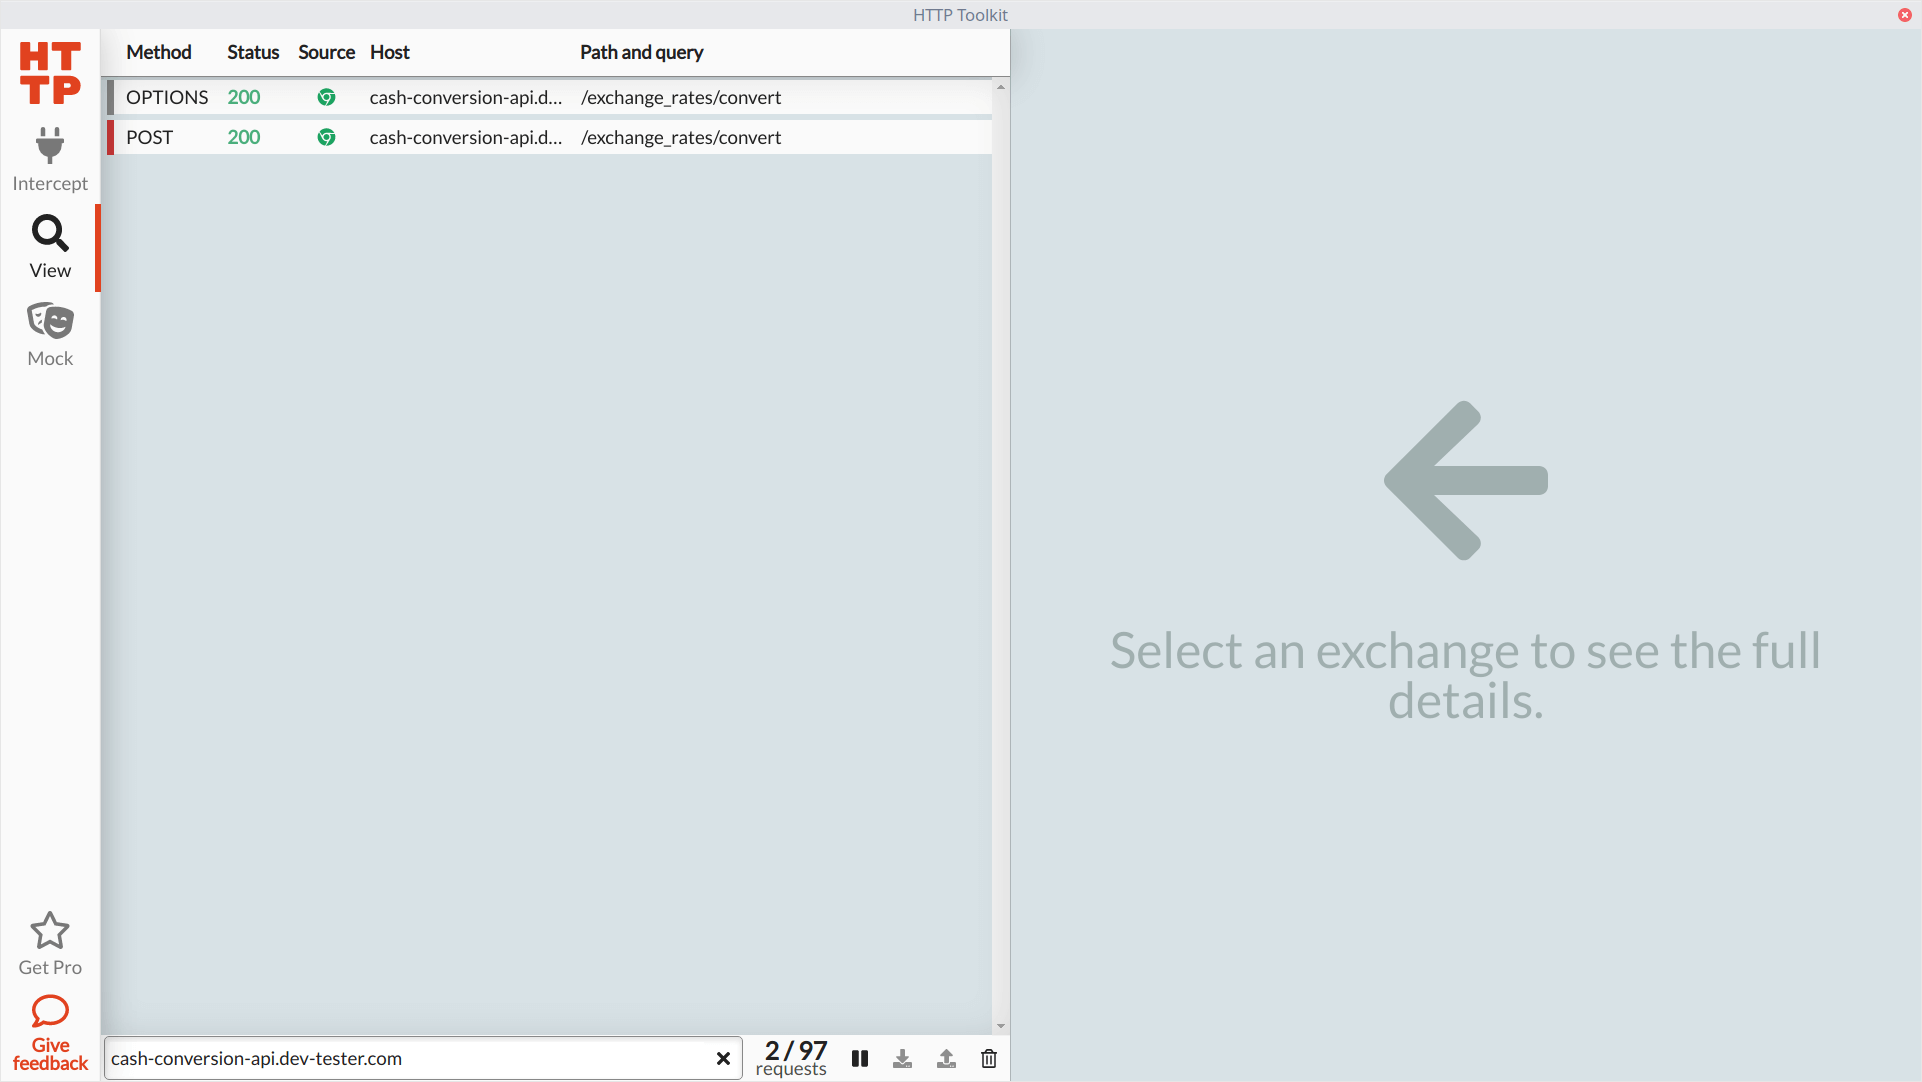
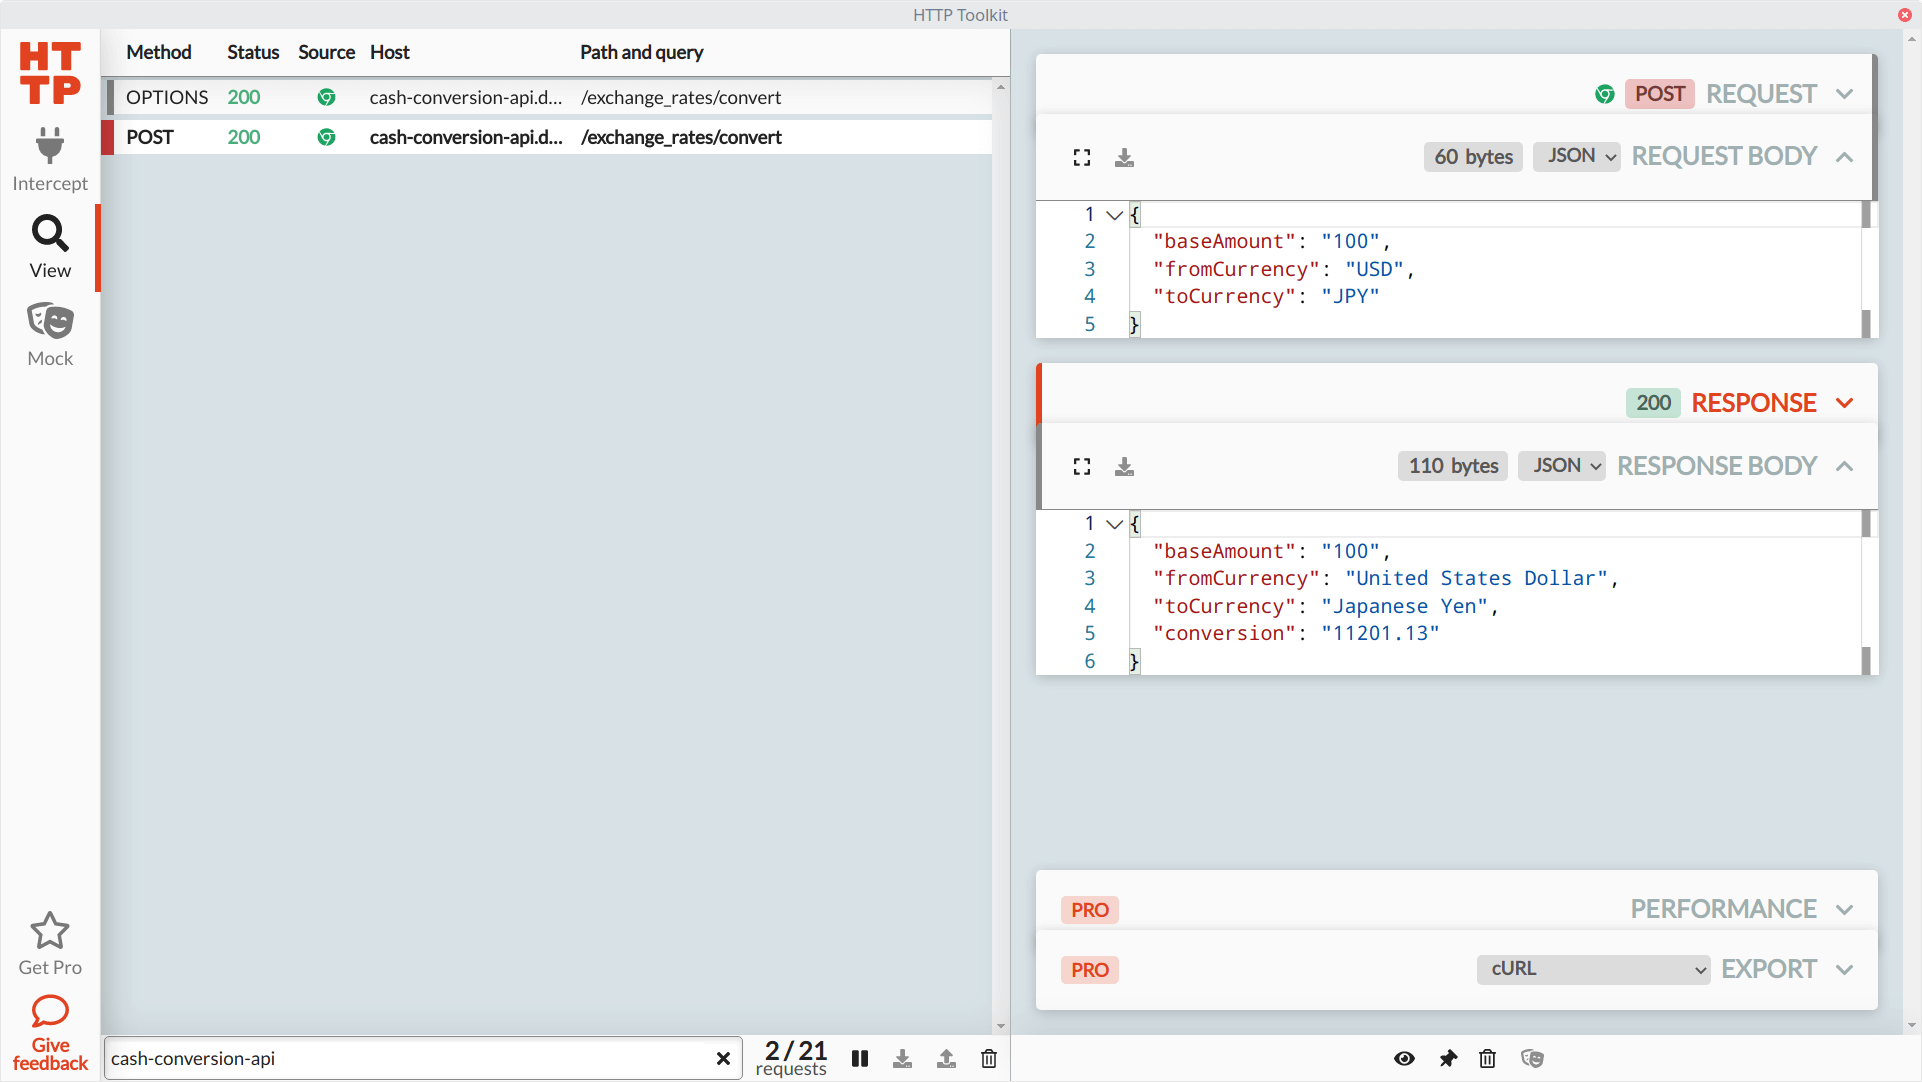
We can see our POST request made to the API (as well as an OPTIONS request, which is a CORS preflight request, so we can safely ignore it). Clicking on the request in HTTP Toolkit opens up the detailed view. Here, we can see the headers sent to the Cash Conversion backend through the API, the request body, and the complete response headers and body. This information gives us the data expected by the backend service from the web page, so now we know what's needed to test our API.
HTTP Toolkit will continue collecting any HTTP traffic made in its launched browser window. For larger web applications spanning multiple browser windows and services, it's an excellent way to gather everything during manual and exploratory testing without losing track of the requests made and responses received along the way.
Using HTTP Toolkit to mock HTTP requests and responses
Collecting all these requests and responses from our web application is nice to have in a single place. However, we can do more with HTTP Toolkit than only intercept and gather HTTP traffic. We can also set rules to pause any network call to our applications or services before sending a response or receiving a request. HTTP Toolkit then allows us to inspect and modify the headers and body, then send it with our changes. This functionality works like a breakpoint when writing code, but we don't need access to any source code to make this happen.
HTTP Toolkit makes this intercepting and mocking easy through the "Mock" section. This section allows you to set any rules for handling different kinds of captured HTTP traffic. You can create a rule by selecting the HTTP method you want to monitor, filter those requests, and choose what you want to do next. In the free version of HTTP Toolkit, you can pause traffic before making a request to an application or service, after receiving a response, or both.
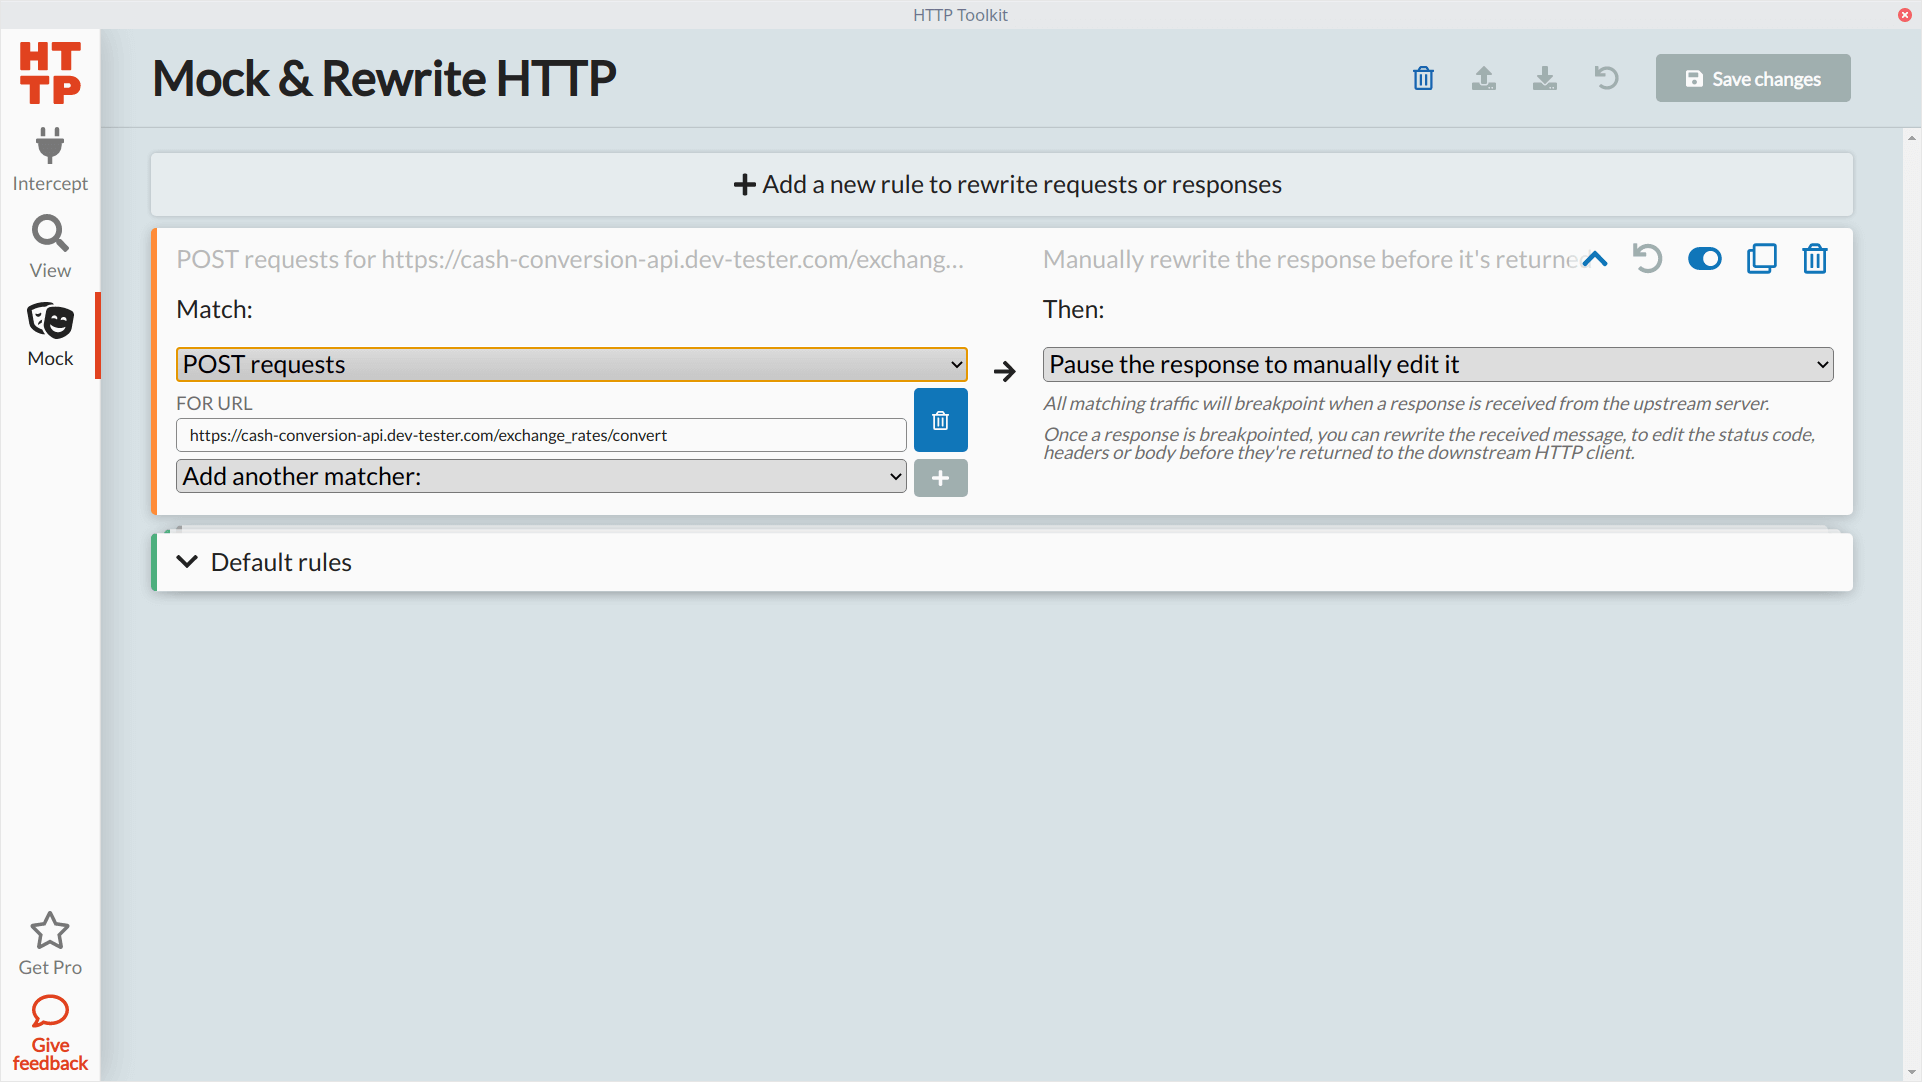
To show how rules work, let's set up a rule that will capture our POST request when converting currency on the Cash Conversion app, modify its response body, and see how the application responds. The rule will look like this in the "Mock" section of HTTP Toolkit:
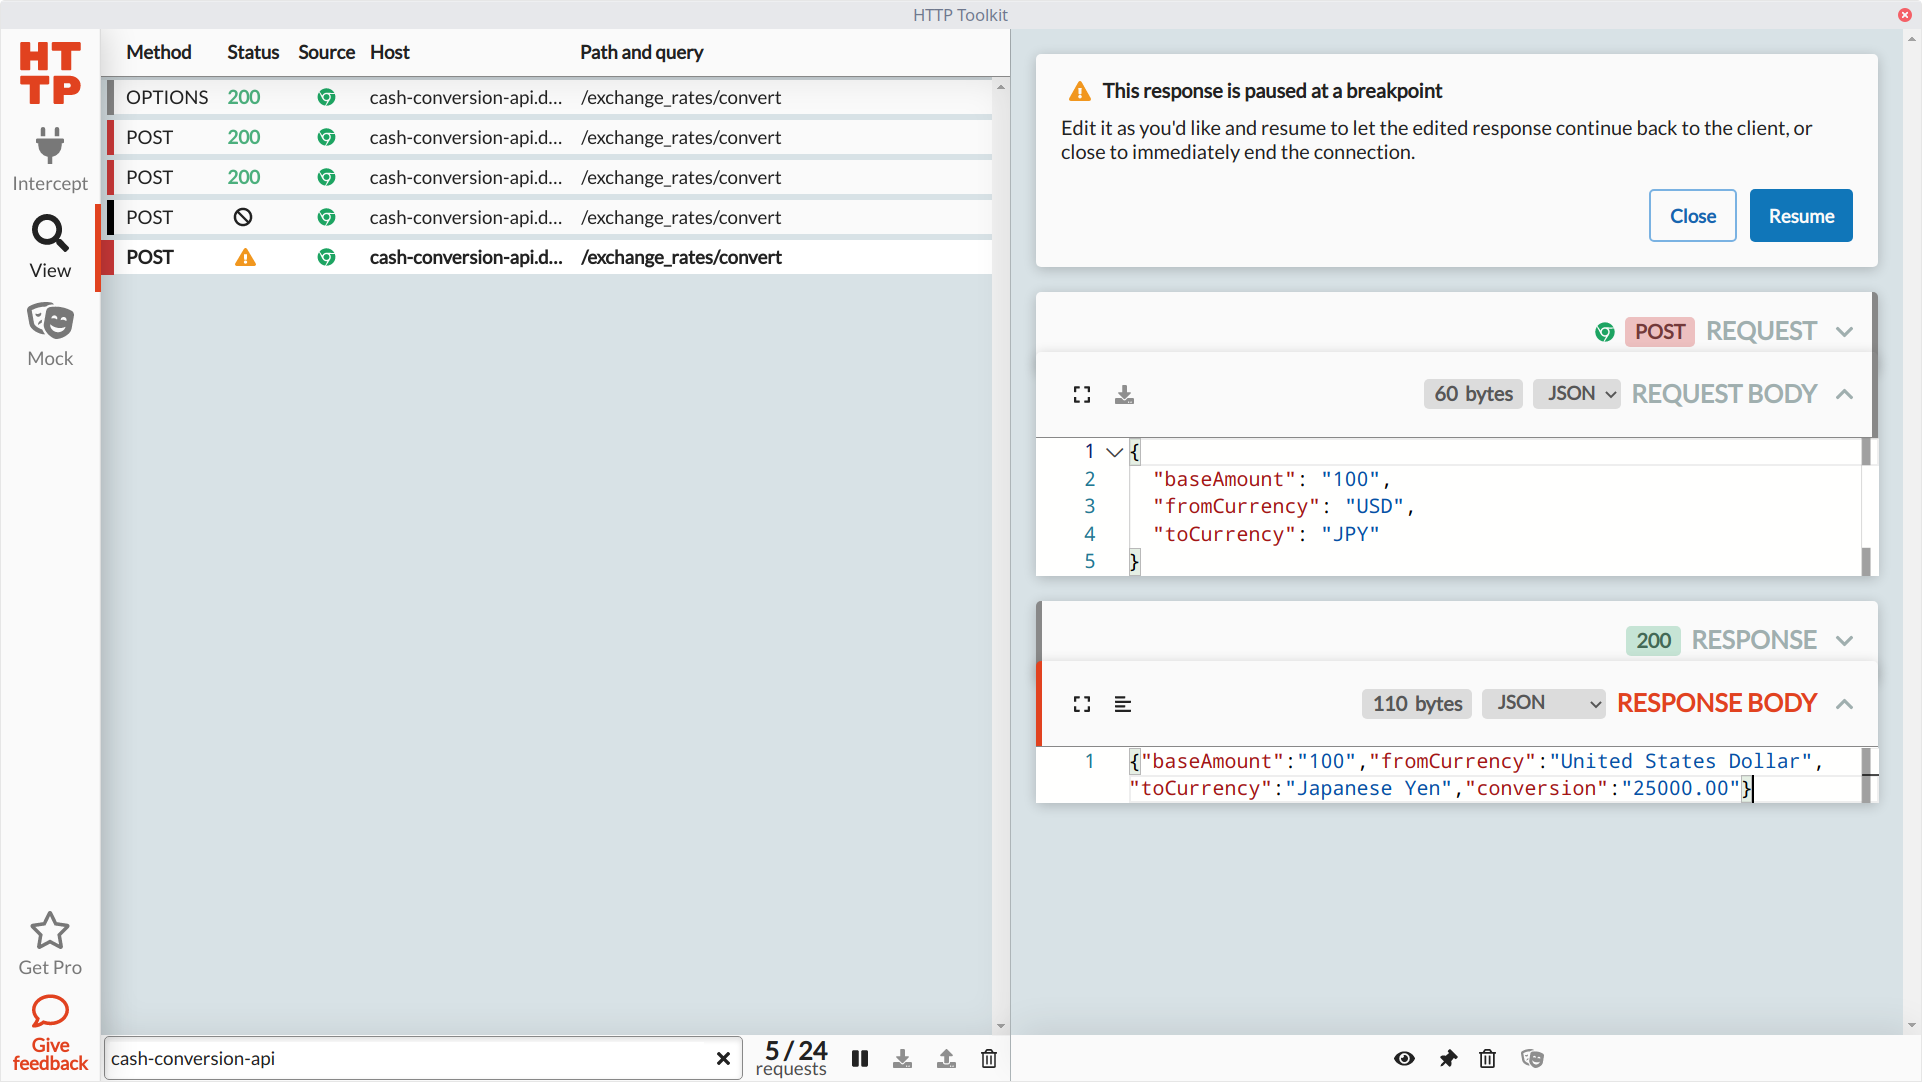
Let's go back to the Chrome browser instance set up to capture our HTTP traffic and make the same request shown earlier. In the previous unmocked request, we sent data to show the conversion of 100 U.S. Dollars to Japanese Yen, which the API calculated to 11201.13 Japanese Yen. We'll make the same request to the API, and when HTTP Toolkit pauses the response, let's modify the response body to return a different conversion amount in the conversion attribute:
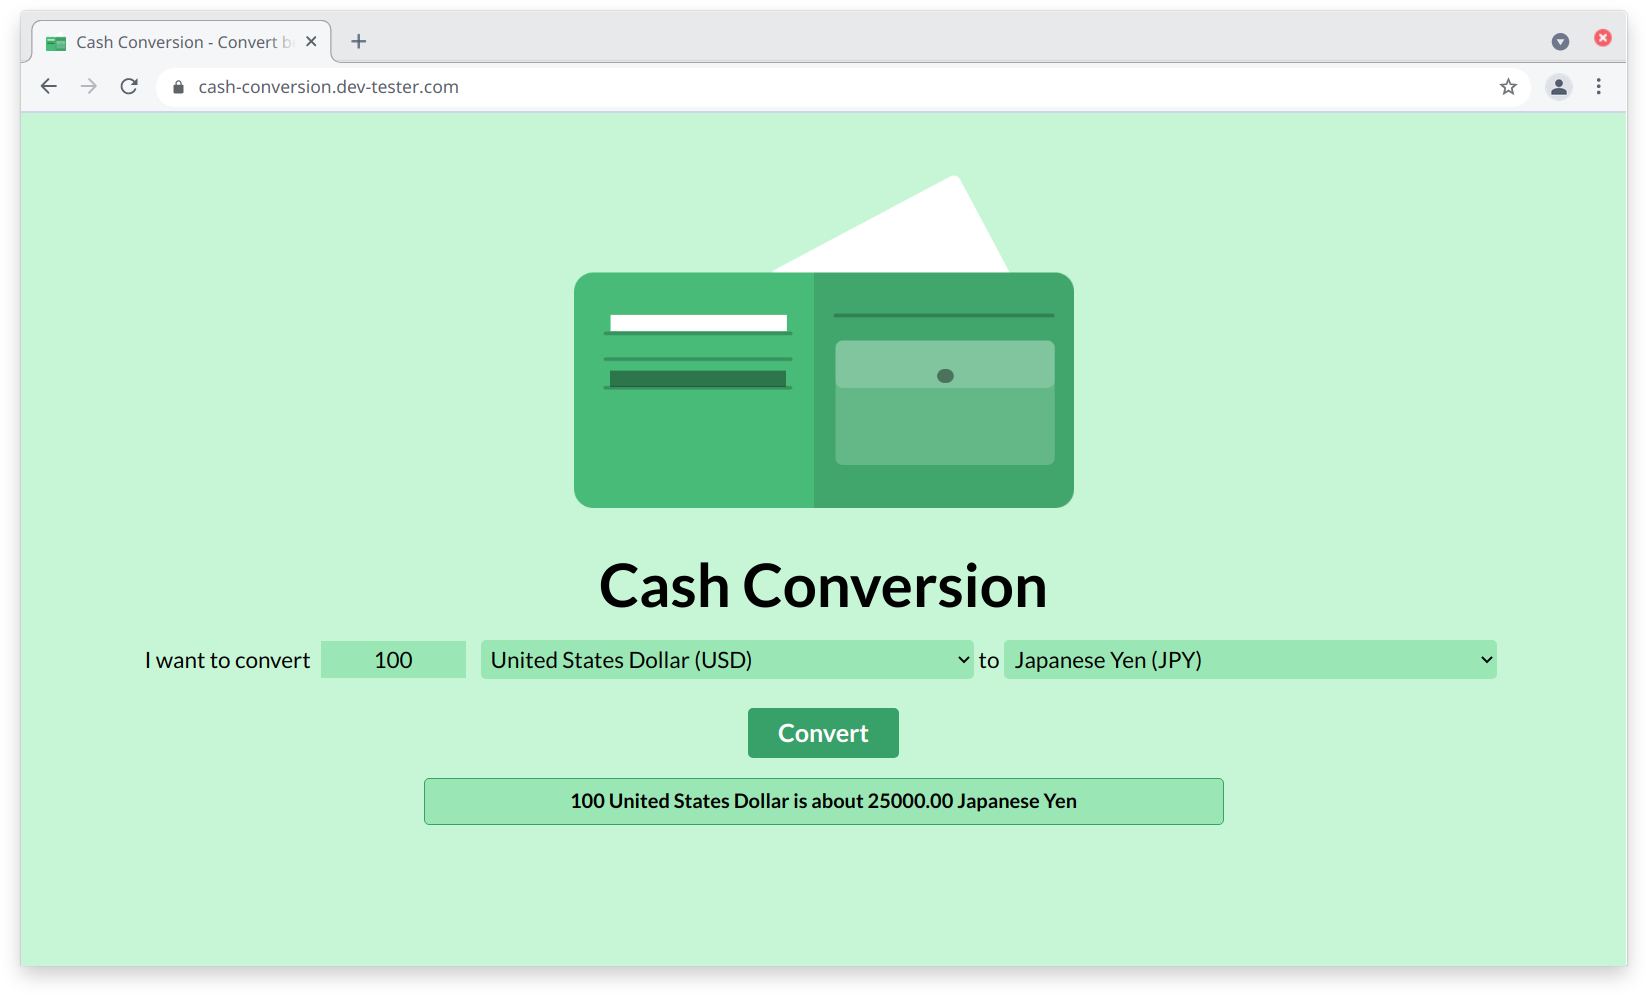
With the response modified, we can resume the process with our updated payload, which the browser receives to display on the page:
Now that you know how mocking works in HTTP Toolkit, let's go further to check the resiliency of our web application by intercepting the request or response and seeing how the API or web page reacts. Using a tool like HTTP Toolkit for this purpose can help testers find plenty of bugs and potential security exploits that developers and testers may overlook.
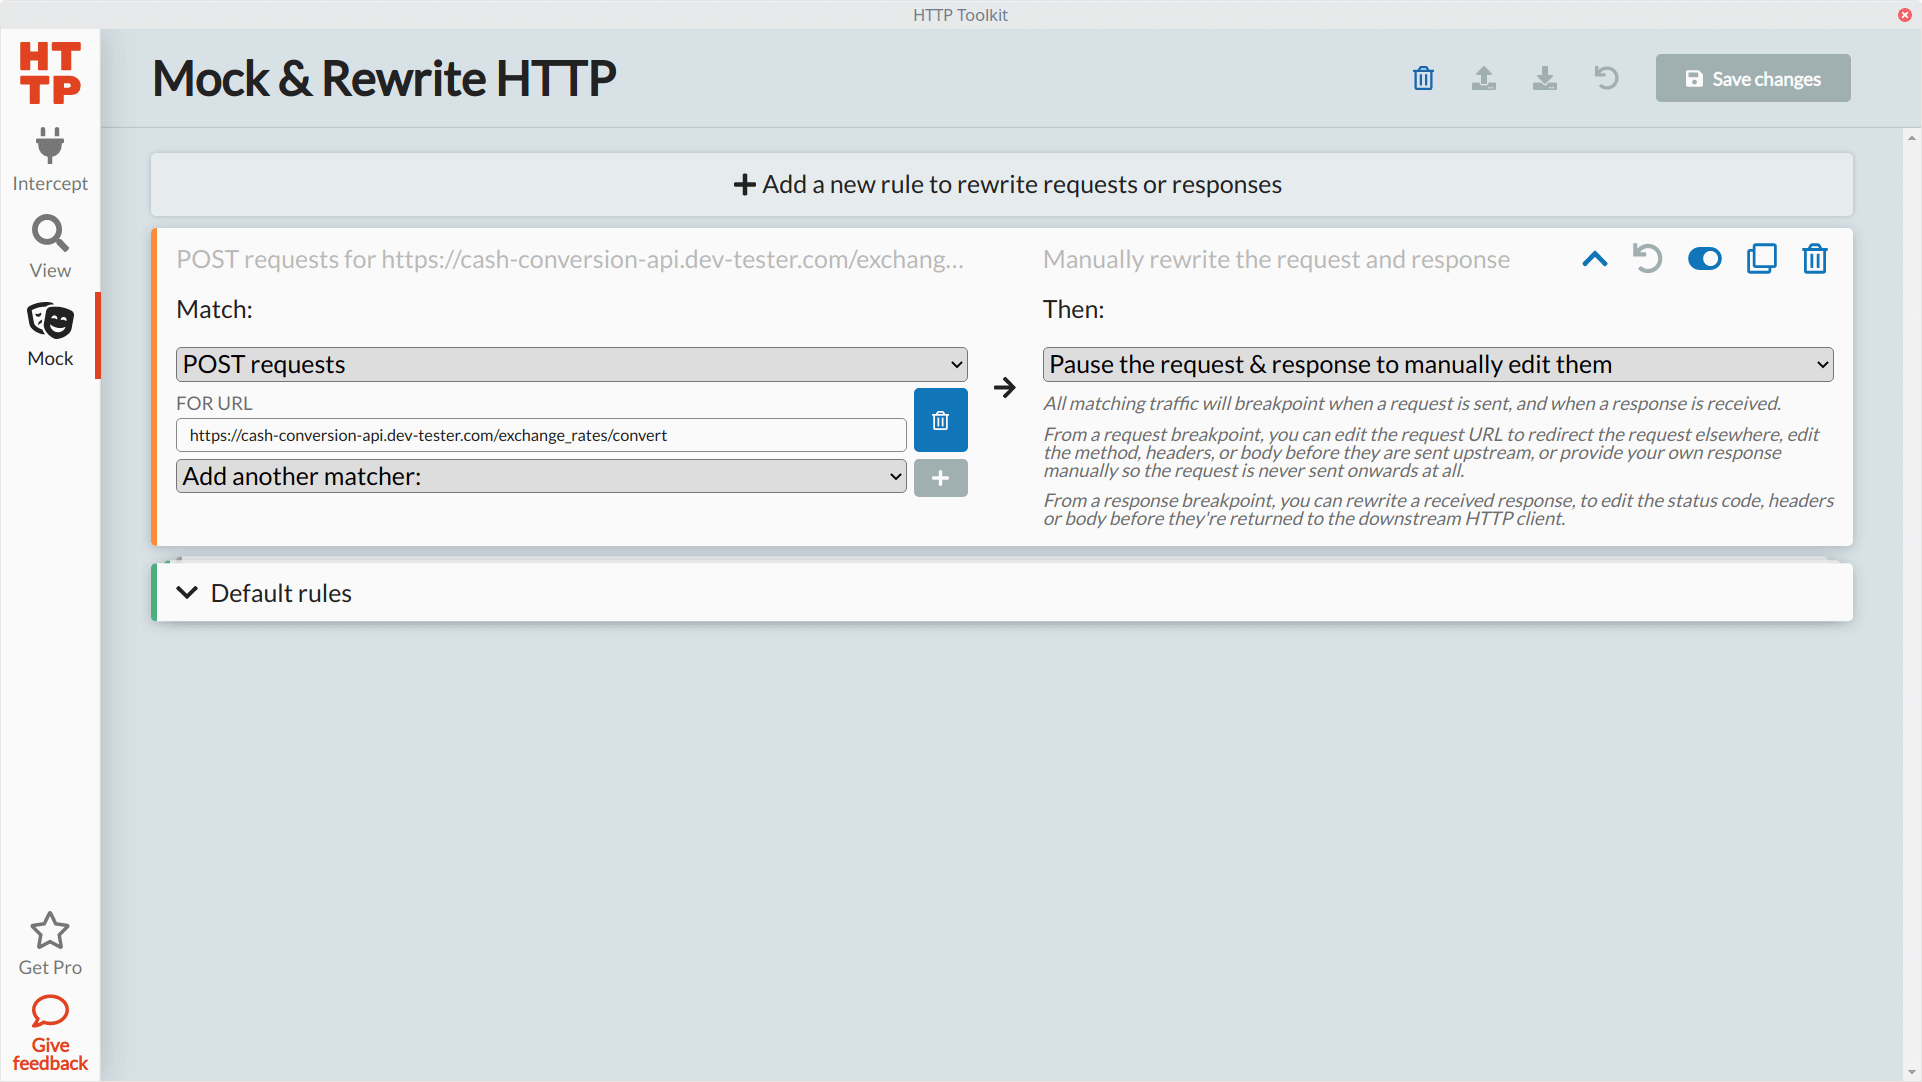
Let's modify our existing rule to pause the POST action to both when sending the request and receiving the response:
For our first experiment, let's send some invalid data when making a request to the conversion API endpoint. We'll make the same request, and this time HTTP Toolkit halts execution before sending the request to the API server. Let's remove the baseAmount attribute altogether and send invalid currency values in the fromCurrency and toCurrency attributes:
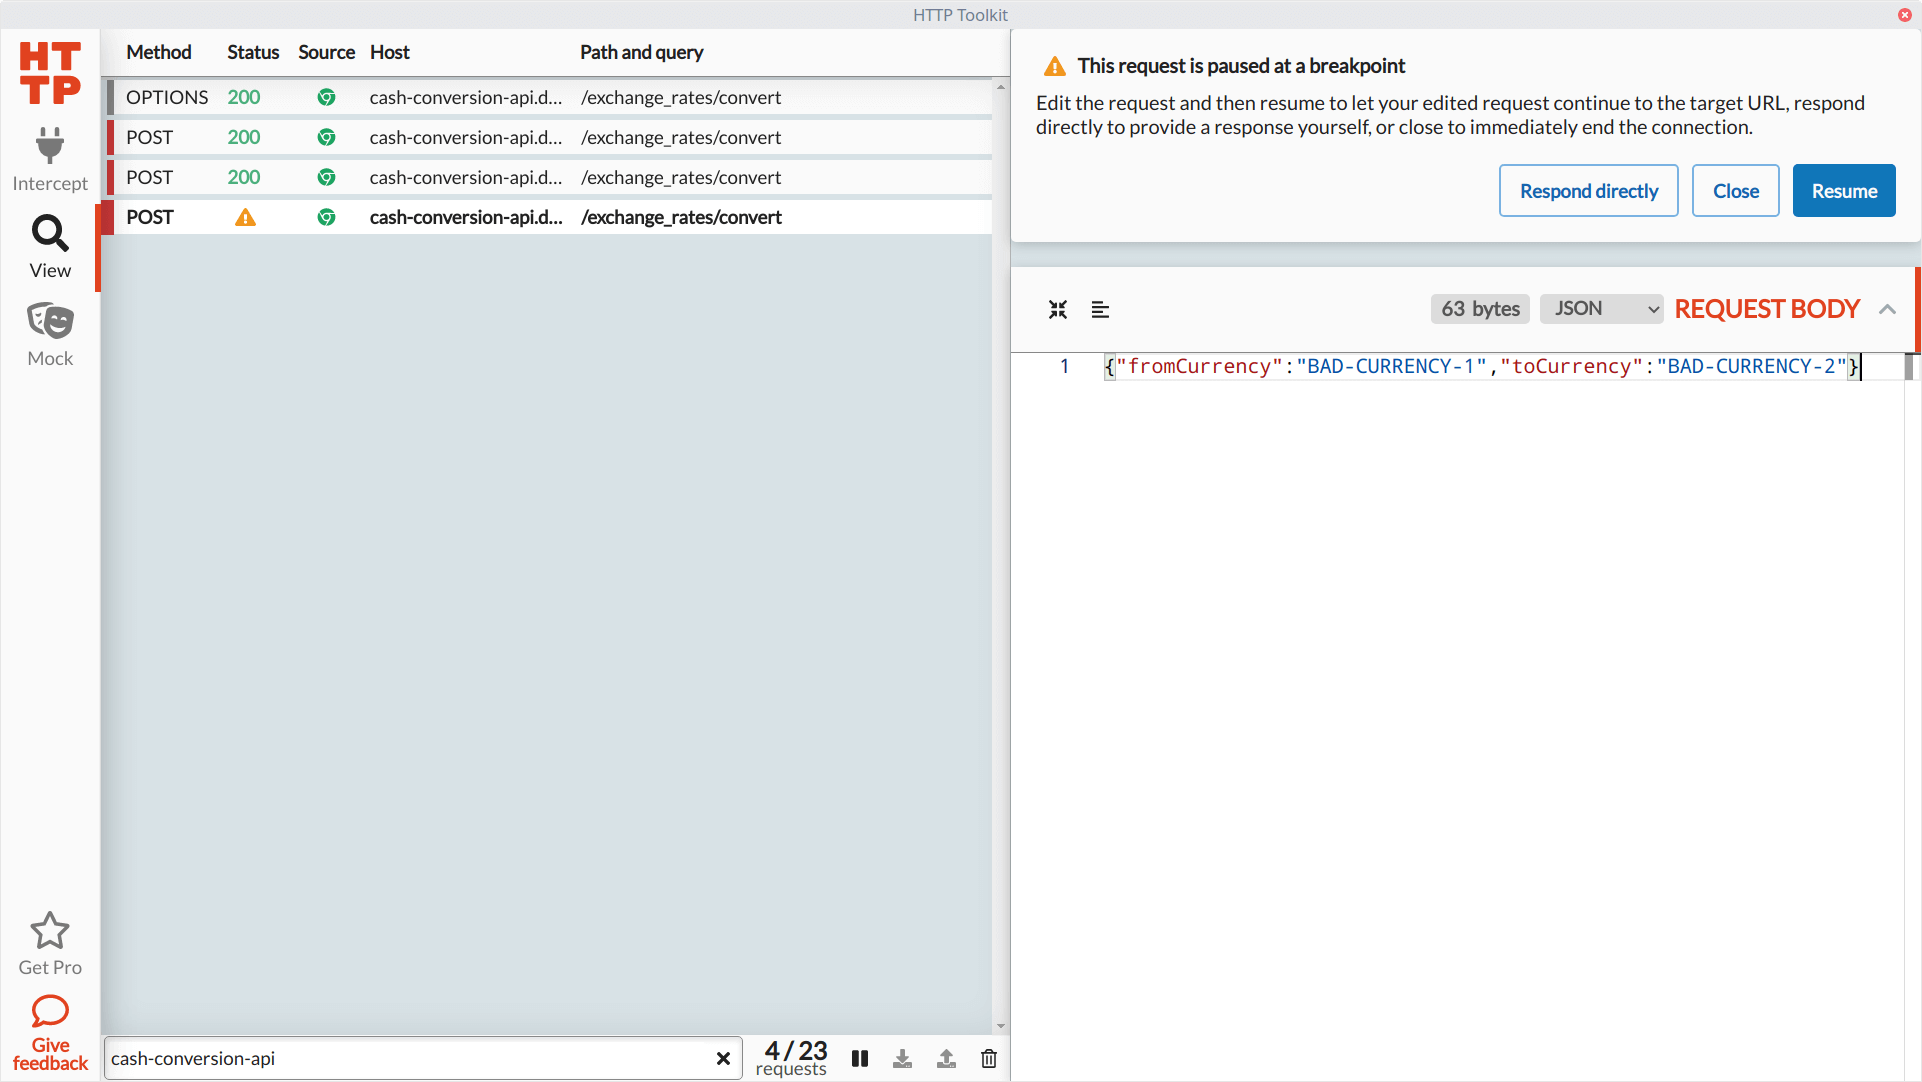
We'll resume operations so HTTP Toolkit can send our modified request body to the API. It'll pause once again when the API server sends back its response. We won't do anything with the response for now, so we can resume without any changes. Let's see what happened on the web page:
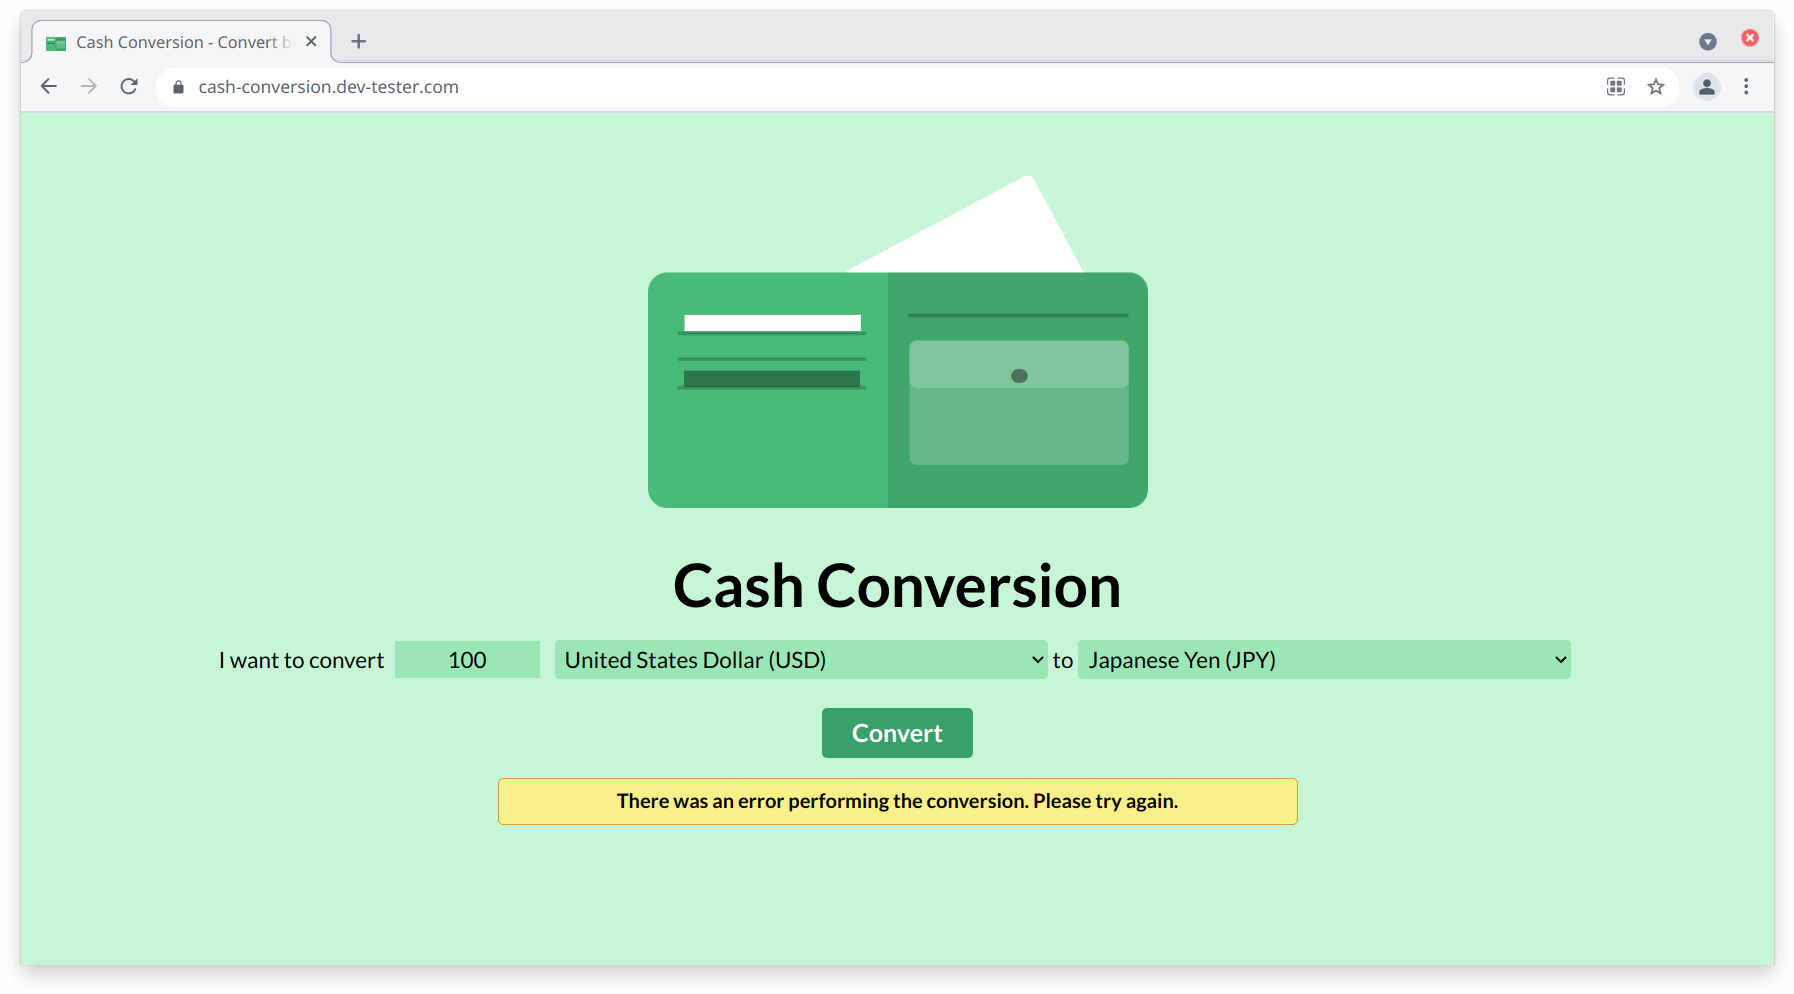
Our API responds with a 422 Unprocessable Entity response using the invalid parameters, and the web page shows a generic error message. As a tester, it's a good result to see because it demonstrates that our web application gracefully handles these kinds of errors without breaking the page or the underlying server.
Now let's see how the web page handles potential exploits coming from the HTTP response. This time, we'll do something a little more sinister, like injecting some client-side code to see if the browser executes it. This kind of testing can help you detect vulnerable areas of your web applications, such as Cross Site Scripting.
Once again, we'll make our conversion request to the API on the browser to trigger the interception of traffic. We won't modify the request, so we can let it slide through to the backend. When the server sends back data, HTTP Toolkit allows us to make our modifications to the response. This time we'll replace the entire body and replace it with some JavaScript code. Then we'll resume the process to let HTTP Toolkit send over our potentially harmful code and see what happens.
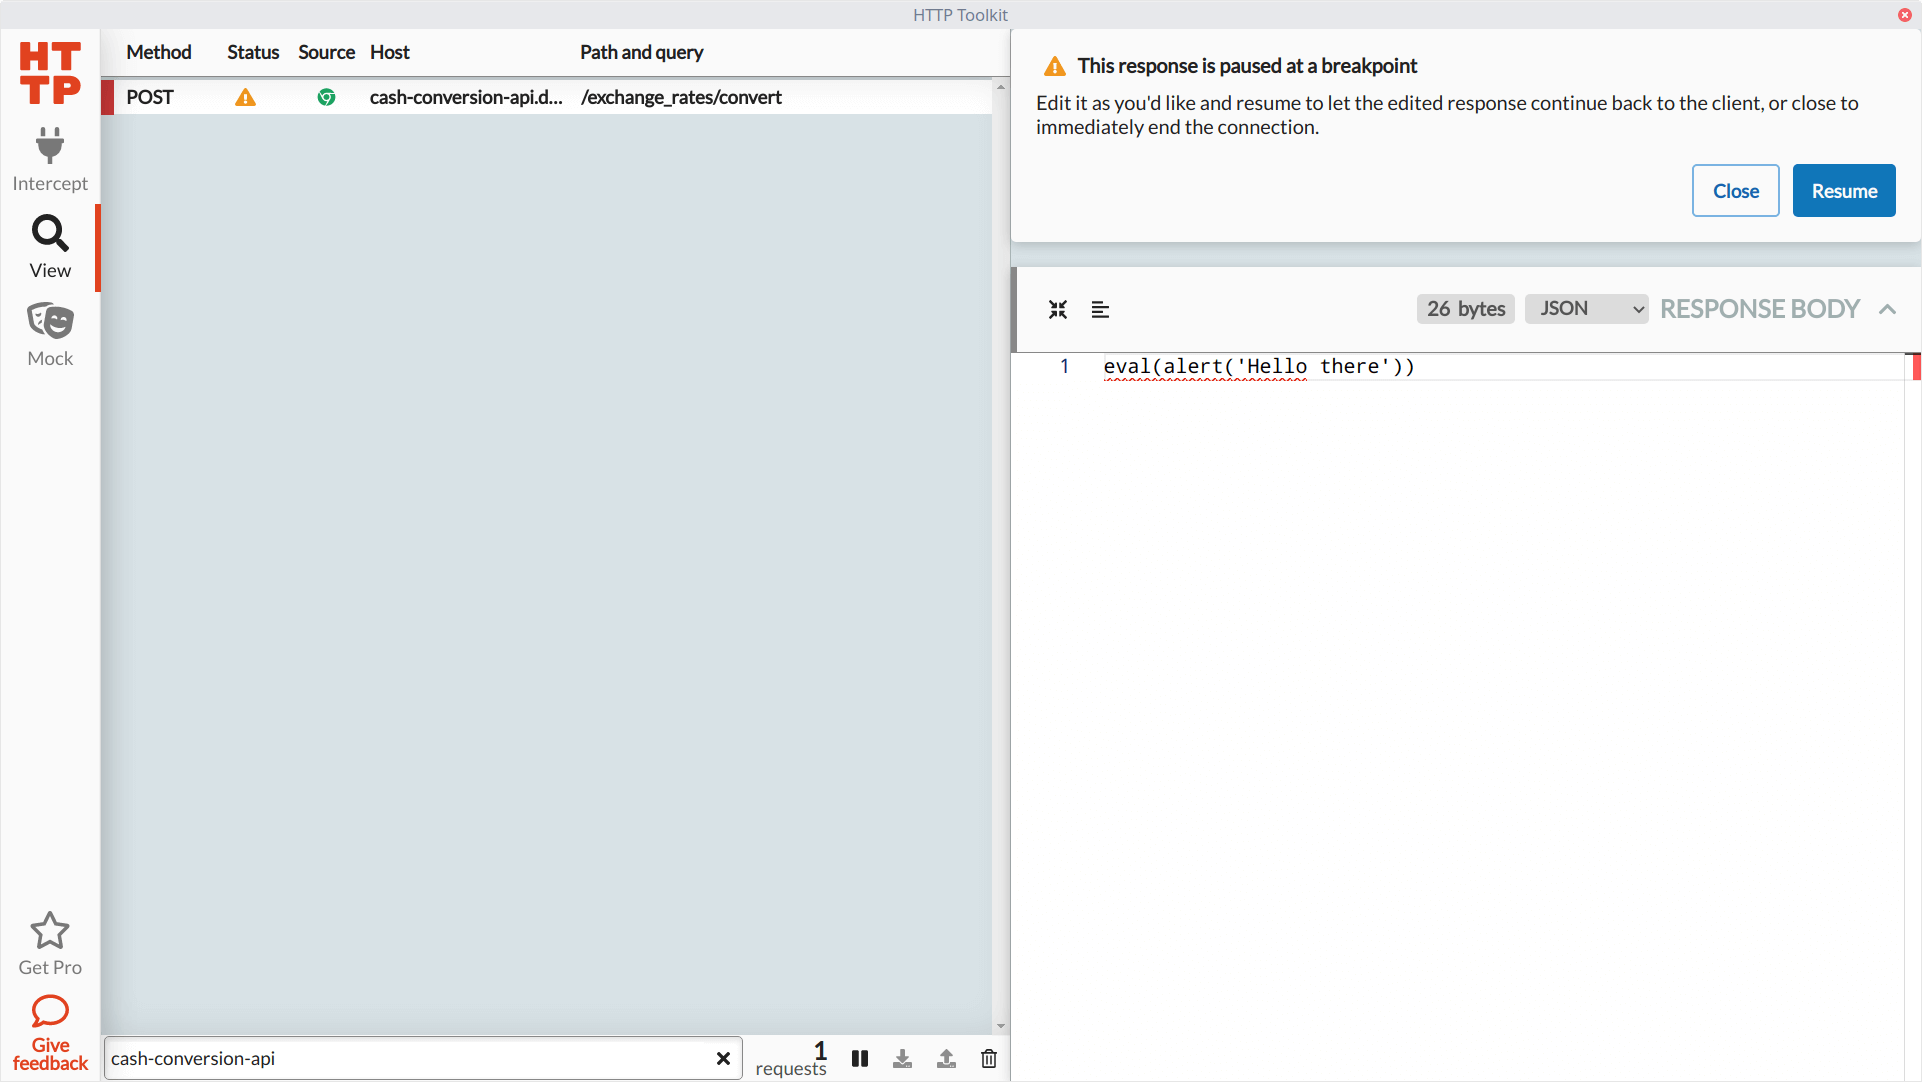
Thankfully, since the request expects a JSON response (where the Content-Type header of the response is application/json), it won't attempt to run the JavaScript code and instead raise the same error message as we saw before. These simple exploratory tests can alert the team of potential trouble, especially in web applications that store and retrieve user-generated content.
Summary
This overview of HTTP Toolkit barely scratches the surface of what it can do for you. We did a handful of things with a simple web application, but the real power of HTTP Toolkit comes from its extensive support for capturing HTTP traffic. You're not limited to just web browsers. It can also help you quickly collect data from Android devices and Electron applications, with more coming down the road. You can also spin up a proxy server to route any HTTP traffic.
The Pro version of HTTP Toolkit goes beyond intercepting and mocking HTTP requests, adding tons of extra functionality. For instance, it can send pre-defined responses from a file, automatically modify requests or responses without manual intervention, or you can re-route your requests to another host. For testing the resiliency of your applications, it also gives you additional options like simulating timeouts or force-closing connections.
These days, almost every app, API, or device connects somewhere on the Internet, typically through HTTP. If you're a tester or developer who has to check these kinds of applications or services, HTTP Toolkit is a valuable tool to have around. It'll make gathering information and manipulating it much easier, especially if you don't have direct access to modify these systems. Consider it for your next testing or development project to see how it can make your life easier.
How do you typically inspect and test APIs without having access to the system's internals (e.g., black-box testing)?