

Jump to Section
- Intro to Threat Modeling
- Methodologies
- Future Methodologies
- Auxiliary Tools
- Modeling Exercise(s) coming soon!
- Conclusion
- Appendices
- References
Intro to Threat Modeling
Threat Modeling can be defined as the process of building and analyzing representations of a system to highlight concerns about security characteristics. 1
Threat Modeling is a pro-active and iterative approach for identifying security issues and reducing risk. The output of a threat modeling exercise is a list of threats - or even better - risks, that further inform decisions in the progressive lifecycle of a system. This process can be performed prior to any code written or infrastructure deployed. This makes it very efficient in identifying potential threats, vulnerabilities and risks.
Simplified Threat Modeling
There is a multitude of threat modeling methodologies, each of which have both individual uniqueness as well as mutual commonalities (Comparison Matrix). Fundamentally, each of these frameworks share the following two properties.
Document Scope : Scope the to-be-modeled system by inventorying the component architecture and diagramming the composite entities + the data flows that connect them. This should yield a list of identifiable assets & components, commonly visualized as a data flow diagram (DFD).
Enumerate Threats : Leveraging what we know about the system (i.e. list of technology components, applicable security controls, knowledge of threat actors, potential vulnerabilities), generate a list of potential threats.
The Threat Modeling Manifesto
The steps above represent an extreme distillation of the variety of threat modeling methodologies that exist today. The esteemed Threat Modeling Manifesto provides another example of a generic threat modeling process. This manifesto was created by a collective of threat modeling, security and privacy professionals. The steps they espouse are enumerated below. 1
- What are we working on?
- What can go wrong?
- What are we going to do about it?
- Did we do a good enough job?
What’s peculiar about the Threat Modeling Manifesto is the delta between their definition of threat modeling and the stated “four key questions” of threat modeling. To explain, they define threat modeling as…
“Threat modeling is analyzing representations of a system to highlight concerns about security and privacy characteristics.”
Whereas within their 4-step question set they also include the act of developing risk treatments (“What are we going to do about it”), as well as following up on the efficacy of those applied countermeasures (“Did we do a good enough job”). My point being, that they are a little inconsistent between how they define threat modeling and the steps taken to perform a threat model. Maybe I’m just being a bit nit-picky though…
* In the past, I always considered “Threat Modeling” in the purest sense to be limited to just questions 1 & 2 from the Manifesto, or strictly, just the acts of documenting the system (inventorying components + DFD) and generating the threats. Now however, I realize that the prescription of security controls and subsequent re-factoring of threat risks is as applicable in the context of threat modeling as anything else. 26
Benefits and Characteristics of Threat Modeling
Rather than me regurgitate a bunch of benefits of threat modeling, instead peruse this great Synopsys compilation of threat modeling advantages. 2
- Detect problems early in the software development life cycle (SDLC)—even before coding begins.
- Spot design flaws that traditional testing methods and code reviews may overlook.
- Evaluate new forms of attack that you might not otherwise consider.
- Maximize testing budgets by helping target testing and code review.
- Identify security requirements.
- Remediate problems before software release and prevent costly recoding post-deployment.
- Think about threats beyond standard attacks and identify security issues unique to your application.
- Keep frameworks ahead of the internal and external attackers relevant to your applications.
- Highlight assets, threat agents, and controls to deduce components that attackers will target.
- Model the location of threat agents, motivations, skills, and capabilities to locate potential attackers in relation to the system architecture.
So what makes a threat modeling methodology a good one? Consider now the following list of desirable traits and considerations. 25
- No (or low) false positives
- No threat blind spots
- Consistency, regardless of who performs the threat modeling exercise
- Cost, time and resource-effective
- Has tool support which helps scale and automate the various threat modeling activities
- Suggests a process for prioritizing findings
- Is easy / intutitive to learn and use, regardless of technical background
- Has superior characteristics for specific types of systems and situations
Methodologies
This section will detail several (13) well-known (and not so well-known) threat modeling methodologies. They are presented in no real particular order, though I will say that the first half of the list does contain a higher concentration of the more popular models. There are also methodologies I plan to cover in the future listed here.
- Microsoft Threat Modeling
- PASTA
- OCTAVE
- Trike
- LINDDUN
- VAST
- NIST SP 800-154
- OWASP TMP
- TARA
- IDDIL/ATC
- hTMM
- QTMM
- ID3
Before we dive into the various methodologies though, let’s cover a few commonly encountered supporting resources that these threat modeling methodologies generally rely on.
Control Frameworks
Control Frameworks provide security / privacy controls, requirements, countermeasures, best practices, standards, risk treatments and other recommendations for strengthening the security posture of a system.
- OWASP ASVS: A framework of security requirements / controls that can be employed when designing web applications.
- MITRE D3FEND: A knowledge graph of cybersecurity countermeasures.
- NIST SSDF: A framework developed by NIST to facilitate the mitigation of risk in the SSDL.
- NIST SP 800-53 (Rev. 5): Organization-wide security and privacy controls (not specific to applications).
- NIST CSF: A set of best practices, standards and recommendations used to improve cybersecurity in an organization.
- Microsoft Web Application Security Frame: A web application security frame is used to converge knowledge into an activity by identifying categories, vulnerabilities, threats, attacks and countermeasures.
- LINDDUN Mitigation strategies and solutions: High-level view of common techniques used in-practice to prevent privacy threats.
- ControlCatalog: TrustOnCloud’s controls library, the companion to their attack scenario library.
- Security4Startups - Checklist of the security controls you should consider implementing in a startup.
- Equifax Controls Framework - Yes, even Equifax has a publicly published controls framework!
Attack Libraries
Attack Libraries provide lists of of attack patterns, risks, exploits and techniques which can be used to compromise a system or its assets.
- STRIDE: A simplified, categorical list of attacks developed by Microsoft.
- OWASP Top 10: A broad consensus of the most critical security risks to web applications.
- MITRE CAPEC: A comprehensive dictionary of known attack patterns.
- MITRE ATT&CK: Knowledge base of adversary tactics and techniques based on real-world observations.
- Read here to learn more about how MITRE’s CAPEC library compares to their ATT&CK framework.
- MITRE FiGHT: Knowledge base of adversary Tactics and Techniques for 5G systems.
- OSC&R - Open Software Supply Chain Attack Reference: A comprehensive, systematic and actionable way to understand attacker behaviors and techniques with respect to the software supply chain.
- OffSec Exploit-DB: CVE-compliant archive of public exploits and corresponding vulnerable software, developed for use by penetration testers and vulnerability researchers.
- PLOT4AI: Privacy Library of Threats 4 Artificial Intelligence (based on LINDDUN)
- TrustOnCloud ThreatModel for Amazon S3: A library of all the attack scenarios on Amazon S3
- SPACE-SHIELD - Space Attacks and Countermeasures Engineering Shield is an ATT&CK® like knowledge-base framework for Space Systems.
- Cloud Threat Landscape - A comprehensive threat intelligence database of cloud security incidents, actors, tools and techniques.
- Azure Threat Research Matrix
Vulnerability Catalogs
Vulnerability Catalogs are lists of known vulnerabilities, weaknesses and issues that affect specific software or classes of systems.
- MITRE CVE: A program which identifies, defines and catalogs publicly disclosed cybersecurity vulnerabilities.
- NIST NVD: Government repository of standards-based vulnerability management data represented using the Security Content Automation Protocol (SCAP).
- Read here to learn more about the MITRE CVE vs. NIST NVD relationship.
- MITRE CWE: Community-developed list of software and hardware weakness types.
- VulDB: Vulnerability database documenting and explaining security vulnerabilities, threats and exploits.
- CISA Known Exploited Vulnerabilities (KEV) catalog: Authoritative source of vulnerabilities that have been exploited in the wild, maintained by CISA.
- Global Security Database
- Snyk Vulnerability Database: Database of open source vulnerabilities maintained by Snyk.
- Open CVDB: An open project to list all known cloud vulnerabilities and cloud service provider (CSP) security issues.
- OpenCVE: Platform used to locally import the list of CVEs and perform searches on it (by vendors, products, CVSS, CWE…).
- Go Vulnerability Management: Database of Go vulnerabilities.
- LVE Repository
- RUSTSEC
Risk Assessment Models
Risk Assessment Models are methodologies for determining risk based on known information about a system. They are used to understand, control and mitigate risk to an organization or system.
- DREAD: Quantitative risk model developed by Microsoft that is reminiscent of CVSS.
- * Similar to STRIDE, DREAD is often mistakenly referred to as a threat modeling methodology. It is in fact a model to quantitatively evaluate security risk.
- NIST CVSS: Open framework for communicating the characteristics and severity of software vulnerabilities.
- OWASP Risk Rating Methodology: OWASP’s approach to calculating risk (OWASP Risk Rating Calculator).
- NIST SP 800-30, Guide for Conducting Risk Assessments: Guidance for conducting risk assessments of federal information systems and organizations.
- Harmonized TRA Methodology (TRA-1): Set of tools designed to address all assets, employees and services at risk - from the Canadian Centre for Cyber Security.
- FAIR: Factor Analysis of Information Risk (FAIR) is a methodology for quantifying and managing risk in any organization.
- Mozilla’s Risk Assessment: Risk framework devised and used by Mozilla’s security team. The Rapid Risk Assessment (RRA) methodology is a formalized, reproducible and consistent framework for conducting risk assessments.
- EBIOS Risk Manager (EBIOS RM): Method for assessing and treating digital risks, published by the National Cybersecurity Agency of France (ANSSI) with the support of Club EBIOS.
- Threat Agent Risk Assessment (TARA) | Intel: Methodology that distills the immense number of possible information security attacks into a digest of only those exposures most likely to occur.
- NIST CMSS: The Common Misuse Score System: Metrics for Software Feature Misuse Vulnerabilities contains a set of measures of the severity of software feature misuse vulnerabilities.
- MORDA: A quantitative risk assessment and risk management process that uses risk analysis techniques and multiple objective decision analysis models to evaluate information system designs.
- EPSS - The Exploit Prediction Scoring System is an open, data-driven effort for estimating the likelihood (probability) that a software vulnerability will be exploited in the wild.
- SCORES - Seconize Contextual Risk Enumeration System is a free risk scoring tool for vulnerabilities.
- CISA SSVC - Stakeholder-Specific Vulnerability Categorization system is a vulnerability analysis methodology that accounts for a vulnerability’s exploitation status, impacts to safety, and prevalence of the affected product in a singular system.
- Zoom VISS - The Vulnerability Impact Scoring System (VISS) captures objective impact characteristics of software, hardware, and firmware vulnerabilities in relation to infrastructure, technology stack, and customer data security.
Microsoft Threat Modeling
Microsoft’s Threat Modeling framework is comprised of five major steps. Microsoft emphasizes the importance of threat modeling as part of an organizations routine SDL practice. 3

Microsoft Threat Modeling Steps
- Define security requirements which reflect the legal/industry requirements, internal standards, previous incidents, known threats, data classification and business criticality of a system.
- Diagram the application by drawing a data flow diagram (DFD) which depicts the processes, systems, data stores, data flows and other contextual information about an application/system.
- Identify threats by leveraging an attack library or threat classification system such as STRIDE.
- Mitigate threats by developing potential risk treatments which can be implemented by system owners to address identified threats.
- Validate that threats have been mitigated by revisiting the threat model and adapting that model to account for changes introduced to the system as a result of previous mitigation efforts or functional changes.
Alongside this approach 3, Microsoft published a threat classification system known as STRIDE. Despite STRIDE having never been a particularly effective method for enumerating attacks 28, it has nevertheless prevailed as the taxonomy of choice for the official Microsoft Threat Modeling tool which uses STRIDE for auto-enumerating potential attacks within a provided model.
You know who else loves Microsoft Threat Modeling and STRIDE? GitHub! (unsurprisingly)
STRIDE
STRIDE is a 6*-pronged threat classification model developed by Microsoft. * STRIDE is often mistakenly referred to as a threat modeling methodology, but it is in fact just a collection of 6 somewhat 28 distinct threat classes. These threats and their respective desired security properties are listed below. 4
| Threat | Security Property |
|---|---|
| Spoofing | Authenticity |
| Tampering | Integrity |
| Repudiation | Non-Repudiability |
| Information Disclosure | Confidentiality |
| Denial of Service (DoS) | Availability |
| Elevation of Privilege (EoP) | Authorization |
| * Lateral Movement (LM) 24 | Least-Privilege |
Below is a matrix describing the STRIDE threat categories and how they typically apply to the elements of a standard data flow diagram (DFD). 25
| Element | S | T | R | I | D | E |
|---|---|---|---|---|---|---|
| Data Flow | X | X | X | |||
| Data Store | X | X | X | |||
| Processes | X | X | X | X | X | X |
| External Entity | X | X |
DESIST
DESIST is a variant of STRIDE, it stands for Dispute, Elevation of Privilege, Spoofing, Information Disclosure, Service Denial and Tampering.
DREAD
DREAD is a threat / risk assessment model developed by Microsoft. It is comprised of the 5 metrics below. 5
- Damage : Confidentiality, integrity and availability (CIA) impact.
- Reproducibility : How often a specified type of attack will succeed.
- Exploitability : Effort and expertise required to mount an attack.
- Affected Users : Number/type of users that could be affected.
- Discoverability : Likelihood of exploitation.
A simple way to use DREAD to quantitatively calculate risk would be to assign a value, 1-10 across each of the metrics above for each of the known threats / vulnerabilities applicable to a system. Once complete, take the average, which will yield the final (out of 10) risk score. This is similar in some ways to how CVSS is used to score risks. In fact, DREAD maps to CVSS (v3.1) as shown below. With all this said, the scoring methodology via DREAD is notably problematic. 28
DREAD to CVSSv3 Matrix
| DREAD Criteria | CVSS Metric(s) | CVSS Acronym |
|---|---|---|
| Damage | Impact, i.e. Confidentiality, Integrity & Availability | (C,I,A) |
| Reproducibility | Exploit Code Maturity | (E) |
| Exploitability | Attack Vector, Attack Complexity, Privileges Required, User Interaction | (AV, AC, PR, UI) |
| Affected Users | Scope | (S) |
| Discoverability | Remediation Level, Report Confidence | (RL, RC) |
PASTA
Process for Attack Simulation and Threat Analysis (PASTA) is a risk-centric, threat-focused, evidence-based and highly collaborative threat modeling methodology. PASTA is composed of a 7-stage process. These stages are listed below, with subsequent sections that cover in detail each respective stage.
- Stage 1: Define Objectives
- Stage 2: Define Technical Scope
- Stage 3: Application Decomposition
- Stage 4: Threat Analysis
- Stage 5: Vulnerability & Weakness Analysis
- Stage 6: Attack Modeling
- Stage 7: Risk & Impact Analysis
For each stage of the PASTA threat modeling process I provide an I/O flow diagram which describes the respective inputs, processes and outputs for each stage. * I do not exhaustively cover each element of the respective stages as this would prove rather tedious and even overly informative. Rather, I will describe select pieces of each stage based on the elements I deem either un-obvious or particularly opaque given the stage-specific process-flow depiction alone. Where applicable, I’ll also provide additional instruction, context, commentary and analysis within each stage’s section. 6
PASTA Stage 1: Define Objectives
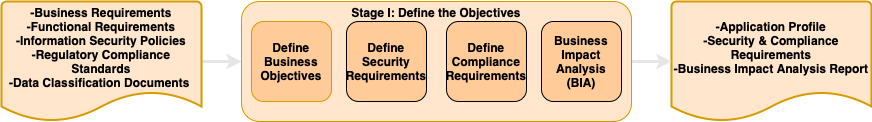
- The inputs for Stage 1 require quite a bit of data gathering and cross-team collaboration. Some teams you may need to consult for these inputs are listed below…
- Business Requirements: Business partners from the department the target system resides in.
- Functional Requirements: (Software) Engineering team(s).
- Information Security Policies: Security team & security leadership.
- Regulatory Compliance Standards: GRC or Privacy team(s).
- Data Classification Documents: Enterprise architecture, IT or GRC teams.
- Work with business stakeholders to understand business objectives.
- To define security requirements, consider leveraging a methodology like SQUARE.
- For defining compliance requirements, you’ll need to understand the regulatory / compliance frameworks your organization may be beholden to (and there are a lot of them).
- Business Impact Analysis (BIA) report: I won’t cover conducting a BIA engagement within this guide. Please reference this great resource on BIA from Ready.gov if you want to learn more.
- Application Profile: Any high-level description of the application and its functionality is suitable but the profile would ideally include information such as - application type (e.g. Internet-facing), data classification (e.g. public, confidential, restricted), business objectives, inherent risk, high risk transactions (e.g.yes/no), user roles, number of users, etc…
- Like other methodologies covered in this guide, PASTA includes the development of formal security (and privacy) requirements. Personally, I think these should be implicit inputs into a threat modeling exercise, rather than an explicit output, but… </shrug>
Compliance Frameworks
Compliance is a necessary evil in the world of security and threat modeling. There is an overwhelming collection of compliance frameworks that govern industries around the world. Some examples include - Sarbanes-Oxley (SOX), PCI DSS, NIST CSF, SSAE-16, AT-101, FedRAMP, ISO, Privacy Shield, HIPAA, HITECH, SOC 2, CMMC, GDPR, CCPA, GLBA, PIPEDA, FISMA, CSA STAR, COBIT, FERPA, COPPA, NERC CIP, HEOA, HITRUST, etc… 30,31
PASTA Stage 2: Define Technical Scope

- Similar to Stage 1, there are other teams that will likely need to be consulted for the required inputs, e.g. the network team and engineering team(s).
- Technical Scope: Inventorying network, infrastructure and software components contributes to developing a holistic technical scope as well as for understanding the boundaries of a system. Example component elements include - application components, network topology, protocols/services (from existing data flow diagrams), use case scenarios (via sequence diagrams), assets (targeted data / sub-systems), security controls (e.g. authN/authZ, encryption, logging, etc…), data interactions (e.g. login, registration), technology types / versions, etc…
- The technical scope derived in this stage is the basis for our understanding of the systems attack surface.
PASTA Stage 3: Application Decomposition
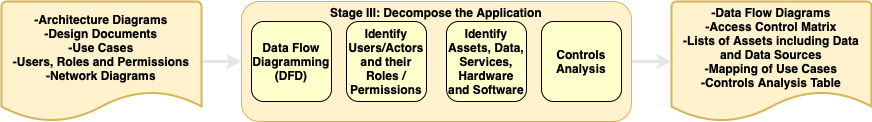
- For reference, here’s a good definition of a design document.
- Use case enumeration can be time-consuming and unwieldy depending on the size & scope of the target system.
- This stage requires the development of a data flow diagram (DFD).
- Controls Analysis: For each use case (transaction), determine the inherent risk, data classification in scope and security functions invoked for each control type (e.g. input validation, authN/authZ, session management, encryption, etc…). Note: This can be done in a spreadsheet.
- “Explicit” vs “Implicit” trust: Are authorization (authZ) decisions made on context-aware rules (i.e. Zero Trust) or simply by whether you can communicate with something?
- Access Control Matrix: A formal security model that characterizes the rights of actors with respect to assets in a system.
- Use Case Mapping: Similar to Trike, PASTA demands the mapping of use flows.
PASTA Stage 4: Threat Analysis

- * I find it a little strange, or just unnecessary, to bring straight-up application / SIEM logs into a threat modeling assessment, but that’s what PASTA wants as an input in this stage…
- Attack Scenario Probability Analysis: Probability (i.e. likelihood) is factored using a plethora of security criteria (e.g. attack vector, attack complexity, privileges required, user interaction, exploit code availability, vulnerability patch level, in-line security controls, threat actor capability, threat actor infrastructure, threat actor motivation, etc…) - pretty much CVSS metrics.
- Consider what threat intel can be developed from analyzing internal/external incident reports. Can we perform attribution? Are there identifable TTPs? Do we at a minimum have workable IoCs?
- PASTA asks that we perform regression analysis on security events. What does that even mean? In this context, I suppose it means analyzing security events applicable to the target system and determining whether they have any real risk-implications.
- Attack Scenarios are high-level descriptions of attack paths we will later model by using attack trees.
- We can correlate CTI to our attack scenarios by mapping industry-applicable CTI to the threats / malicious actors proposed when we developed the attack scenarios.
Cyber Threat Intelligence (CTI)
Cyber Threat Intelligence (CTI) is a vast discipline, and not one I’m going to try and cover exhaustively or authoritatively here. Instead, I’ll cover a few key things for the purposes of understanding the application of CTI within the greater process of performing threat modeling. Let’s start with what makes something a “threat”. Threats can be defined as the cross-section of when a threat actor has the following…
- Intent - The motivation/desire to attack a target.
- Opportunity - Accessible attack surface that contains vulnerability.
- Capability - Infrastructure, tooling, exploits and applicable TTPs to perform an attack. 7
This is further visualized using the well-known Diamond Model (depicted below). Each line represents a relationship of how an attacker might attack a target/victim, e.g. the Adversary uses Infrastructure and known Capabilities to attack Victim. 8

Below are some other assorted thoughts and resources related to CTI.
- Chad Warner has an interesting writeup on using the Diamond Model if you want to dive deeper on this topic.
- Threat Intelligence can also be defined as, data that is collected, processed, and analyzed to understand a threat actor’s motives, targets, and attack behaviors. (source)
- One important concept to understand related to CTI is the difference between Data, Information and Intelligence.
- Intelligence should be actionable, enabling security teams to make better decisions.
- A Cyber Threat Intelligence Self-Study Plan: Part 1, Part 2
- Cyber Threat Intelligence Dashboard
- Threat Actors can be modeled based on existing threat profiles. Organizations like MITRE, Crowdstrike, Dragos, Mandiant, CFR, Google TAG, Microsoft & Secureworks track global threat actors and make these profiles publicly available.
- Organizations and representative security teams typically consume threat intel through (integrated) feeds or via published reports (typically from the organizations I just listed). Good open-source CTI projects include MISP and OpenCTI.
- Other external threat sources to consider include…
- Verizon’s annual Data Breach Investigations Report (DBIR)
- US Cert & CISA AIS
- SANS Internet Storm Center
- McAfee’s Threat Landscape Dashboard (Operation FINSHO)
- Emerging Threats & rules
- APT Groups and Operations | apt.threattracking
- Playbook Viewer | Unit42
- OTX AlienVault
- Electronic Transactions Development Agency (ETDA)
- MISP Galaxy Threat Actors
- Talos
- R-CISC. 9
- InfraGard
- BlockList.de
- PhishTank
- CINS Score
- Spamhaus
- VirusShare
- Google Safe Browsing
- Traceability Matrices can be created to examine a threat agent. Controls can be mapped within the matrix to effectively mitigate the threat. Note: Similar results can be achieved from building attack trees, this is just one other medium. A traceability matrix is a 7-column table with the following fields. 10
PASTA Stage 5: Vulnerability & Weakness Analysis

- To be honest, I’m not entirely sure what the difference between a threat tree and an attack tree is… Stage 5 asks that we develop threat trees while Stage 6 then asks us derive attack trees. (??) The only difference I can divine is the latter uses attack libraries as input, so perhaps attack trees use known attack data rather than theoretical paths?
- Stage 5 requests the ingestion of vulnerability assessment reports, vuln-to-asset attribution and scored vulnerabilities. This can be done manually, or preferably, performed as part of a larger Vulnerability Management program (VMP).
- Vulnerability Catalogs and vulnerability scoring systems like CVSS are heavily used in this stage.
- Design Flaw Analysis: Evaluate use and abuse cases for ways an attacker might compromise a system.
- For documenting threats-attacks-vulns-assets, a simple list or table will suffice. Try to maintain as much elemental affinity as possible (i.e. attempt to capture the relationships between threats, attacks, vulnerabilities and assets).
PASTA Stage 6: Attack Modeling
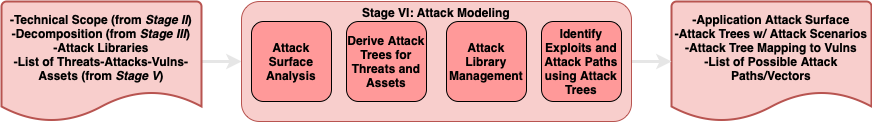
- Now at Stage 6 we start to see many of the outputs from previous stages being fed back in as inputs (e.g. technical scope, decomposition, etc…)
- Attack Surface Analysis: What this means exactly is a bit ambiguous and probably open to some interpretation. Generally, I would focus on a prioritized list of surface-area components based on data criticality and surface volume. Check out CrowdStrike’s take on Attack Surface Management.
- Attack Trees are a big part of Stage 6.
- What does it mean to manage our attack library? Well we have some attack libraries we can import, so my guess is it just means to update or add to an imported library of attacks (unless of course we maintain one ourselves). This is reminiscent of TARA, Step 3: Knowledge Management. 23
- Beyond the attack trees themselves, it could be additionally beneficial to map attack paths as overlays on top of the previously created DFD.
Attack Trees
Attack trees are hierarchical, graphical diagrams that show how low-level hostile activities interact and combine to achieve an adversary’s objectives. The goal of the attack is the root node, and the ways of achieving that goal are the leaf nodes. Like other decision trees, attack trees are inverted, with the flow beginning from the leaves up to the root. As an attacker progresses through the tree through the intermediate states, they may gain certain tactical benefits and achieve other impacts. 11,12

Here’s some more technical tid-bits on attack trees…
- Attack trees have AND and OR nodes. For an attacker to progress, each leaf node must be achieved per the condition of its parent node. 12
- You could further overlay nodes and paths with other contextual data. For example, you could associate nodes with a cost or time weight. You could also overlay security controls information. 11
- Commonalities from one tree to another can be considered attack patterns. 26
- A single branch on an attack tree is considered an attack path.
To create a tree, first start by enumerating all possible attack goals. (Warning: Attack trees can get pretty big, so you may want to start small and build out from there). Remember, a list of attack scenarios was developed in the threat analysis stage (Stage 4). For each threat, create leaf nodes which represent the actions, weaknesses or vulnerabilities that would need to be present for the attacker to succeed. Each attack / threat / goal has a separate tree, and when combining all trees together, you create a composite attack graph. To add further context and value to an attack tree, consider the tree provided below. It adds data such as the asset affected, the use and abuse cases involved, library-mapped attack patterns and even explicitly-defined impacts! 9

Attack trees can and should be used to make security decisions. By performing an attack tree exercise, you can see if a system is vulnerable to an attack. You can also challenge existing security assumptions about a system and ultimately better understand the impact of vulnerabilities. Similarly, you can better understand the risk / impact mitigated by controls that you can overlay on or between nodes within the attack tree.
* Note: In a future update to this section, I will be adding details around misuse cases in the context of attack trees. Stay tuned!
Attack Tree References
- Attack Tree Tools
- Extra Reading: Guided design of attack trees: a system-based approach
- Extra Reading: An Evolutionary Approach of Attack Graphs and Attack Trees: A Survey of Attack Modeling
PASTA Stage 7: Risk & Impact Analysis

- Qualitative risk analysis is subjective, using categorical associations, whereas quantitative risk analysis is objective, utilizing numerical values.
- 4 traditional ways to deal with risk: mitigation, transference, acceptance and avoidance.
- To conduct a gap analysis at a basic level, you need to know your current state and your desired state. Your desired state could align with an industry-standard security framework (e.g. ISO 27001, SOC 2 Type II, etc…), or it could be simply mitigating known risks to an acceptable level.
- Residual risk can be rudimentarily calculated by taking (Vuln * Attack * Impact) and dividing by Countermeasures. 9
- There are a bunch of risk modeling frameworks that can be employed at this stage.
- The application risk profile I see as a high-level description of the risk the application faces as well as the risk to the business given the current state of the system.
- The threat matrix (in my mind) is a simpler, tabular version of the threats produced in Stage 4, coupled with the assets identified in Stage 3 and the vulnerabilities discovered in Stage 5.
- With a prioritized list of risks, consult one of the many control frameworks to begin building a comprehensive risk mitigation strategy, or at least a list of targeted risk treatments.
Thoughts on PASTA
Phew! This methodology is a doozy… I list some thoughts and extra meatballs-of-wisdom for PASTA below.
- To perform a PASTA-style threat model by-the-book is an incredibly huge undertaking. It requires a massive amount of data collection as inputs and an even greater amount of effort producing the litany of output artifacts required to achieve success in the final stage.
- Creating countless diagrams, matrices, lists, trees, graphs… is VERY time-consuming. It took me a gross amount of time just to make the pretend artifacts for this guide. Attack trees are especially high LoE.
- Though I feel relatively comfortable in saying I’ve explained the spirit of PASTA quite thoroughly, there are bits here and there that I’m sure I either misrepresented, left out or otherwise goofed on. My understanding of PASTA is based on quite a bit of open-source research, but unfortunately none of that research involved actually having access to the official book in which it is formally described. The book is like $100+ which is pretty crazy imo.
- For another take on a PASTA-like threat modeling approach, check out TMM from the KTH Royal Institute of Technology. TMM simplifies the process of threat modeling relative to PASTA-classic (which we know is hyper-involved) and adds the risk modeling benefits (and flair) of FAIR.
- VerSprite also has a PASTA + FAIR-inspired approach / tool, the Organizational Threat Model.
- Tony UcedaVélez, co-author of the OG PASTA book also happens to be CEO at VerSprite.
- PASTA has 3 different implementation tiers / options. 9
- Blind Threat Model: Essentially stages 1 & 2 of PASTA.
- Evidence-Driven Threat Model: Integrate organization threat telemetry (log analysis) and correlate CTI with attack trends from logs. So essentially up through Stage 4.
- Full Risk Based Threat Model: Run statistical/probabilistic analysis on threat data, attack sequences and attack effectiveness. In other words, all 7 stages.
- A sample PASTA Threat Modeling exercise from GitLab is linked here.
- So who uses PASTA? Well we know GitLab and Versprite do (a variation of it atleast).
- The secret sauce of PASTA (get it?) is its obsessive focus on threats, and mapping out exactly how those threats can be realized, or prevented.
OCTAVE
Operationally Critical Threat, Asset and Vulnerability Evaluation (OCTAVE) is an organization-focused framework for identifying and managing information security risks. It was published in 1999 by researchers of the Software Engineering Institute at Carnegie Mellon. Similar to other threat modeling methodologies, OCTAVE includes steps for identifying assets, threats and vulnerabilities. OCTAVE-based assessments include 8 distinct processes across 3 phases. 13
OCTAVE Variants
In addition to the original OCTAVE model, two variations of the methodology were also subsequently published. All 3 are listed below. 13
- OCTAVE (1999)
- OCTAVE-S (2003)
- OCTAVE Allegro (~2007)
The Phases & Processes of OCTAVE
Rather than provide detailed explanations of each phase and process of OCTAVE, I provide only the high-level description of each below. For more prescriptive guidance on how to accomplish the steps within each phase/process, I would recommend referencing similar sub-processes described from the other methodologies in this guide or by consulting the official OCTAVE publication **. 13

- Phase 1: Organizational View - Inventory assets, develop a threat profile, gather knowledge from across the enterprise and establish security requirements.
- Process 1: Identify Enterprise Knowledge
- Process 2: Identify Operational Area
- Process 3: Identify Staff Knowledge
- Process 4: Establish Security Requirements
- Phase 2: Technological View - Inventory high-priority systems and identify infrastructure policy gaps, vulnerabilities and organizational weaknesses.
- Process 5: Map High-Priority Information
- Process 6: Perform Infrastructure Vulnerability Evaluation
- Phase 3: Strategy and Plan Development - Calculate risk by analyzing gathered assets, threats and vulnerabilities. Produce a prioritized list of risks, a protection strategy and a risk management plan.
- Process 7: Conduct Multi-Dimensional Risk Analysis
- Process 8: Develop Protection Strategy
** Note: I may re-visit this section in the future to add additional depth, but for now I have left it pretty bare-bones. I’ve done this because I really don’t care for this methodology.
Thoughts on OCTAVE
With OCTAVE, there is a heavy emphasis in Phase 1 on meticulous and (overly) exhaustive knowledge gathering from across the enterprise. Senior managers, operational managers and rank-and-file staff are all consulted. Though I believe any good threat modeling approach will leverage system owners / organizational stakeholders to describe their systems and discuss the threats / risks / controls that exist within the target system from their perspective, OCTAVE seems to rely exclusively on these system owners rather than dedicated security staff. Though these system owners surely possess authoritative knowledge about their own system(s), they lack the security depth to be effective in providing a meaningful list of threats and security controls.
The goal for Phase 1 of an OCTAVE engagement is to establish security requirements. Personally, I think security requirements should be an input into a threat modeling exercise, rather than an output or goal. Requirements are not really system-specific, rather they should be adopted organization-wide then used to influence and provide boundaries for subsequent threat models. With that said, I see the benefits of using OCTAVE in the nascent stages of information security program development as a way to define threat / risk-informed security requirements.
One thing OCTAVE nails in my mind is the exercise of identifying high-priority components within the target system. Once determined, denote these components within the larger asset map to better understand critical attack paths.
In Process 6 of OCTAVE, “Perform Infrastructure Vulnerability Evaluation”, the assessment team is tasked with selecting intrusion scenarios. This is to be done based solely on previously gathered characteristics of the enterprise but makes no mention of using actual threat intelligence. This is a huge blind spot in my opinion. Sure, you can certainly speculate (and wildly so) as to all of the potential intrusion scenarios in an environment but having an intel-informed approach will yield much better risk-driven results in the end.
Overall, I find OCTAVE tedious, complex and confusing, especially when applied in a more tactical threat modeling sense as its highly prescriptive set of steps is undeniably time-consuming. But don’t take it from me, the SEI team themselves say as much in a subsequent (more simplified) OCTAVE release…
“Finally, given the size and complexity of the OCTAVE method, it is easy to imagine that some organizations have significant challenges in embracing and using the OCTAVE approaches. Absorbing hundreds of pages of process documentation, understanding the accompanying worksheets and how to use them, and collecting and organizing the needed data can be challenging tasks. Upon reflection, the sheer volume of data collection is an impediment for some organizations in moving forward with performing the tasks of analyzing and mitigating risks. A streamlined process that reduces ambiguity and is more structured may be more applicable to the needs of organizations that find the existing OCTAVE methods too cumbersome to use.”
To OCTAVE’s credit however, I don’t consider it exclusively a system threat modeling methodology, rather one that is wrapped in a larger risk assessment / management model and meant to evaluate an organization as a whole rather than targeting a specific system. After all, it is defined as a framework for identifying and managing information security risks. When you start to delve into the risk “management” side of things, you start to tread beyond the more limited-scoped responsibilities of typical threat modeling.
OCTAVE-S
OCTAVE-S is a (mildly less complex) variation of OCTAVE classic, (published in 2003) tailored to constrained, less hierarchical organizations. It is meant to be conducted by a small team (3-5 people) of inter-disciplinary individuals with broad knowledge of the organization. In reality, it’s pretty much the same process (with the same flaws) and with only two notable differences.
- OCTAVE-S assessments are conducted by a small team rather than having expansive, formal workshops across the organization interviewing all managers and technical staff. This potentially helps reduce some overhead but the data needed as input(s) across all the phases does not materially change (with the exception of the bullet below).
- Exclusion of technical vulnerability data in favor of evaluating higher-level secure configuration processes. The expectation is that smaller organizations outsource or otherwise have abstracted processes which would limit the ability (or need) to gather this more granular vulnerability data.
OCTAVE Allegro
OCTAVE Allegro (circa 2007) is the final distillation of the original OCTAVE methodology, the goal of which is to produce more robust results without the need for extensive risk assessment knowledge. In other words, it more closely resembles an actual threat modeling process and less-so a comprehensive risk assessment framework. The process flow for OCTAVE Allegro is depicted below.

Thoughts on OCTAVE Allegro
It’s great that the OCTAVE team realized that OCTAVE and OCTAVE-S were overly cumbersome and I think the Allegro variant is a decent model with some worthwhile bits. With that said, it ultimately would not be my threat modeling scheme of choice in any context.
OCTAVE Allegro introduces some over-indulgent concepts such as information “containers” and “environment maps”. The environment map seeks to capture all places (what they refer to as containers) where an “asset” is stored / transported / processed and must then be classified as “technical”, “physical” or “people”. I’m not saying there is no security value in capturing this level of detail, just that it is overly-involved and has low RoI.
Risk Measurement Criteria
One aspect of OCTAVE Allegro I think is unique and pretty useful is the concept of defining risk measurement criteria. I think this criteria is something that should be established at an organization-wide level, rather than attributed to a specific threat model, but nevertheless this concept has real value. One of the hardest aspects of threat modeling and more broadly, risk assess-ing is understanding and calculating true business risk / impact. By taking the time to formally develop risk measurement criteria, you will ultimately be more successful in creating truly risk-prioritized outcomes from your threat modeling assessments. Some examples of risk categories from OCTAVE Allegro are listed below.
- Reputational / customer confidence (e.g. customer loss, brand degradation)
- Financial (e.g. operating costs, revenue loss, one-time loss)
- Productivity (e.g. staff hours)
- Safety and health (e.g. life, health, safety)
- Fines / legal penalties (e.g. fines, lawsuits, investigations)
- or a User-defined impact area
Trike
Trike (circa 2006) is a unified, conceptual framework for security auditing from a risk management perspective through the generation of various models. Trike’s distinguishing features are its high level of automatability, defensive-focus and purpose-built (open-source) Trike tool. The Trike v.1 threat modeling process is defined by its 4 distinct modeling phases (listed below). 14
Trike Modeling Phases
Trike Requirements Model
A Trike threat model begins by first building the requirements model. To do so, the following inputs are needed.
- Understanding of what the system is intended to do at a high level (i.e. an application profile).
- The Actors (human) who are interacting with the system.
- The Assets that actors interact with. Assets are discrete data entities or physical objects with inherent value within the system.
- The (business-defined) intended actions that are taken by said actors.
- Actions can be decomposed via CRUD (i.e. “create”, “read”, “update” and “delete”).
- Unintentional behavior is not included within the requirements model.
- The Rules that exist within the system to constrain an actors actions.
- Rules for an action are a set of declarative sentence fragments connected by logical connectives (“and”, “or” and “not”).
These inputs are ultimately expressed in a tabular format referred to as an actor-asset-action matrix (AAA). In an AAA matrix, columns are assets, rows are actor roles and cells are quad-divided for each C-R-U-D action. Each respective action-cell can be set to allowed, disallowed or action with rules. An example of what this matrix could look like is provided below.
Access Control Matrix
An actor-asset-action-matrix is also referred to as an access control matrix.

The Trike help spreadsheet can be download here. (Warning: It is a truly unwieldy beast.)
You can download my actor-asset-action matrix file here.
Trike Implementation Model
Once the requirements model has been defined, a data flow diagram (DFD) should be created. Within the DFD, other implementation details should be captured such as:
- Process technologies (e.g. OS, libraries, platforms, versions, etc…)
- Data store type (e.g. file store, database, registry entry, version info, etc…)
- Data flow protocols and directionality
- Trust boundaries and what enforces them
- Other security technologies and where they are used (i.e. encryption, authentication, authorization, firewalls, certificates, passwords, etc…)
With the DFD in-hand, we begin creating / layering use flows by taking each action defined in the system requirements model and tracing that action’s path through the DFD. Use flows are broken into segments when traversing an external interactor (this includes when traversing a user). * Use flows are an experimental feature of Trike.
Use Flow Map
* Note: In a future update to this guide, I will provide details and a depiction of a Use Flow map in a threat modeling context. Stay tuned!
Trike Threat Model
To build a Trike threat model, we begin with threat generation. Within Trike, threats are defined as anything more or less than the intended actions. Threats are always events rather than specific (threat) actors. Threats within a system are purely deterministic, given the actor-asset-action matrix. In other words, given a static matrix, the same set of threats should be generated regardless of who is running the exercise. The threat taxonomy for Trike is extremely simple, with only two categories - Denial of Service (DoS) and Elevation of Privilege (EoP). Let’s contrast this to the threat taxonomy first introduced by STRIDE.
- Spoofing: Trike considers spoofing an “attack” rather than a threat in most cases. However you slice it, Trike equates spoofing to a (Type 2) EoP whereby an actor is able to violate a rule.
- Tampering & Information Disclosure: Both are also considered instances of (Type 2) EoP within Trike.
- Denial of Service (DoS): When a legitimate action is denied. One DoS threat is generated for each intended action.
- Elevation of Privilege (EoP):
- Type 1: When an actor performs an action which no actor is intended to perform on an asset.
- Type 2: When an actor performs an action on an asset despite the rules for that action.
- Type 3: When an actor uses the system to perform an action on some other system’s asset (i.e. the “social responsibility” threat).
From here, attack trees should be generated for threats. * Trike recommends trees be expanded only to the point where there is enough information to reasonably decide whether the risk caused by the threat has been reduced to an acceptable risk level. This will limit the overhead of having to complete an entire tree for every. single. threat.
Trike Risk Model
Trike employs a quantitative approach to risk modeling, and describes it as “highly experimental”. As with everything in the Trike world though, it is quite formal and explicitly defined. To perform the Trike risk model, we calculate impact & likelihood as defined below.
Trike Impact Calculation
- First, assign all assets within the defined system a dollar ($) amount based on its inherent business value.
- On a scale from 1-5 (5 being the most undesirable), rank each defined action-to-asset pair (this is a qualitative measure). Each pair should be ranked twice:
- (1) For when an authorized action cannot be completed in accordance with the rules (i.e. the DoS threat impact/exposure metric), and…
- (2) For when an attacker completes an action despite the rules which disallow it (i.e. the EoP threat impact/exposure metric)
- On a scale from 1-5 (where the most untrusted (likely anonymous) is a 5), rank each actor within the defined system.
Now with these inputs, we can create an exposure value for each threat. The exposure calculation is the value of the asset multiplied by the action-specific threat impact score.
Trike Likelihood Calculation
Having completed the attack tree(s) in the threat modeling phase, we should now have a catalog of discovered weaknesses & vulnerabilities. The second step (probability calculation) of Trike’s risk modeling approach is to take each weakness / vulnerability and rank them on three separate scales (again from 1-5).
- Reproducibility: How easy a given weakness is to reproduce.
- Exploitability: How technically easy an attack is to conduct.
- Actor Risk: The risk value attached to the least trusted actor who is able to target the weakness (this was calculated in Step 3 of the impact calculation).
* While performing these rankings, consider the mitigations that currently exist along the identified attack paths and whether those mitigations reduce the score(s). (see QTMM, Stage 5)
With these three scores, we can now calculate the final probability of a weakness by multiplying all three subscores. * Trike defines an additional process for further calculating vulnerability probability by examining parallel success paths in the attack tree, but for the sake of this write-up we will forgo explaining this.
OK! Now that we have both the impact and likelihood scores, we can calculate the final risk score by multiplying everything together. For each threat, simply use the highest calculated applicable vulnerability risk. An example of what this risk calculation might look like is provided below. It’s very involved as you can see. As you scale assets and actors, the calculations can grow geometrically…

I’ve provided my sample risk calculator spreadsheet here.
Thoughts on Trike
Though not perfect, overall I like Trike. Its defensive-focused approach coupled with its highly formalized nature make it fairly unique in the threat modeling space. Below, I provide a list of other incongruous thoughts about Trike.
- Despite what the authors say - “Trike was built to bring efficiency and effectiveness to existing threat modeling methodologies” - I’m not sure how you cleanly apply this methodology as an overlay to others. As I spend more time with it, my feelings on this may soften, but I expect the highly formalized nature of Trike to not blend so well with other methodologies.
- Much like VAST, automation & scalability are key. Unlike VAST though, Trike does not dispense with the consultation of actual security experts (phew!).
- Somewhat counterintuitively, Trike doesn’t require knowledge of, or establishment of, a dedicated CTI source for generation of threats. Instead, threat generation is formed in a “defensive” manner by simply defining exactly how the system should work and designating anything not defined as a threat.
- The problem with building a complete state-machine model (which is what Trike prescribes) for a given system is that to do so, it is (very likely) a complex and time-consuming effort as the scope of your target system expands.
- With that said, if you can achieve a well-defined state-machine for the target system, you gain a very pure level of repeatability when it comes to performing automated threat models. Simply feed the same inputs in (attack library, implementation model, etc…) and you’ll get the same outputs!
- The Trike authors claim the framework / tool is under heavy development but evidence is to the contrary. Their last published talk was in 2012, the last update for their tool (hosted on SourceForge of all places - but now points to GitHub) was in 2019 and the FAQ suggested a v2 of the tool would be released (maybe) in 2013. (It’s 2022 and still no v2…)
- Some of the more detailed, systematic sub-processes of Trike are particularly… not-human-friendly. See Section 2.1 of the Trike v.1 white paper to see what I mean. Of course this is where the tool comes into play. I wouldn’t recommend hand-jamming a Trike threat model to the letter… very sweaty.
- There are a number of other author-stated capability gaps within Trike…
- No support for the creation of DFDs.
- Attack trees are not auto-generated.
- Trike doesn’t come preloaded with a managed attack library.
LINDDUN
LINDDUN (circa 2010) is a privacy-focused + threat-based, threat modeling methodology. The LINDDUN privacy engineering framework provides a systematic approach to identifying privacy threats in software systems. This methodology consists of 3 fundamental steps (depicted below). 15
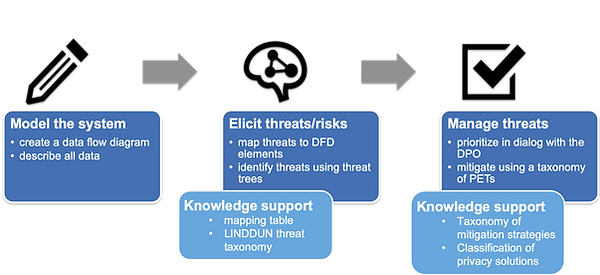
Step 1: Model the system - LINDDUN relies on a traditional data flow diagram to model the system.
Step 2: Elicit threats/risks - Each element (e.g. entity, data store, data flow and process) within the model should be analyzed for potential threats. A 2-dimensional matrix (i.e. mapping table) is built, denoting (i.e. with an ‘X’) which components have potential threats across each of the 7 threat categories. For each X in the generated table, a threat tree (similar to an attack tree, see Step 2C. Document threats of the LINDDUN framework) can be created to determine likely attack paths. The 7 privacy threat categories (linked to their respective threat tree catalogs) are listed below. 16
LINDDUN Threat Categories
The threat categories below represent 7 distinct privacy-oriented issues that may be found within a system. (These resemble the QTMM PPGs).
- Linkability: An adversary is able to link two items of interest without knowing the identity of the data subject(s) involved. (Desired Property: Unlinkability)
- Identifiability: An adversary is able to identify a data subject from a set of data subjects through an item of interest. (Desired Property: Anonymity / pseudonymity)
- Non-repudiation: The data subject is unable to deny a claim. (Desired Property: Plausible deniability)
- Detectability: An adversary is able to distinguish whether an item of interest about a data subject exists or not, regardless of being able to read the contents itself. (Desired Property: Undetectability / unobservability)
- Disclosure of information: An adversary is able to learn the content of an item of interest about a data subject. (Desired Property: Confidentiality)
- Unawareness: The data subject is unaware of the collection, processing, storage, or sharing activities (and corresponding purposes) of the data subject’s personal data. (Desired Property: Content awareness)
- Non-compliance: The processing, storage, or handling of personal data is not compliant with legislation, regulation, and/or policy. (Desired Property: Policy and consent compliance)

Step 3: Manage threats - Threats should be prioritized via risk assessment (one of your choosing, as LINDDUN does not prescribe a specific framework) and mitigations should be selected (LINDDUN so graciously provides a mitigation strategy taxonomy).
Thoughts on LINDDUN
LINDDUN is cleanly documented, simple and unique. It is purpose-built for the increasingly-important world of privacy. It doesn’t seek to reinvent the wheel, instead leaning on widely adopted strategies for modeling systems (DFDs), mapping attack paths (attack trees) and prioritizing findings. The LINDDUN team provides easy-to-use resources, threat tree libraries, mitigation catalogs and literally everything else you would need to be successful in conducting a privacy-oriented threat model.
VAST
Visual, Agile and Simple Threat (VAST) modeling is an abstract methodology from the team at ThreatModeler. VAST is keenly focused on scalability, which in this context can be described as the use of automation, integration and collaboration to perform threat modeling in an Agile practice. Other important tenants of VAST include providing a self-service model that does not rely on dedicated security expertise, as well as one that will produce valuable, actionable outputs for inter-disciplinary stakeholders. To visualize security concerns at both the application and infrastructure layers, VAST leverages two different types of threat modeling styles - application threat models and operational threat models. Application modeling focuses on the application itself using process-flow diagrams while operational modeling goes beyond the application, visualizing the interconnected infrastructure in which the application resides using traditional data-flow diagrams (DFDs). Examples of these two modeling techniques are provided below. 17,18
Application Threat Model
Depicted below is an Application Threat Model, visualized using a process-flow diagram. 18

Operational Threat Model
Depicted below is an Operational Threat Model, visualized using a data flow diagram (DFD). 18

Principles of VAST
The essential ingredient for ThreatModeler’s version of VAST is of course their commercial tool which comes preloaded with a proprietary threat library and is capable of performing automated threat modeling. In a more abstract sense, VAST can be thought of less as an actual threat modeling methodology and more-so as a set of principles by which other threat modeling methodologies should strive toward. These principles very transparently being…
- Visual: Leverage multiple visualization techniques such as “application” and “operational” modeling to best understand and document assets, data flows, threats and ultimately, risks from a variety of perspectives.
- Agile: VAST requires the use of a tool (such as ThreatModler’s tool, but doesn’t necessarily have to be) that is easily automatable within a DevOps pipeline. This provides scalability and consistent repeatability.
- Simple: Simplicity is key, as complexity hinders repeatability and scalability. As we know from our review of OCTAVE, having an overly thorough process is not necessarily a benefit.
- Threat: Threats are the name of game! By focusing on threats, we most effectively determine true risks to a system.
Thoughts on VAST
The efficacy of VAST in the context of its implementation via the ThreatModeler tool is not something I can speak to, as evaluating it would require access to, and experience with the ThreatModeler tool itself. With that said, I think a model which abides by the VAST principles, can be done at scale, can be performed by anyone, and in the end, yield actionable results, is about as ideal of a form that a threat modeling methodology can take. Sure, VAST may not produce the same depth of findings, or the perfectly prioritized list of risks that some of the other methodologies might, but what good are those other methodologies if they are too cumbersome (looking at you OCTAVE) to use at scale?
Threat Modeling Methodology Comparison
Below you can see ThreatModeler’s take on how different, popular threat modeling methodologies compare (which I think is a pretty genuine, mostly unbiased attempt). 17

Data-Centric System Threat Modeling, NIST SP 800-154
NIST Special Publication 800-154: Guide to Data-Centric System Threat Modeling , published by the National Institute of Standards and Technology (i.e. NIST), describes threat modeling as, “…a form of risk assessment that models aspects of the attack and defense sides of a particular logical entity, such as a piece of data, an application, a host, a system, or an environment.” This particular guide to threat modeling focuses on protecting data rather than systems, and is meant to define a set of principles that other methodologies could also adopt. Below, I have briefly summarized the steps of this threat modeling methodology. 21
Data-Centric System Threat Modeling Steps
This section contains the steps for conducting a data-centric threat modeling exercise (per NIST SP 800-154, Section 4). 21

- Step 1: Identify and characterize the system and data of interest.
- Authorized data locations - For all data of interest, document where data is stored, how data is transmitted, in what environments data is processed, how data is input into the system and finally, how data is output from the system.
- Security objectives - What are the confidentiality, integrity and availability (CIA) requirements for the data within the system?
- Authorized actors - What people and processes have an authorization-level high enough to affect the security objectives?
- Step 2: Identify and select the attack vectors to be included in the model.
- Attack vectors in this methodology can be described as content (typically malicious) from a source (i.e. web site) acted upon by a processor (i.e. web browser). An attack vector example given in the publication is, “Malicious web page content (content) downloaded from a web site (source) by a vulnerable web browser (processor).“
- Attack vectors in this methodology can be described as content (typically malicious) from a source (i.e. web site) acted upon by a processor (i.e. web browser). An attack vector example given in the publication is, “Malicious web page content (content) downloaded from a web site (source) by a vulnerable web browser (processor).“
- Step 3: Characterize the security controls for mitigating the attack vectors. i.e., for each attack vector from Step 2…
- Identify a (feasbile) mitigating control.
- Evaluate assumed effectiveness of the selected control.
- Estimate negative implications (e.g. cost, usability/performance degradation, LoE, etc…) of implementing that control.
- Step 4: Analyze the threat model.
- The guide timidly suggests a couple of risk scoring approaches in this final step, none of which I think are worth regurgitating here. Essentially, (as is similarly done with many other methodologies) we want to take some combination of data criticality, attack vector likelihood / impact and control effectiveness, across all pairings and begin prioritizing risk treatments.
Thoughts on the Data-Centric Approach by NIST
This methodology introduces some novel-ish concepts, and though it is notably light in some areas with respect to executing a data-centric threat modeling exercise, my verdict is that it’s a worthy addition to the overall methodology lineup. Below I’ve listed an assortment of other thoughts about what NIST put together. 21
- NIST SP 800-60 (and inherently FIPS PUB 199) are specifically recommended as a supplemental guides for facilitating the categorization & mapping of data. This is a critical pre-Step 1 action.
- I really like the data characteristics that this methodology asks us to identify in Step 1, but it is very light on how to actually inventory / identify that data. This is of course the hard part.
- I can appreciate the thought that went into the syntactic attack vector generation approach this methodology puts forth, but I think describing all attacks as content + source + processor is rather tedious and oddly patronizing.
- This methodology caters towards the data-obsessed. I think this heavy focus on data security has certain merits, as in many cases a threat actor’s intended impacts are indubitably data-specific - but, there are many system-specific attacks that have less to do with data that would still translate to high risk for a business. For this reason I don’t recommend going all-in on a data-only approach to threat modeling.
- Putting meaningful thought into the negative implications of each suggested control is an underrepresented part of the controls conjuration step of other threat modeling methodologies. Of course this should be done! After all, it’d be too easy to just unplug all our computers and throw them into the ocean - no hackers getting our data now, right?! But this just isn’t a feasible option.
- It’s clear that the authors (Murugiah Souppaya, NIST and Karen Scarfone, Scarfone Cybersecurity) ran out of creative juices when they got to Step 4. They call this final step, “Analyze the threat model” and then proceed to suggest a couple half-baked (“half” being very generous) scoring approaches for findings. “Analyze” is a pretty generic term - perhaps what they meant is risk model? In any case, what they suggested is pretty weak.
OWASP Threat Modeling Process
OWASP has a published Threat Modeling Process (a.k.a. “TMP”) which consists of 3 (very familiar) steps. Their methodology borrows pretty heavily from the more well-established players (i.e. PASTA & Microsoft) and is unsurprisingly web application-specific. I think OWASP’s own write-up is fairly to-the-point so I’ll only provide a condensed version of the steps below. 22
OWASP TMP Steps
This section describes the steps for conducting an OWASP TMP exercise. OWASP also provides a playbook to assist with an assessment. 22

- Step 1: Decompose the Application
- Construct an application profile (remember from PASTA?) - include application name, version, description, etc…
- Inventory and uniquely assign IDs to system components including external dependencies, entry/exit points (interfaces to/from the app), assets (potential targets) and trust levels (privileges required to interact).
- Produce a data flow diagram (DFD).
- Step 2: Determine and Rank Threats
- Select your preferred threat classification framework. OWASP uses STRIDE, but in theory, other frameworks could be subbed in. The authors also reference the “ASF” or Application Security Frame, which is another set of threats (and corresponding controls) sourced from the OWASP Code Review Guide.
- Perform threat analysis (should remind you of PASTA again) by generating threats tied to components/flows within the modeled system. To facilitate this process, consider using threat trees and/or use/abuse flows.
- Rank threats provided known risk factors using a risk assessment/scoring model such as DREAD (which is what OWASP suggests).
- Step 3: Determine Countermeasures and Mitigation
- Map corresponding countermeasures to identified threats using an appropriate controls framework.
- Once mapped, determine residual risk. For example, resulting risks could simply be defined as being “not mitigated”, “partially mitigated” or “fully mitigated”.
Thoughts on OWASP’s TMP
Alright! So here’s my list-based take on OWASP’s TMP…
- I like the focus / inclusion of dependencies as a potential attack vector / input interface. Gives me supply chain attack vibes, which is all the rage these days.
- This methodology emphasizes the concept of entry points (and to a lesser degree exit points). By understanding how/where an attacker can interface with a system we can better determine threats/attack paths.
- Oh yeah! Threat trees are back.
- This concept of an “ASF” (Application Security Frame) has popped up in a few threat modeling methodologies now (1, 2, 3). It is a concept I was not that familiar with prior to this research, but will more carefully consider moving forward.
- Oh no, STRIDE and DREAD are getting more stage time, how dreadful! 28
- OWASP sure doesn’t strain themselves coming up with a process for calculating residual risk. Just leverage an existing methodology, they say.
- ID’ing elements (i.e. dependencies, entry points, assets, trust levels) within the DFD is awesome and looks great.
TARA
Threat Assessment and Remediation Analysis (TARA) , designed by MITRE in 2014 (not to be confused with Intel’s TARA), is described as, an engineering methodology used to identify and assess cyber vulnerabilities and select countermeasures effective at mitigating those vulnerabilities. What makes TARA unique is its application of a (self-managed) catalog of controls-to-attack-vectors and its strategies for applying specific countermeasures based on specified risk tolerance. 23
TARA Assessment Workflow
This section details the TARA assessment process flow, as well as the actions within each of the 3 distinct phases of the methodology.

- Step 1: Cyber Threat Susceptibility Analysis (CTSA)
- Compile technical details to build a cyber model of the system. This is effectively an application profile (similar to PASTA:1, Trike:Req and OWASP:1). This methodology also recommends using a Crown Jewels Analysis (a.k.a. “CJA”) as input into this step.
- Search the managed threat catalog for plausible attack vectors based on the now-documented architecture.
- Perform a threat-based risk assessment. TARA suggests a simple, qualitative risk model such as the “Risk Cube” (i.e., impact x likelihood).
- The output of the risk assessment is a vulnerability matrix which contains a list of (ID’ed) attack vectors with corresponding risk scores.
- Step 2: Cyber Risk Remediation Assessment (CRRA)
- Vulnerabilities (from the vulnerability matrix) are mapped to countermeasures sourced from the managed controls catalog.
- The TARA Catalog consists of a series of attack-to-control pairings which are described as 3-tuples of the form, <Countermeasure ID, Attack vector ID, Countermeasure effect>, where the effect is “preventative” (P) or “mitigating” (M).
- An analysis is performed to estimate the utility and cost of each control-to-attack pair which ultimately yields the mitigation mapping table. This table is essentially the first 5 rows of the matrix depicted below.
- A holistic countermeasure selection strategy is developed by evaluating the solution effectiveness table (depicted below).
- Vulnerabilities (from the vulnerability matrix) are mapped to countermeasures sourced from the managed controls catalog.

- Step 3: Knowledge Management (KM)
- Extract applicable attack vectors from open (or closed) source cyber threat libraries (i.e. CAPEC & CVE).
- Further bolster managed TARA Catalog content to reflect changing landscape of known threats and respective countermeasures.
Thoughts on TARA
A collection of my thoughts about TARA are listed below.
- This methodology introduced me to the MORDA risk assessment model. Fun!
- TARA is not rigid, allowing swappable forms of risk ranking, attack generation, utility/cost scoring, etc…
- The methodology was purpose-built for achieving mission assurance (MA) during a federal acquisition process.
- The official TARA white paper claims “Over a dozen TARA assessments have been conducted since 2011…”. This paper was published in 2014… So, only slightly over a dozen TARA assessments in a 3-year timespan? Yikes!
- TARA calls on YOU to maintain an up-to-date threat-to-control catalog. This is incredibly difficult to manage without a full team dedicated to the pursuit. Given this is the standout feature of the methodology, I think it’s what cripples it.
IDDIL/ATC
IDDIL/ATC is a threat-driven threat modeling approach developed by Lockheed Martin in 2019. A security strategy which is driven by compliance or through implementation of a pre-canned list of controls is doomed to fail in the face of a realistic slate of threats. It is on this basis that this methodology eschews compliance and any emphasis on merely addressing vulnerabilities and instead favors mitigating true threats. IDDIL/ATC stands for “There are no idle threats - they attack” and consists of two distinct phases. 24
IDDIL/ATC was also designed to integrate cleanly with a typical software engineering lifecycle (SDL). This is demonstrated via the graphic below.

IDDIL/ATC Discovery Phase (IDDIL)
This section describes the initial phase of the IDDIL/ATC methodology. The 5 steps of this phase correspond with “IDDIL”. 24
- Identify the Assets: Identify business-critical assets as well as assets attackers may be uniquely interested in.
- Define the Attack Surface: Determine attack surface by mapping macro-level components / elements of the system that contain, transmit or access assets. Essentially, produce a data flow diagram (DFD).
- Decompose the System: For all components and flows within the model, layer in technology information and information about security controls present within the overall system. (Reference the Trike Implementation Model)
- Identify Attack Vectors: Leverage vulnerability catalogs and attack libraries to document attack paths, for example, by using attack trees.
- To be successful here, a threat categorization system should be selected (or developed) to assist with modeling and analysis of threats. IDDIL/ATC suggests using a tweaked version of STRIDE, “STRIDE-LM” which introduces the lateral movement threat category. As part of this threat categorization matrix, include a list of controls for each threat that provide some mitigating factor. (i.e. “I” in STRIDE is for information disclosure - an example control could be encryption.)
- List Threat Actors & Objectives: Leveraging CTI, develop a list of potential threat actors.
- It is suggested to create threat profiles for each asset / component of the system. A threat profile is a tabular summary which contains information like threat types, attack surface, attack vectors, threat actors, impacts, vulnerabilities, controls and other related information.
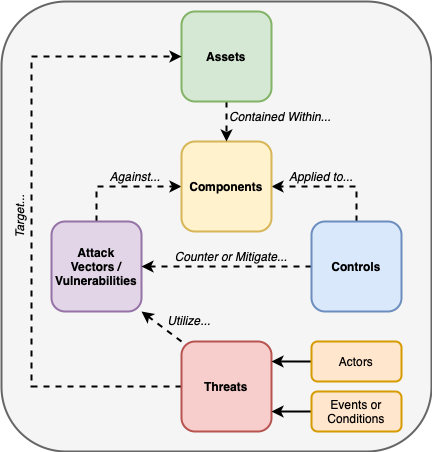
- To best understand the relationship between threats, assets and controls, reference the diagram provided below.
Threats-Assets-Controls Relationship
IDDIL/ATC is a threat-driven methodology. To best understand how threats interact with assets and controls, we visualize their relationship as depicted below. 24
IDDIL/ATC Implementation Phase (ATC)
This section describes the second (and final) phase of the IDDIL/ATC methodology. The 3 steps of this phase correspond with “ATC”. 24
- Analysis: Determine the impact of a successful compromise for each threat scenario (use a vulnerability scoring tool like CVSS).
- Assessment & Triage: Produce a business / mission-prioritized list of findings based on the evaluations of threats (conducted in the first step of this phase). A risk assessment model may be beneficial to help with the analysis & assessment from this and the previous step.
- Controls: Select and implement security controls to prevent/mitigate threats. A simple control taxonomy that IDDIL/ATC presents is - inventory, collect, detect, protect, manage and respond.
- To further understand the tools and practices employed to identify and implement controls as part of IDDIL/ATC, reference the following section.
IDDIL/ATC Controls Implementation
IDDIL/ATC includes a number of tools and practices, purpose-built to facilitate the selection, implementation and evaluation of security controls and their effectiveness (further detailed below). 24
Functional Controls Hierarchy (FCH) - The controls column in the threat categorization model chosen earlier corresponds to the portfolio of categorical controls located within the FCH. Alongside these controls is the high-level control function and the tools / capabilities an organization has implemented that possesses that security property (implementation). A sample record within an FCH is provided below.
Function Category Implementation Effectiveness ** Detect Endpoint Signature Anti-Virus Partial - A benefit of constructing and maintaining an FCH is the identification of duplicate controls within your organization.
- ** The “Effectiveness” field is reserved for the following, controls effectiveness matrix.
- Controls Effectiveness Matrix - An extension of the FCH, this matrix adds the “Effectiveness” field which captures the analysis of how effective a control is, mapped to a specific threat / attack vector within an organization.
- Effectiveness is recorded as “full”, “partial”, “none” or “complete control gap”, whereby the final rating is reserved for situations where nothing exists within the matrix (and thus within the organization) for a particular control category.
- Effectiveness is recorded as “full”, “partial”, “none” or “complete control gap”, whereby the final rating is reserved for situations where nothing exists within the matrix (and thus within the organization) for a particular control category.
- Controls Effectiveness Scorecard - Provides a “dashboard”-like view of enterprise controls effectivness coverage where high-level control categories (e.g. detect, protect, etc…) are mapped to identified attack surface components (e.g. User, Network, OS, Storage, etc…). A scorecard is created for each identified attack use-case. This is depicted below.

- Architectural Rendering - Combined, the previous tools can be collectively used as inputs into the devlopment of a controls-laden architectural rendering. This diagram resembles a flow diagram whereby we map the relationship between attack surface entities, directional data flows and overlays where controls and attacks apply within the architectural visualization. Though not an exact replication of an architectural rendering, this threat model DFD from Synopsys is a similar representation, depicting components/assets, threats and controls, all in one visualization.
Thoughts and Other Tid-Bits for IDDIL/ATC
Below I provide a few final parting thoughts and observations related to the IDDIL/ATC threat modeling methodology.
- IDDIL/ATC preaches a focus on practical and scalable integration within a standard engineering lifecycle while at the same time requesting the assessor manually build and maintain a series of controls matrices, potentially lengthy lists of threats/attack scenarios and generally produce a lot of documentation. Without a clear way to automate some of these steps (which this methodology does not cover), I don’t see this as being a particularly scalable methodology.
- An even heavier focus with this methodology is in leveraging threat data, threat categorization models (e.g. STRIDE, STRIDE-LM, Cyber Kill Chain) and other threat-focused tools (i.e. attack trees) to better determine risk and where effort should be spent. This quality of IDDIL/ATC is where it shines in my opinion. I too believe that by taking a truly threat-focused approach to security, an organization can more effectively mitigate risk.
- STRIDE-LM is a new concept for me. It’s just the normal STRIDE we all know and love but also includes “LM” which stands for lateral movement. The added desired security property is therefore segmentation / least-privilege. A worthy edition to STRIDE to say the least…
- Despite this methodology not being as “scalable” as the authors may suggest, I truly like this model and am surprised it has not been popularized more. It introduces valuable and novel concepts such as threat profiles, the FCH, controls scorecard and the architectural rendering. All of which I think could be valuable to produce as part of an ongoing internal threat modeling function.
- I wanted to make a quick note on the difference between a DFD produced early-on in the threat modeling lifecycle and the “architectural rendering” that this model introduces in the final phase. I think they are very similar in nature and if anything the latter just contains additional context and layers for the identified threats and controls juxtaposed inline with the assets / components from the original model. Keep in mind, a DFD will only contain assets, components and data flows - not the controls and threat information that gets developed in subsequent steps/phases within this and other similar threat modeling methodologies.
Hybrid Threat Modeling Method (hTMM)
The Hybrid Threat Modeling Method (hTMM) is an approach to threat modeling, published by Carnegie Mellon’s Software Engineering Institute in 2018, that combines features from the following models - STRIDE, Security Cards and Persona non Grata. At a high level, hTMM consists of 5 distinct steps, further described below. 25

- Step 1: Identify the target system. hTMM recommends leveraging steps 1-3 of SQUARE to divine business/security goals, assets and system artifacts.
- Step 2: Brainstorm potential threats and attack vectors using Security Cards. Conduct this exercise with developers, system users and cybersecurity staff.
- Step 3: Using the output from the Security Cards exercise, filter attack vectors/scenarios based on realistic personas.
- Step 4: For each identified threat, summarize the finding with the following attributes - actor, purpose, target, action, result of action, impact and threat type (i.e. STRIDE).
- Step 5: Conduct a formal risk assessment.
Thoughts and Observations for hTMM
In this section, I briefly cover a few thoughts and observations after learning more about the hTMM methodology. 25
- The primary foundations of hTMM are all threat-related - threat categorization using STRIDE and threat generation using PnG + Security Cards. This is an unsurprising theme amongst most documented threat modeling methodologies. Follow the threats!
- hTMM emphasizes the importance of early specification of security requirements, as this will have measurable impact for the security of the system architecture later on in the system lifecycle.
- Unfortunately, the authors continue to proliferate an incorrect understanding that STRIDE is a theat modeling method (a.k.a. “TMM”), when in fact it is simply a threat categorization tool.
- No explicit direction is given to create a data flow diagram. Interesting to not build a “model” in a “threat modeling” methodology!
- At various points, the authors suggest the use of “tool support” to facilitate the summarization and analysis of threat findings. At no point though do they really explain what these tools are or offer one of their own. For the record, this guide introduces a wealth of threat modeling tools.
- Overall, hTMM is pretty barebones and leaves a lot to be interpreted. Its inclusion of Security Cards and PnG is admittedly useful, but not something that is exclusive to this methodology.
Security Cards
Security Cards is a threat generation (or “Threat Brainstorming”, as the authors have referred to it) toolkit, originating from the University of Washington, consisting of 42 distinct “threat” cards across 4 unique “suits” (detailed below). 25,27
- Human Impact - Describes the impacts that actual humans may experience as a result of a successful attack.
- Adversary Motivations - Effectively, the “intent” characteristic of a cyber threat.
- Adversary Resources - As introduced by the Diamond Model in the CTI section, this represents an adversary’s available infrastructure used to facilitate an attack.
- Adversary Methods - Consider these the capabilities or TTPs an attacker leverages to conduct an attack.

So how are these cards used? Well, the official site for Security Cards provides a number of activities that can be exercised, all in the spirit of threat generation. In the absence of having a large, dedicated security function who has time to allocate appropriate resources to conduct threat modeling, Security Cards serves an alternative way to harness the creativity and brainstorming power of non-security personnel to perform threat generation and modeling instead. This can be particularly effective as you are able to introduce new, wide-ranging perspectives into the threat generation process.
Persona Non Grata (PnG)
Persona Non Grata (PnG) is a threat generation technique posited by Jane Cleland-Huang during her time as a software engineering professor at DePaul University (~2014). She suggested that we describe potential threat actors as archetypical users of a system that may have mischievous or even explicitly malicious end-goals. By visualizing and describing these personas, the real-world motivations and possible misuse cases (QTMM: Stage 3) of these unwelcome individuals could be developed, which would then help illuminate potential attack vectors and vulnerabilities. 29
The PnG exercise is useful as it gives anyone involved in the development, or securing of a system, the opportunity to think critically about the types of actors that may target a system, the specific goals they may wish to achieve and the actions they would take to achieve those goals. In the absence of reliable threat intelligence, PnG can be a useful mechanism for producing more realistic attack scenarios compared to something like Trike’s threat generation approach which is to enumerate ALL abuse cases, no matter how realistic. An example persona is described below. 25
Example PnG Threat Persona
“John” is a senior developer within your company. He has been with the company for almost 10 years and has been unhappy with recent changes within the engineering organization. His work velocity has notably slowed in recent weeks and has become more visibly disgruntled as a result of recent encounters with new leadership and having received less meaning project assignments.
Some misuse cases given Johns persona are as follows…
- Baking a logic bomb into enterprise code or systems.
- Purposefully injecting other forms of malicious code into a production branch.
- Taking secrets to a competitor.
- Introducing sloppy code as a result of sheer disinterest.
- Selling access to corporate infrastructure to an initial access broker.
The goals for John could be the following…
- “Get back” at leadership who he disagrees with or those he feels have “wronged him”.
- Leave the organization and take trade secrets, data or other assets to a competitor.
- Make money by selling data, secrets or access to the organizations infrastructure.
As a skilled developer, John’s capabilities include…
- Strong development and technical prowess.
- Privileged access to source code repositories, production systems and highly-classified data.
- Deep institutional knowledge.
- One of few individuals within the company who understand how certain systems operate and their architecture.
Quantitative Threat Modeling (QTMM)
A Quantitative Threat Modeling Methodology (QTMM) can be described as a threat modeling methodology that leverages the measurable characteristics of attack tree elements to quantitatively calculate and prioritize the impact and risk of threats to a system. Such a methodology was published by German researchers from the Technische Universitat Darmstadt and Goethe Universitat Frankfurt am Main universities, titled “Privacy-by-Design Based on Quantitative Threat Modeling”. This research debuts a privacy-focused variant of quantitative threat modeling and introduces the following novel features. 26
- A quantitative methodology designed to systematically elicit both security and privacy requirements, by iteratively tuning the risk associated with identified threats and attacks.
- A comprehensive set of quantifiable security and privacy (a.k.a. “S&P”) threats based on the “Privacy Protection Goals” (PPGs), which have proved well-suited for qualitatively evaluating risks.
- A set of rules to quantitatively aggregate into an attack tree the risks associated with individual attacks.
The Stages of QTMM
QTMM as described by this research is comprised of a 5-stage process which combines STRIDE, PPG and quantifiable attack trees to deliver privacy-by-design (“PbD”) within the early phases of the SDL. These stages are depicted below. 26

Stage 1: Define the DFD - Produce a standard data flow diagram (DFD) of the system.
Stage 2: Map DFD to S&P Threats - Map threats to the various elements (e.g. data store, data flow, process, entity) of the created model - for example, by leveraging STRIDE. In addition to the traditional security-related threats, QTMM also presents privacy-specific threats that should also be accommodated within the matrix. An example of such a mapping is provided below.
| Security Property | Threat | Explanation | DS | DF | P | E |
|---|---|---|---|---|---|---|
| Confidentiality | Information Disclosure | … | X | X | X | |
| … | … | … | X | X | X | X |
Stage 3: Identify Misuse Cases - Misuse cases are documented by capturing the following information - summary / threat description, target asset, misactor description, attack tree, attack preconditions and mitigation mechanisms. This is done in similar fashion to the LINDDUN methodology, which also suggests the formulation of attack trees to visualize these threats.
Stage 4: Risk-Based Quantification of Attack Trees - This stage represents the essence of QTMM, the goal of which is to provide a quantitative score for a threat tree based on the aggregate score of its collective attack paths. This particular methodology recommends the use of DREAD to quantitatively score and then prioritize attacks within the tree. For more details on the formulas for performing these calculations, I recommend referencing Section II:D (i.e., Stage 4: Risk-based Quantification of Attack Trees) of the QTMM research paper.
Stage 5: Produce S&P Requirements - Elicit mitigation controls and security requirements to mitigate identified risks. Refine attack trees by re-calculating the risk score given the implementation of the proposed countermeasure. Add new attack paths (as applicable) if the introduction of a security control results in new attack surface.
Privacy Protection Goals (PPGs)
Privacy Protection Goals (“PPGs”) are the basic set of security properties derived from the EU Data Protection Directive (Directive 95/46/EC). They resemble the LINDDUN threat categories. The PPGs are defined below. 26
- Unlinkability: Data processing is conducted such that privacy-relevant data is unlinkable to any other set of privacy-relevant data outside of the domain, or at least that the implementation of such linking would require disproportionate efforts for the entity establishing such linkage.
- Transparency: All parties involved in any privacy-relevant data processing can comprehend the legal, technical and organizational conditions.
- Intervenability: The parties involved in any privacy-relevant data processing, including the individual whose personal data is being processed, have the capability to intervene, where necessary.
Thoughts on this Version of a QTMM
Below I provide a list of thoughts and observations related to the quantitative threat modeling methodology (QTMM) presented here.
- Great idea to consider both security and privacy threats while performing threat modeling. How novel!
- “How can we make threat modeling more fun?”. MATH!
- QTMM suggests the use of the SeaMonster security modeling tool to assist with attack trees and misuse case modeling.
- Its reliance on a notably flawed model like DREAD is worrisome. That said, swapping DREAD out for a more worthy risk scoring model could take QTMM to the next level. 28
ID3
ID3 is a new(ish) threat modeling methodology created by yours truly. So what does ID3 bring to the table that other, more established methodologies don’t? Nothing really, I just thought it would be cool to come up with my own methodology and give it a cool acronym (and I think I succeeded). Jokes aside, this is in fact the threat modeling recipe I personally use, with influences from some of the other methodologies that have been presented here in this guide. What ID3 brings to the table is a repeatable, scalable methodology that incorporates exactly the elements most useful for my threat modeling style. The high-level steps (and noted influences) for ID3 are presented below.

Inventory System Components - Define the technical scope by building a system component inventory. This ends up being a mix of PASTA Stage 2, Phase 2: Process 5 of OCTAVE and OWASP TMP Step 1 (just the component-ID’ing step). 6,13,22
Diagram Architecture - Model the system, creating a DFD for visualization. Here I’m going with the equivalent of Microsoft’s “Diagram” step, or Trike’s Implementation Model, scratching the laborious use flow generation and holding the security control decomposition until Step 4. This also takes on the “Visual” quality of VAST. 3,14,17
Identify Threats - Develop a list of realistic threats using a CTI-infused version of Steps 4 + 5 of the IDDIL/ATC Discovery Phase (threat profiles & attack trees optional). I also make sure to include privacy-related threats ala LINDDUN. 15,24
- Decompose Application - With sub-systems, data flows and potential threats identified, I begin to decompose the application, generating a list of applicable security controls (i.e. OWASP ASVS), and then applying them as visual overlays at the points where they have effect(s) within the system architecture. For this, I’m relying on the Trike Implementation Model and Step 3 of NIST’s Data-Centric TMM. 14,21
- While proposing potential controls, I stay mindful of the negative qualities any given control may have on the system or organization (also per Step 3 of NIST’s Data-Centric TMM). 21
- * Note: Steps 3 and 4 could technically be switched here with no meaningful effect on the outcome. If you were to perform step 4 first you might in theory be able to rule out certain threats in the Identify Threats step. By doing this though, you might exclude certain threats without really giving them the proper analysis they deserve in the upcoming step.
Illustrate Threats - Leveraging our known technical scope, application decomposition, available CTI and imported attack libraries, I now build/analyze attack scenarios (from PASTA Stage 4), and then perform attack surface analysis and attack tree mapping (both from PASTA Stage 6). The preferred way to illustrate threats alogside the identified controls and system components is to produce an architectural rendering, per the IDDIL/ATC Controls Implementation Step. Once again, this step adheres to the VAST visual principle. 6,17,24
- Document Risk - Create a risk-prioritized list of findings based on probabilistic attack scenarios, expected impacts and the understanding of what defensive controls are in place. A simple risk-scoring system such as CVSS may be used here. This step of ID3 is going to most resemble PASTA Stage 7, just with simplified inputs and outputs. I also remember to re-factor the risk of threats based on the proposed countermeasures, similar to what is described in Stage 4 of QTMM. 6,26
So there ya have it! ID3.
Future Methodologies
In future updates to this guide, I will be detailing additional methodologies. A list of upcoming models is included below!
- INCLUDES NO DIRT 32
- CTM 33
- KTH TMM 34
- VerSprite OTM 35
- Penetration Testing Execution Standard (PTES) 36
- EMB3D
Modeling Exercise
* Note: In future updates to this guide, I will provide a step-by-step walkthrough of one or more of the Threat Modeling methodologies from this guide. Stay Tuned!
Conclusion
I had a lot of fun, and learned a great deal while building this guide out. I want to thank all of those involved developing the previous research, blog posts and assorted guidance-from-the-Internet I benefited from while putting this all together. Listed below are a few considerations and final parting thoughts related to threat modeling.
Don’t forget to perform threat modeling early on in the system development lifecycle and then continuously as the system evolves.
Threat modeling can be somewhat of an opaque subject which can make the barrier to entry seem high. I hope with this guide, the steps (whichever you choose to take) become clear and thus the path to threat modeling becomes easier.
Many of the threat modeling methodologies covered in this guide are very prescriptive, formalized or just plain involved. This can be overwhelming to the point where you don’t even bother attempting to threat model because you won’t be able to succeed in a by-the-book approach. Try to focus less on doing every. single. thing. that these methodologies describe and more on what you can do to help better highlight the risks within a system. That’s exactly what I did with ID3! I just cherry-picked the things I liked from different models, smushed them together, slapped a shiny new name on it and went on my merry way. In other words, don’t let perfection be the enemy of good.
Threat modeling is (and should be) highly collaborative. You’re going to need help. Use this time to build relationships across the business, learn in a cross-disciplinary fashion and of course, have fun!
Each of the threat modeling methodologies covered in this doc have a context in which they shine. You may find that at different organizations or at different moments in time within a single organization, one methodology will prove superior to another. What I’m trying to say is, keep a working knowledge of all of them, you never know when you’ll want to use one over another.
“The Enchiridion of Impetus Exemplar”, loosely translated from Latin means “The Manual of Attack Model”. It sounds better in Latin…
Appendices
Data Flow Diagram
Data Flow Diagrams (DFDs) are more art than science, in fact, they are drawings much like art! There is however some science to DFDs, especially in the context of threat modeling. The following key should help you decipher the elements within the DFD I have provided, as well as other DFDs which use this common symbology. 4
- Rounded Rectangle - External process/entity
- Circle - Internal process
- Arrow - Directional data flow
- Partial Rectangle (parallel horizontal lines) - Data store
- Rectangle - External entity (out of our control sphere)
- Dotted Line - Trust boundary
The DFD you see below is a (admittedly poor) visualization / model of the shellsharks site.
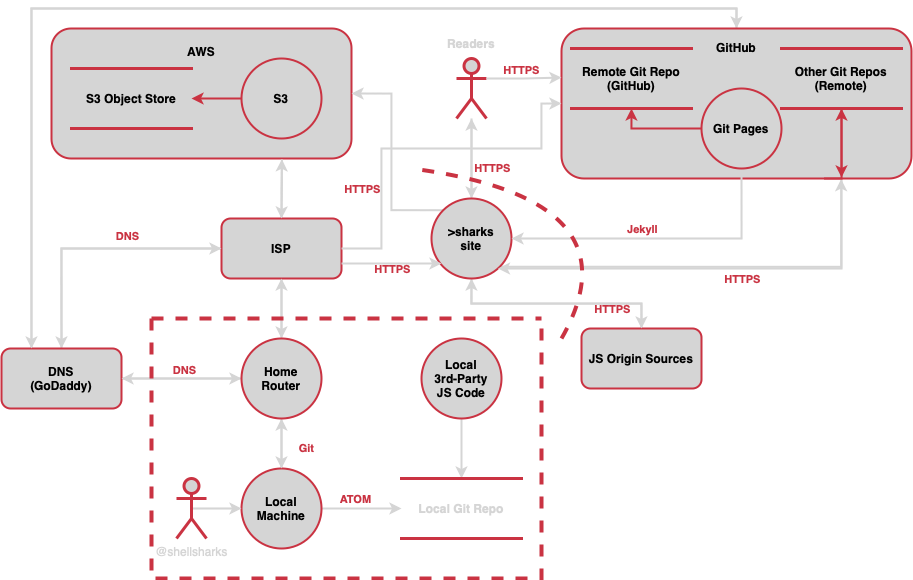
As I mentioned earlier, this is but one way to create a DFD for a threat modeling exercise. For another take, check out this awesome threat model DFD from Synopsys!
* Note: I’m planning on adding a much better DFD in future developments to this guide - more akin to the Synopsys one. Stay tuned!
Threat Modeling Methodology Matrix (TM3)
* Note: In future updates to this guide, I plan on adding a comprehensive matrix (dubbed, “TM3”), mapping the characteristics & capabilities of all methodologies within this guide. This matrix will be reminiscent of the comparison table sourced from the ThreatModeler site. 17
Tooling
There are a number of tools built for (or can be used for) threat modeling. Listed below are some of these tools. 19
- Microsoft Threat Modeling Tool - Leverages STRIDE to categorize threats and simplify security conversations.
- OWASP Threat Dragon - Supports STRIDE & LINDDUN.
- ThreatModeler (commerical)
- pytm
- Trike
- Draw.io - Not specifically a threat modeling tool but can be used to create threat models anyways.
- Threagile - Open-source toolkit which enables teams to execute Agile threat modeling.
- Cairis
- IriusRisk (commerical)
- SecuriCAD (commerical)
- Tutamantic (commerical)
- threatcl - threat modeling configuration language with hcl
- Threats Manager Studio
- threatspec
- Diagrams-as-Code - C4 model, Mermaid, Structurizr, Minigrammer, PlantUML
- Attack Tree Tools: ADTool, AT-AT, Ent, SeaMonster, AttackTree+, SecuriTree, RiskTree, Deciduous
* Note: In future updates, I will post some hands-on walkthroughs / reviews / analysis of some of these tools. Stay tuned!
Terminology
This sections lists some useful terminology used across this guide. 6,20
- Abuse Case - Deliberate abuse of a use case in order to produce unintended results.
- Access Control Matrix - A table in which each row represents a subject, each column represents an object, and each entry is the set of access rights for that subject to that object.
- Asset - Data, physical object or other resource of value.
- Attack - An action taken that utilizes one or more vulnerabilities to realize a threat (i.e target + attack vector + threat actor).
- Attack Graph - The set of all interconnected attack trees for a system.
- Attack Libraries - A library of known attacks (e.g. CAPEC).
- Attack Surface - Any logical or physical area that can be obtained, used or attacked by a threat actor.
- Attack Tree - A tree of attacks, rooted by a threat, comprised of all the ways that the threat can be realized.
- Attack Vector - Point and channel for which attacks travel.
- Control - A safeguard or countermeasure prescribed for an information system or an organization designed to protect the confidentiality, integrity, and availability of its information and to meet a set of defined security requirements.
- Countermeasure - See Control.
- Data Flow - A link between two processes or a process and a data store.
- Data Flow Diagram - Visually describes the processes, data stores and data flows of a system.
- Data Store - Any location where data is persisted in a system.
- Enchiridion - Latin for “manual”
- External Interactor - A process which is outside the scope of the system.
- Impact - Value / measure of damage sustained via an attack.
- Impetus Exemplar - Latin for “attack model / pattern”
- Mitigation - Something which prevents or reduces the damage of an attack.
- OWASP Threat Modeling - Four-question framework from OWASP which resembles the Threat Modeling Manifesto.
- Process - Any location where work is done on data in a system.
- Process Flow Diagram - A type of flowchart that illustrates the relationships between major components.
- Risk - A measure of the extent to which an entity is threatened by a potential circumstance or event, and typically a function of: (i) the adverse impacts that would arise if the circumstance or event occurs; and (ii) the likelihood of occurrence.
- Security Requirements - Requirements levied on an information system that are derived from applicable laws, Executive Orders, directives, policies, standards, instructions, regulations, or procedures, or organizational mission/business case needs to ensure the confidentiality, integrity, and availability of the information being processed, stored, or transmitted.
- System - The entire application, as defined by the scope of the threat model or audit.
- Threat - A potential occurrence, malicious or otherwise, which might damage or compromise an asset. Also defined as the cross-section of attacker intent, capability and opportunity.
- Threat Actor - Adverse caller of use or abuse cases.
- Threat Model - See intro to threat modeling.
- Threat Tree - see Attack Tree.
- Traceability Matrix - A traceability matrix examines a threat agent. 10
- Trust Boundary - Encloses a region where all actions occur at the same level of privilege.
- Vulnerability - An unmitigated path of an attack tree from the root node (threat) to a leaf.
- Weakness - A security issue in a system.
References
- 1 Threat Modeling Manifesto
- 2 Threat Modeling | Synopsys
- 3 Microsoft Threat Modeling
- 4 STRIDE | Microsoft
- 5 DREAD | Microsoft
- 6 Real World Threat Modeling Using the PASTA Methodology | VerSprite
- 7 Cyber Intelligence Part 5: Cyber Threat Intelligence | Rob Lee
- 8 Diamond Model in Cyber Threat Intelligence | Chad Warner
- 9 Threat Modeling w/ PASTA: Risk Centric Threat Modeling Case Studies | OWASP AppSec EU Belfast
- 10 The 5 pillars of a successful threat model | Synopsys
- 11 Attack Trees | Schneier on Security
- 12 What are Attack Trees? | Amenaza
- 13 Operationally Critical Threat, Asset, and Vulnerability Evaluation (OCTAVE) Framework, Version 1.0
- 14 Trive v.1 Methodology Document [Draft]
- 15 LINDDUN: privacy engineering
- 16 LINDDUN framework
- 17 Threat Modeling Methodologies | ThreatModeler
- 18 Application Threat Modeling vs Operational Threat Modeling | ThreatModeler
- 19 Top 10 Threat Modeling Tools in 2021
- 20 NIST CSRC Glossary
- 21 NIST SP 800-154: Guide to Data-Centric System Threat Modeling
- 22 Threat Modeling Process | OWASP
- 23 Threat Assessment and Remediation Analysis (TARA) | MITRE
- 24 IDDIL/ATC | Lockheed Martin
- 25 Hybrid Threat Modeling Method (hTMM) | SEI
- 26 Privacy-by-Design Based on Quantitative Threat Modeling (QTMM)
- 27 The Security Cards
- 28 DREADful | David LeBlanc
- 29 How Well Do You Know Your Personae Non Gratae
- 30 Compliance and Regulatory Frameworks | Rapid7
- 31 Governance and Regulatory Compliance
- 32 INCLUDES NO HEALTH | omada health
- 33 Continuous Threat Modeling (CTM) | Autodesk
- 34 A Process for Threat Modeling of Large-Scale Computer Systems | KTH
- 35 OTM: Organizational Threat Model | VerSprite
- Awesome Threat Modeling | Github
- GitHub - How we threat model
- Threat Modeling | OWASP
- Threat Modeling: 12 Available Methods | Software Engineering Institute
- Cyber Threat Modeling: Survey, Assessment, and Representative Framework | MITRE
- Threat Modeling: Designing for Security
- SECURITY THREAT MODELING AND ANALYSIS: A GOAL-ORIENTED APPROACH
- Security Quality Requirements Engineering (SQUARE) Technical Report
- Evaluation of Threat Modeling Methodologies: A Case Study
- Threat Agent Risk Assessment (TARA) | Intel
- Invincea Threat Model - An Adversary Model for Mastering Cyber-Defense Strategies
- Simone On Security - Threat Modeling-heavy blog resource
- Evolving Threat Modeling for Agility and Business Value
- MORDA: Mission Oriented Risk and Design Analysis of Critical Information Systems
- The B-MAD Approach to Threat Modeling
- Threat Modeling Redefined: The Self-Serve Threat Model | Segment (Utopia)
- Uncover Security Design Flaws Using the STRIDE Approach
- Assorted threat modelling methods | arnepadmos
- Threat Modeling Connect