COMPATIBILITY: Chart works only with Sketch 56 or higher.
Chart is a plugin for Sketch, Figma, and Adobe XD. Try Chart to save yourself hours of manual, tedious work, and create a graph with real or random data in seconds. It's easy to make, edit, and customize different types of graphs. Chart supports copy-paste from editors like Excel, Numbers, Google Sheets, live connection with Google Sheets and remote JSON (REST API), local CSV and JSON files.
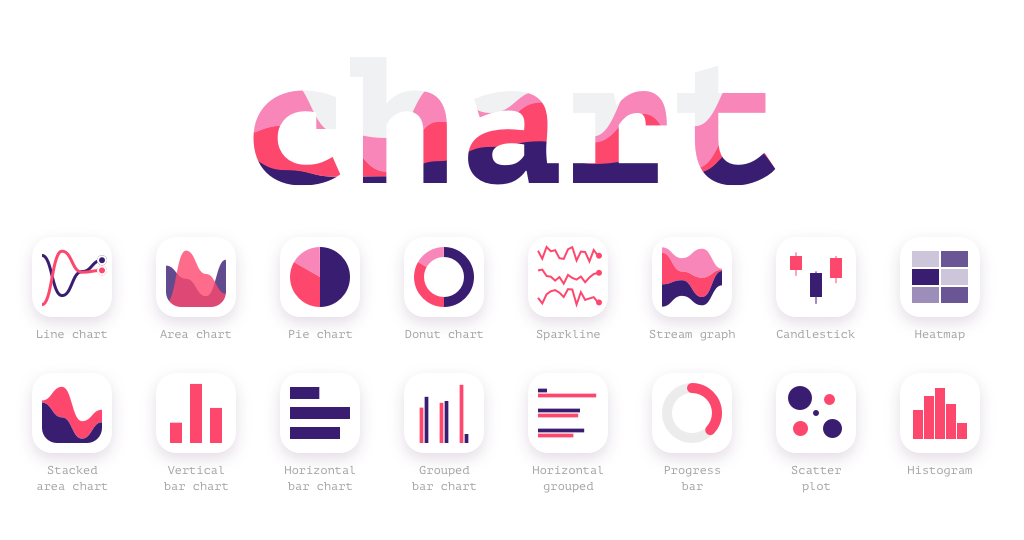
16 the most popular chart types out-of-the-box. Didn't find one you want? Just let me know, and I will add it to the collection.
- Pie chart
- Line graph
- Vertical bar graph
- Horizontal bar graph
- Candlestick chart
- Donut chart
- Area chart
- Grouped bar chart
- Sparkline
- Stacked area chart
- Stream graph
- Horizontal grouped bar chart
- Progress bar
- Scatterplot
- Histogram
- Heatmap
Chart helps you to visualize data from any source you have.
Tabular data: Google Sheets, Excel, Numbers and CSV files are supported. You can copy/paste, upload or link data. How to use tabular data
JSON data: connect live API via HTTPS link, that responds with valid JSON or just upload file from your computer. How to use JSON
Random data: if you do not have a real data set, you can create any type of chart with random data provided by Chart. Create a simple chart
Apply a custom color palette, change line thickness, and bar width. Sync with product guidelines and use local or global settings to apply a consistent style.
Download and install Chart and start with two chart types for free. Pay just $20/year to unlock all charts and save yourself hours of boring work.
Visit Chart promo page or reach me out on Twitter. We'll be happy to see you in our community in Slack, where we have inspiring designers from top tech companies like Google, Microsoft, and Netflix and share all our news and updates.
“Using the Chart plugin connected to live data, and style templates has allowed us at Cisco to experiment and build our data visualization system in record time!” Kevin Smith, Cisco
“Chart was the only tool I could find for Sketch that let me create data visualizations with my own data. The integration is what makes it awesome!” Jason Barrie, SparkPost
“Chart has helped me to show real data in my prototypes in just a few clicks. Pavel's support is also amazing!” Dries De Schepper, Deloitte Digital
“Chart has radically reduced the amount of time I've needed to spend creating various charts and graphs for prototypes. Being able to use real data to build them from is hugely helpful!” Eric Guess, FM Systems
“I work on an application that has a lot of charting features. Often, designing these charts have been a laborious process but Chart has allowed me to cut my time down significantly” Jamie, Copperleaf
“It's really awesome. It has speed up my design process in a way that I don't have to even think about the technical implementation of the visualization anymore. I only focus on the content now. Revision are no problem. I can update the chart in a few minutes.” Matt Bogado, VMware
