Report developers and users of the End-User Report Designer may already be familiar with the Report Gallery that allows you to store and reuse certain report parts, including visual styles, report controls, or entire reports and data sources.
So far, this functionality has been available in the WinForms Report Designer, but with v19.1 we are bringing it to WPF. At the same time we used your feedback to extend the functionality on both platforms: you can now store report bands together with their content.
Note that the HTML5/JS Report Designer does not support the Report Gallery at this time. Please see the survey at the end of this post to add your vote for this feature and help us define priorities.
Overview
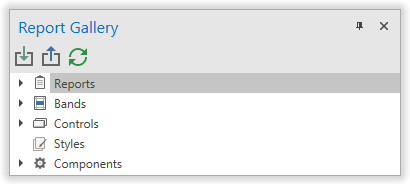
The WPF Report Designer now ships with the Report Gallery panel that provides Import and Export commands in the toolbar and includes the node Bands for the new Band Templates.

To add a report item to the gallery, right-click it in Report Explorer or on the report design surface and select Add To Gallery:
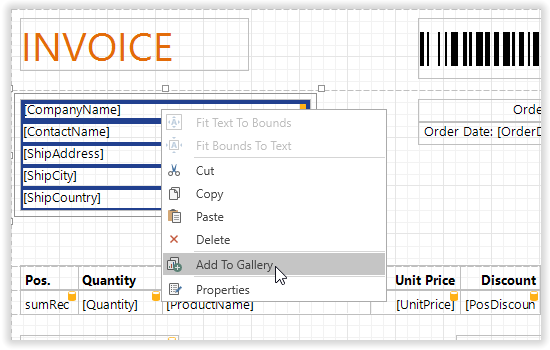
Note that you can copy, paste, remove and rename gallery items as required.
Using the toolbar commands you can import and export gallery items to XML files as a backup or to share with others. You can implement your own database or file storage for end-user reporting applications and enable the property ReportGalleryExtension.EnableSynchronization. Application users can then click the Refresh button on the toolbar to synchronize gallery items. This makes it easy to share Report Gallery content between application users. There are even features included to handle cases of accidental deletion.
Band Template Specifics
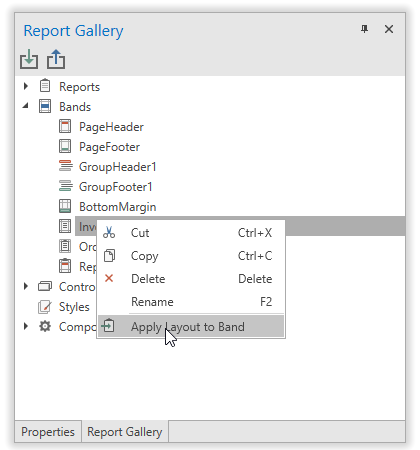
As explained above, the Report Gallery can now store band templates. Use cases for this feature include standard report headers or footers, and default disclaimer text. Once you have stored a band, you can add it back into a report in two ways:
- Select a band in your new report, right-click a band template in the Report Gallery and select Apply Layout to Band. This action replaces the current content of the target band. Note that the type of the target band must be the same as that of the band used to save the template.
- You can drag and drop band templates directly from the Report Gallery. When you hover the mouse over an appropriate target band, a green outline indicates compatibility and you can drop the template to apply it. If you drop a band template on a band delimiter, a new band is inserted based on the template.
In the animated illustration above, you can see that drag&drop operations now provide new visual effects when a container is highlighted. We implemented similar effects for all drag&drop actions related to the Field List, the Report Explorer (styles, components) and the Toolbox.
Here is another animation that shows these new effects:
Your Feedback Counts
We are interested to hear your thoughts about the new features. Please submit the survey below, and feel free to leave comments on this post or open Support Center tickets for further discussion.
Webinar
Please use the link below to register for our upcoming Dashboards and Reporting webinar, where all new features of the v19.1 release are demonstrated.
Register for the Dashboards and Reporting Webinar
Free DevExpress Products - Get Your Copy Today
The following free DevExpress product offers remain available. Should you have any questions about the free offers below, please submit a ticket via the
DevExpress Support Center at your convenience. We'll be happy to follow-up.