In the field of software testing, many new technologies, tools and test methods have emerged in recent years. Especially in the process from the beginning to the end-user, many new test principles and test tools have been developed for the acceptance tests of our application. We briefly define these tests and test approaches as functional tests. One of the biggest factors in making an application with as few bugs as possible is that functional tests can touch many parts of the application. However, the number of users in the applications has increased significantly. Increasing user numbers have made it very difficult for an application to work stably under high load. For this reason, the need to apply performance tests of applications as well as our functional tests arose. We define these tests as non-functional tests.
When testing applications, there is a need for non-functional tests in addition to Functional tests. When examined in detail, it takes sufficient time to create functionality tests of the application and the remaining short time prevents the application from performing non-functional tests such as performance effectively. To manage the time spent on performance tests, simpler, target-oriented and critical points are handled in the application.
In some cases, performing performance tests alone may not be the solution. In this case, it is critical to interpreting the reports of the test performed correctly. The k6 load test framework, supported and developed by Grafana Labs, a very common monitoring software, has taken these performance test reports to a different dimension.
What is k6?
k6 is a modern open-source load testing tool from Grafana Labs. It can be integrated with many CI/CD tools as well as protocols like REST, GraphQL, and gRPC. k6 helps you create performance tests such as stress tests and load tests.
How does it work?
(here k6 must be installed on your system, click for installation)
The biggest gain is time!
Actually, k6 is javascript-based. With a simple syntax built using javascript, you create your performance test script and run it in the CLI. Since it is based on Javascript, it offers a flexible, manageable, and uncomplicated structure. Here is a simple example.
import http from 'k6/http';
import { sleep } from 'k6';
export default function () {
http.get('https://httpbin.org/');
sleep(1);
}
You can use the CLI to run this Javascript-based k6 script:
k6 run script.js
Then you will see that the tests are running. Here is a report that k6 provides by default. It just specifies the HTTP response times and properties of the load test script you create. In the following sections of our article, I will explain how you can customize the reports.

Virtual User & Duration
One of the purposes of load tests is to measure how the system responds in different usage scenarios. In this case, you can add or change parameters such as the number of incoming users and the duration of the test. If you run it as follows, you will make the test more meaningful.
k6 run --vus 10 --duration 30s script.js
You were able to run your test by changing the configuration of your test using the CLI without changing your test script. As the output shows, k6 ran your tests for 10 users and 30 seconds.

You can also choose to manage through the script you created; simply use:
import http from 'k6/http';
import { sleep } from 'k6';
export let options = {
vus: 10, //
duration: '30s',  10 user looping for 30 seconds
};
export default function () {
http.get('https://httpbin.org/');
sleep(1);
}
After specifying the parameters, you can run it again with the first command you used in the terminal;
k6 run script.js

You were able to run the same parameters by changing your test script. As the output shows, k6 ran your tests for 10 users and 30 seconds.
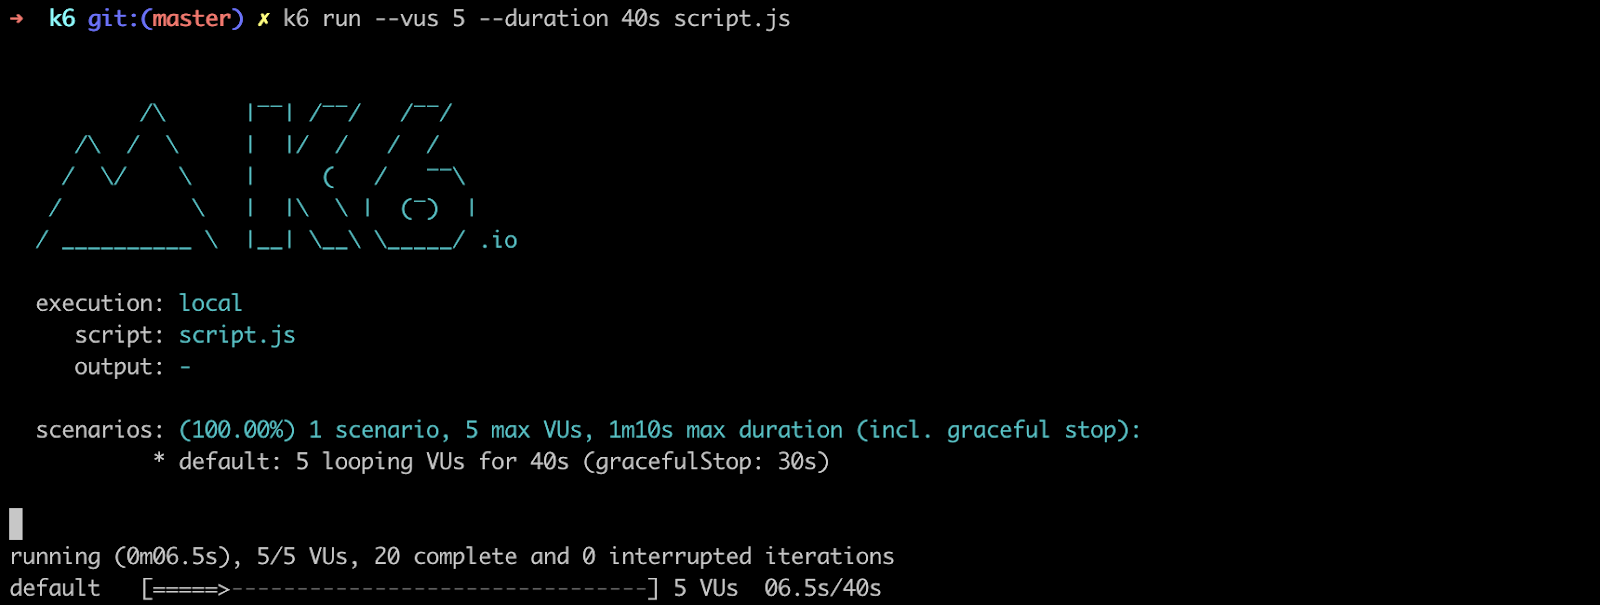
In addition, even if you have added options in your script, you can edit the configurations with the CLI.
k6 run --vus 5 --duration 40s script.js
Also, in some cases, you can ask your tests to behave differently for a certain time period. To do this, you can use the stages block to change behaviors at different periods during the test.
import http from 'k6/http';
import { sleep } from 'k6';
export let options = {
stages: [
{ duration: '3s', target: 15 }, // ramp up to 15 users
{ duration: '5s', target: 25 }, // ramp up to 25 users
{ duration: '3s', target: 5 }, // ramp up to 5 users
],
};
export default function () {
http.get('https://httpbin.org/');
sleep(1);
}
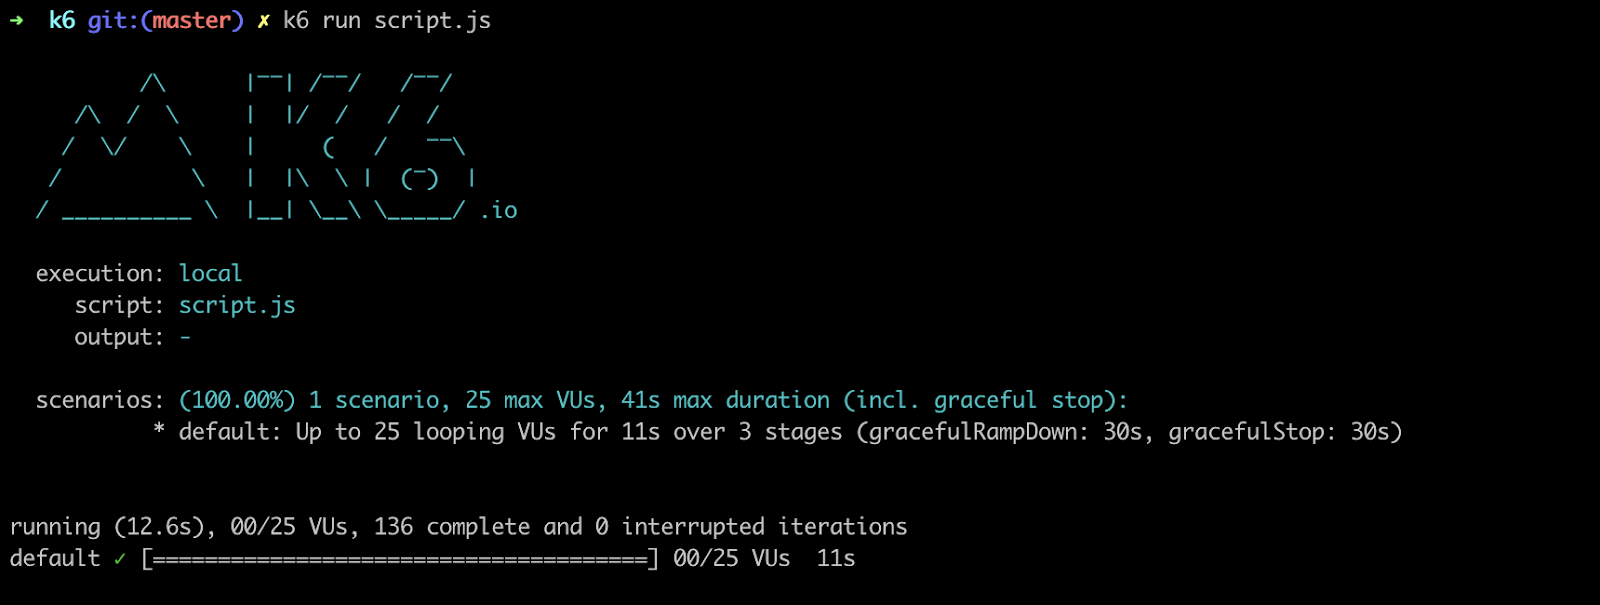
Here I showed 3 different behaviors with a single test script. It can be a feature that you can use frequently when doing Stress Testing.
Execution
k6 offers three different execution models: local, cloud and clustered.
Local model runs on any server or on your own device, cloud model runs your tests using the k6 cloud infrastructure on the cloud. The clustered way of running has not been developed yet.
We have explained the local part in the previous parts of our article.
You don't need to add any configuration or code to run cloud tests. After registering app.k6.io/, connect to the k6 cloud by running the token there in your own CLI. Change the execute command after your connection is successful. You can also use this token in CLI by providing tokens via k6 cloud.
k6 login cloud -t 6c898ce723bdbf0ae1c4ea01f53add13a6c720a7465a3e83324c9c3454edbb0f
k6 cloud script.js

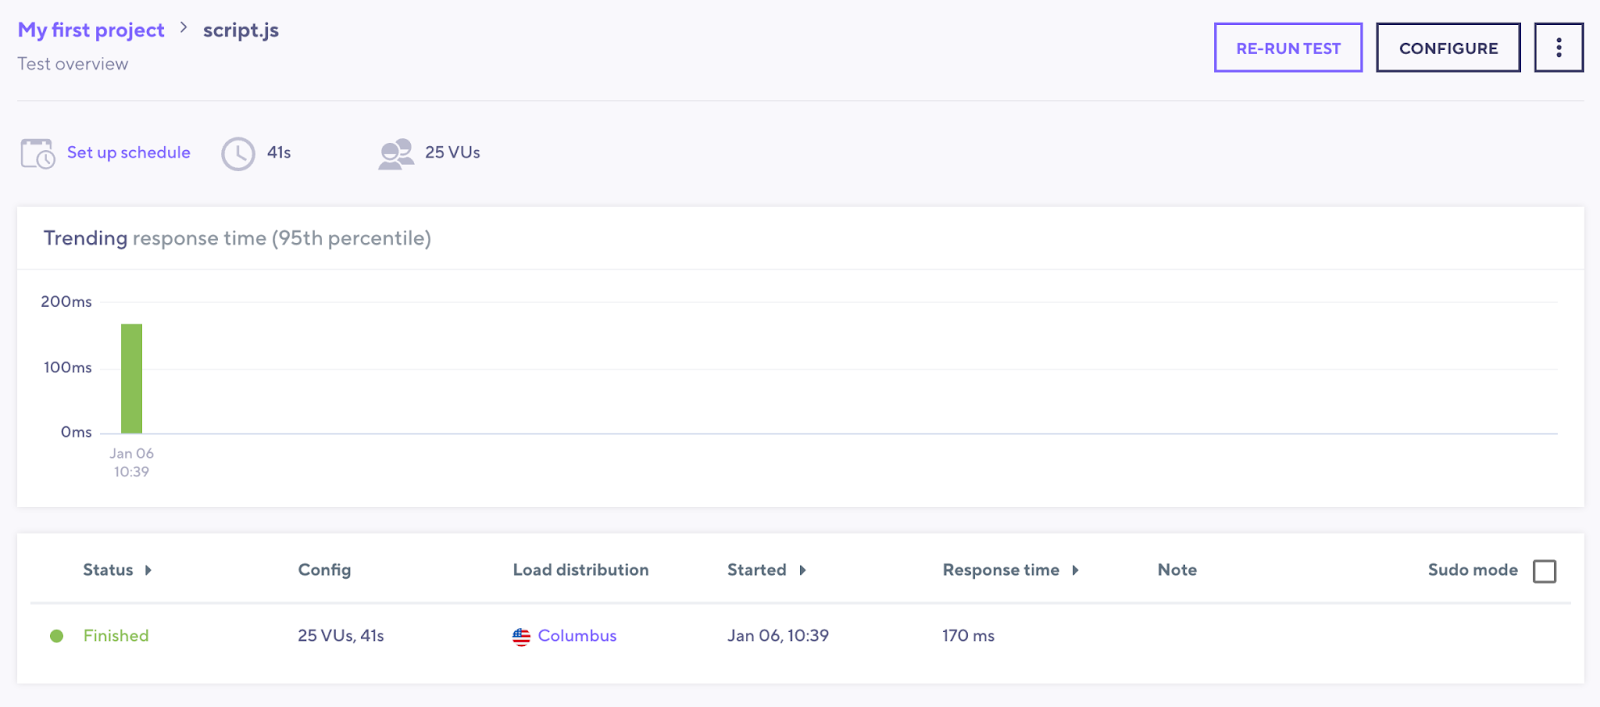
When you run your tests, you will see that your test report is generated on your app.k6.io panel.

You can run your tests again, change the configurations and make them work as planned through the cloud panel provided by k6.
Reporting
k6 can display the outputs of a load test in three different ways: as a summary on the terminal at the end of tests, as reports on the cloud, or as reports on other tools such as Grafana and InfluxDB.
You can access a more detailed performance test report in the k6 cloud interface, where various metrics and request/response times are displayed visually.


You can use the --out parameter to get the report output in various ways. Here, we can produce outputs such as JSON, CSV, as well as metric tools such as Grafana, InfluxDB.
k6 run script.js —out influxdb=http://kloia.com:8186
Standard output; The load test includes the number of users, how long it took, detailed http reports. also to output data types such as JSON, CSV as standard output
It can be executed as --out json=test.json or --out json=test.csv
k6 run script.js —out json=test.json.
Tools you can use for reporting;
- Amazon Cloud Watch
- Apache Kafka
- Grafana Cloud / Prometheus
- InfluxDB + Grafana
- StatsD
- Datadog
Conclusion
k6 can be the right solution for you as it has many features such as detailed analysis, report grouping, recording and playback, cloud maintenance. In addition, also be easily integrated into monitoring and CI/CD processes.
Check out k6 on https://k6.io/ to much more than what we've covered here.