
 The Samsung 860 EVO 1TB is the mid-range capacity model of the company’s newest consumer SSD line, which was announced concurrently at CES 2018 with the Samsung 860 PRO. Like the previous generations of this immensely popular line, Samsung’s new 860 EVO SSDs are designed for general desktop use cases and those who won’t be going too far in queue depths.
The Samsung 860 EVO 1TB is the mid-range capacity model of the company’s newest consumer SSD line, which was announced concurrently at CES 2018 with the Samsung 860 PRO. Like the previous generations of this immensely popular line, Samsung’s new 860 EVO SSDs are designed for general desktop use cases and those who won’t be going too far in queue depths.
Though the 860 EVO lines use the same 3bit MLC 3D V-NAND as the previous generation, Samsung has outfitted their new SSDs with an updated Samsung MJX controller. It also comes in a M.2 form factor option with a maximum capacity of 2TB. Samsung also quotes a slight improvement in performance numbers with speeds of 550MB/s read and 520MB/s write as well as a TurboWrite buffer size increase to 78GB from 12GB. Unfortunately, in our review of 500GB model back in January, we found the new EVO drive to be a somewhat of a disappointing release for its price/performance level. This misstep was surprising to say the least.
The Samsung 860 EVO is backed by a 5-year limited warranty and is priced at $94.99, $169.99, $329.99, $649.99, and $1,399.99 for the 250GB, 500GB, 1TB, 2TB, and 4TB, respectively.
Samsung 860 EVO Specifications
| Form factor: | 2.5-inch |
| Interface: | SATA: 6 Gbps |
| NAND: | Samsung 3D V-NAND 3bit MLC |
| Capacities: | 4TB, 2TB, 1TB, 500GB, 250GB |
| Cache: | 4GB LPDDR4 (4TB) |
| 2GB LPDDR4 (2TB) | |
| 1GB LPDDR4 (1TB) | |
| 512MB LPDDR4 (250/500GB) | |
| Controller: | Samsung MJX Controller |
| Performance | |
| Seq.Read/Write Speed: | Up to 550/520MB/s |
| Ran.Read/Write Speed (QD32): | Max. 98K IOPS / 90K IOPS |
| Device Sleep: | 2.6 mW for 1TB (Up to 8mW for 4TB) |
| Management SW: | Magician Software for SSD management |
| TBW (Endurance): | 4TB: 2,400 TBW |
| 2TB: 1,200 TBW | |
| 1TB: 600 TBW | |
| 500GB: 300 TBW | |
| 250GB: 150 TBW | |
| Warranty: | 5 years or up to 2,400 TBW |
Design and Build
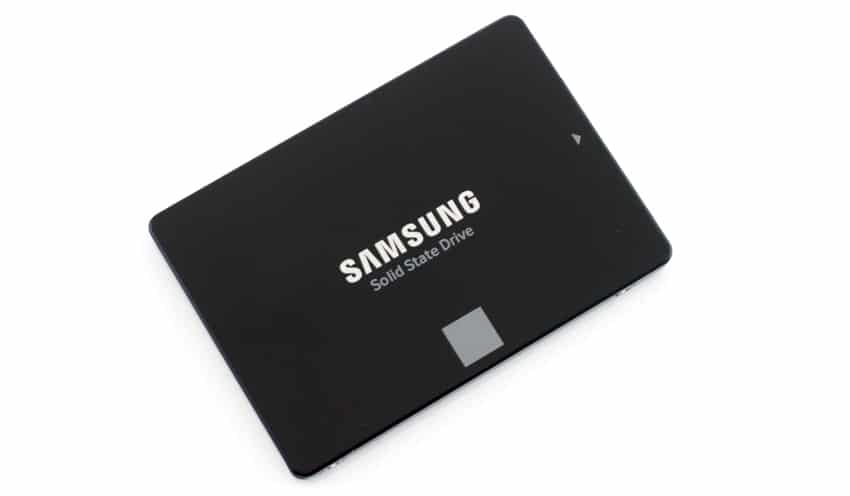
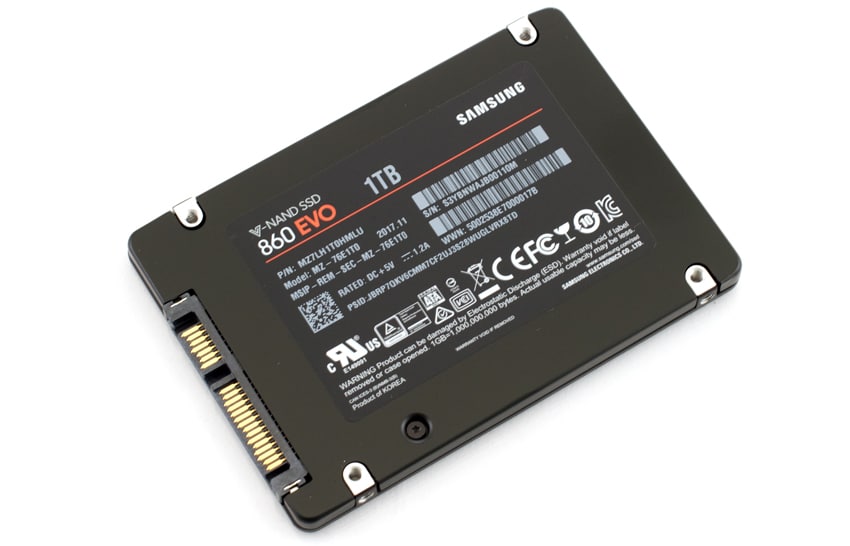
The new 860 EVO line is identical to previous EVO lines, that is, a black case and a light gray square displayed on the bottom middle under the Samsung logo. A sticker is placed on the back of the drive, which indicates information you might need including model number, serial number, and capacity.
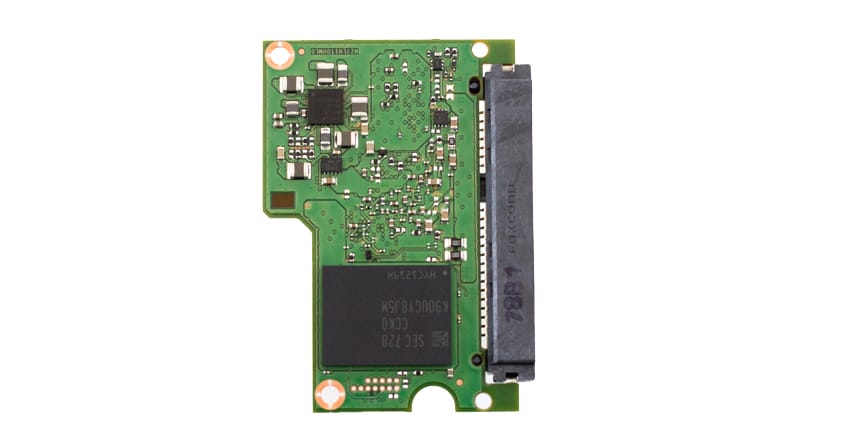
When opening up the drive, you will see the new Samsung’s new MJX controller, NAND pack, and DRAM on the small PCB.
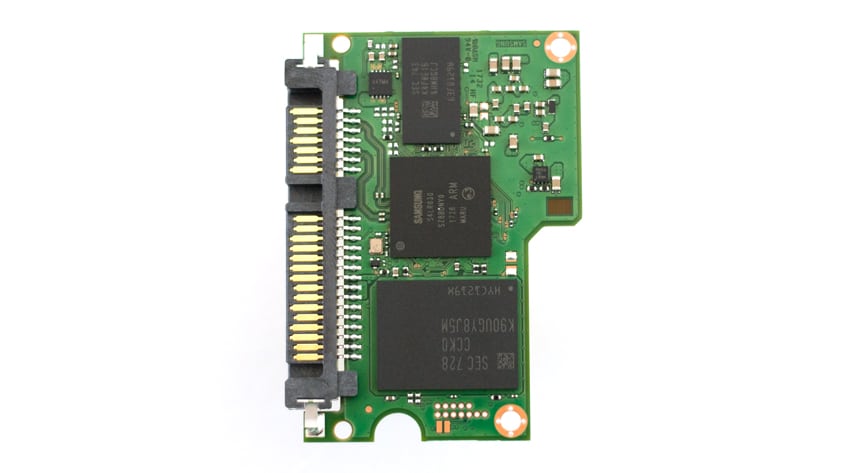
Flipping the PCB over shows the other NAND pack.
Performance
Testbed
The test platform leveraged in these tests is a Dell PowerEdge R740xd server. We measure performance through a Dell H730P RAID card inside this server, although we set the card in HBA mode only to disable the impact of RAID card cache. The methodology used better reflects end-user workflow with the consistency, scalability and flexibility testing within virtualized server offers. A large focus is put on drive latency across the entire load range of the drive, not just at the smallest QD1 (Queue-Depth 1) levels. We do this because many of the common consumer benchmarks don’t adequately capture end-user workload profiles.
SQL Server Performance
We use a lightweight virtualized SQL Server instance to appropriately represent what an application developer would use on a local workstation. The test is similar to what we run on storage arrays and enterprise drives, just scaled back to be a better approximation for behaviors employed by the end user. The workload employs the current draft of the Transaction Processing Performance Council’s Benchmark C (TPC-C), an online transaction processing benchmark that simulates the activities found in complex application environments.
The lightweight SQL Server VM is configured with three vDisks: 100GB volume for boot, a 350GB volume for the database and log files, and a 150GB volume used for the database backup we recover after each run. From a system resource perspective, we configure each VM with 16 vCPUs, 32GB of DRAM and leverage the LSI Logic SAS SCSI controller. This test uses SQL Server 2014 running on Windows Server 2012 R2 guest VMs, and is stressed by Dell’s Benchmark Factory for Databases.
SQL Server Testing Configuration (per VM)
- Windows Server 2012 R2
- Storage Footprint: 600GB allocated, 500GB used
- SQL Server 2014
- Database Size: 1,500 scale
- Virtual Client Load: 15,000
- RAM Buffer: 24GB
- Test Length: 3 hours
- 2.5 hours preconditioning
- 30 minutes sample period
When looking at SQL Server Output, the 1TB Samsung 860 EVO drive recorded 3,147 TPS, which was just behind the 850 PRO 1TB.

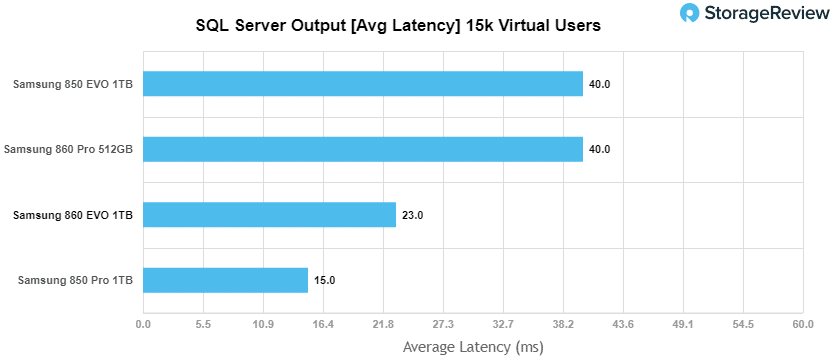
In average latency, the 1TB Samsung 860 EVO again boasted solid performance with an average latency of 23.0ms.
VDBench Workload Analysis
StorageReview has rolled out an updated assortment of tests for end-user SSDs, which are designed to look more at IOPS or throughput in relationship to latency. These benchmarks have been honed at a much larger scale for enterprise drives; for client SSDs, we decrease the loads to more common workload sizes. Testing is done within VMware ESXi 6.5 with a 20GB test footprint, comprised of two 10GB vdisks that are placed onto a datastore presented off the SSD under load. The test platform leveraged in these tests is a Dell PowerEdge R740xd server. We measure performance through a Dell H730P RAID card inside this server, although with the card set in HBA mode only to disable the impact of RAID card cache. The methodology used better reflects end-user workflow with the consistency, scalability and flexibility testing within virtualized server offers.
While not a perfect representation of actual workloads, synthetic tests do help to baseline storage devices with a repeatability factor that makes it easy to do apples-to-apples comparison between competing solutions. These workloads offer a range of different testing profiles of common transfer sizes. We’ve also included new VDI workload profiles. With local hypervisors installed such as VMware Fusion, Parallels or even ESXi, many end users are starting to see I/O workflows similar to a multi-tenant environment. This is especially true for heavy users that run several apps and browser tabs simultaneously.
All of these tests leverage the common VDBench workload generator, with a scripting engine to automate and capture results over a large compute testing cluster. This allows us to repeat the same workloads across a wide range of storage devices.
Profiles:
- 4K Random Read: 100% Read, 128 threads, 0-120% iorate
- 4K Random Write: 100% Write, 64 threads, 0-120% iorate
- 64K Sequential Read: 100% Read, 16 threads, 0-120% iorate
- 64K Sequential Write: 100% Write, 8 threads, 0-120% iorate
VDI Traces
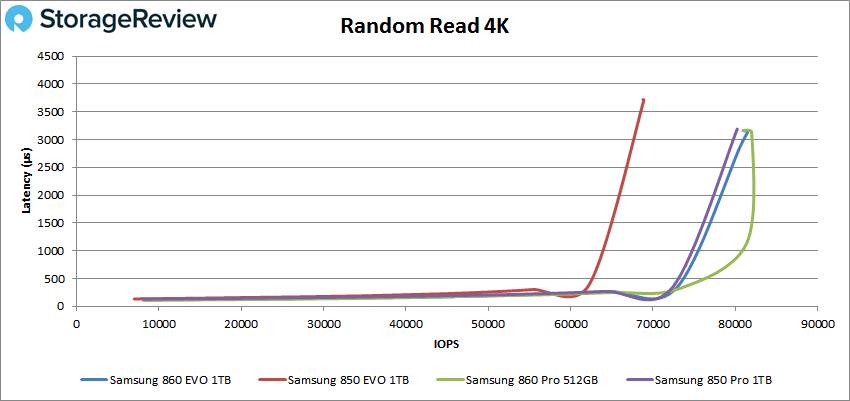
Looking at 4k peak read performance, the 1TB 860 EVO performed with sub-millisecond latency until around 80,582 IOPS and peaked at just under 82,014 IOPS with a latency of 3.12ms. This places it in second spot with a near identical peak performance as the 860 PRO 512GB.
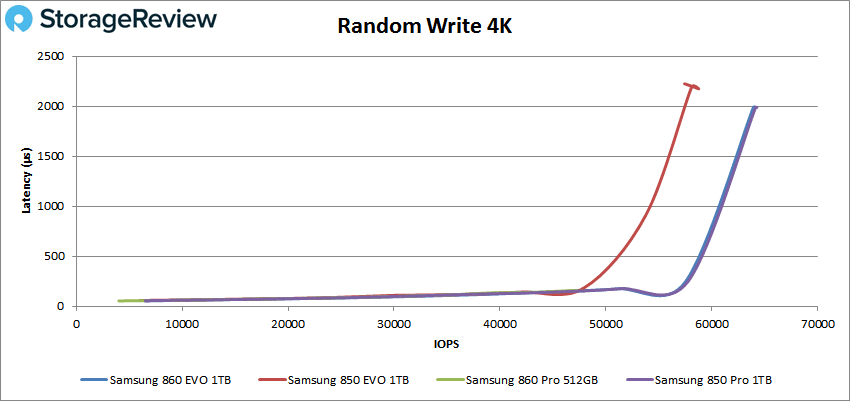
In peak 4k write performance, all SSDs (with the exception of the Samsung 850 EVO 1TB) virtually identical results. Here, the 1TB 860 EVO had sub-millisecond latency performance until approximately 63,143 IOPS while peaking at 64,268 IOPS with 1.98ms.
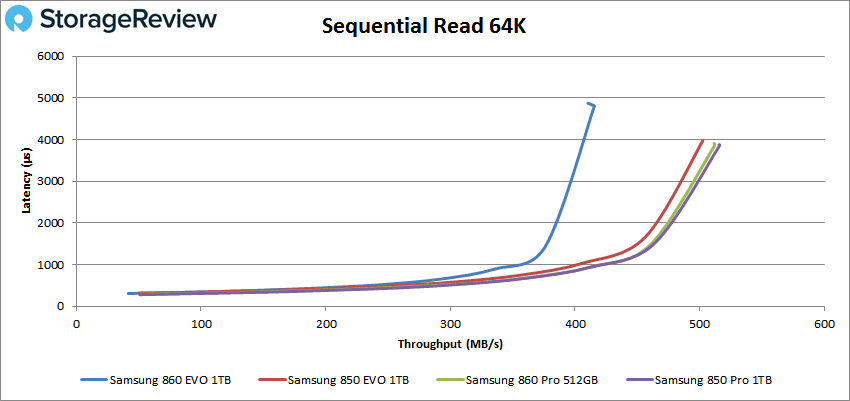
Moving to sequential 64K peak read, the 1TB 860 EVO had sub-millisecond latency performance up until around 6,016 IOPS or just over 376MB/s bandwidth. The drive peaked at 6,650 IOPS at 4.81ms latency and a peak bandwidth of 415.6MB/s. This placed the drive in last place among the comparables.
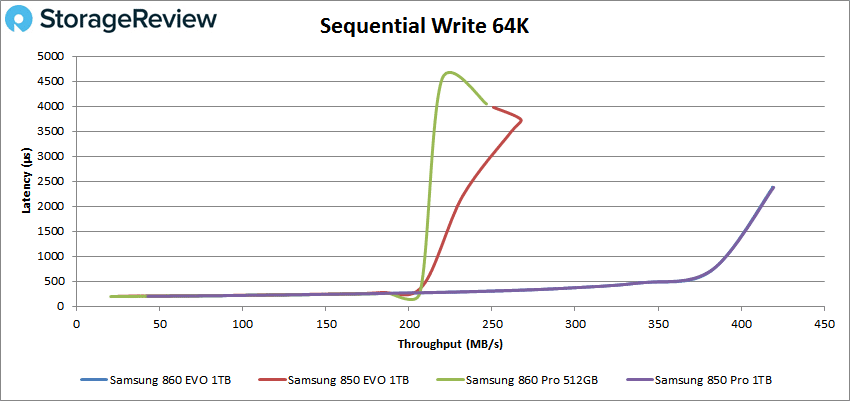
Moving on to sequential 64K peak write, the 1TB 860 EVO had identical results with Samsung 850 Pro 1TB. Here, it remained under 1ms until it hit about 6,200 IOPS or roughly around 382MB/s bandwidth, peaking at 6,705 IOPS and 2.40ms latency with a bandwidth of 419.1MB/s. Again, this performance was virtually the same as the 1TB 850 PRO.
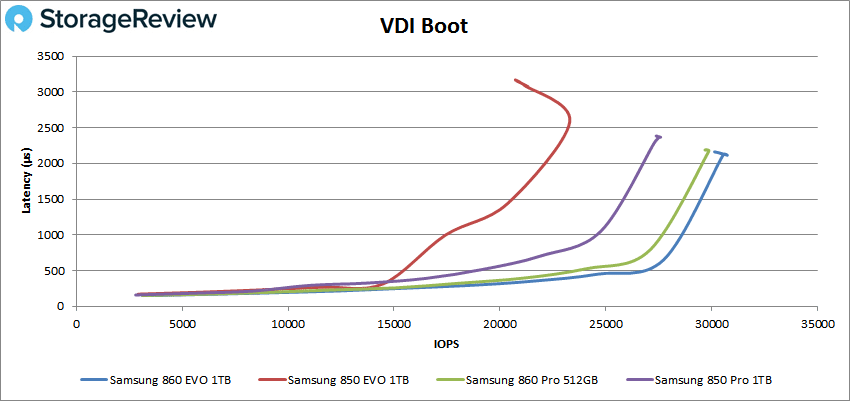
Next, we look at VDI including Boot, Initial Login, and Monday Login. In our VDI Boot benchmark, the Samsung 1TB 860 EVO was top-performing SSD with a sub-millisecond latency performance until 30,551 IOPS while peaking at 30,740 IOPS with 2.11ms latency.
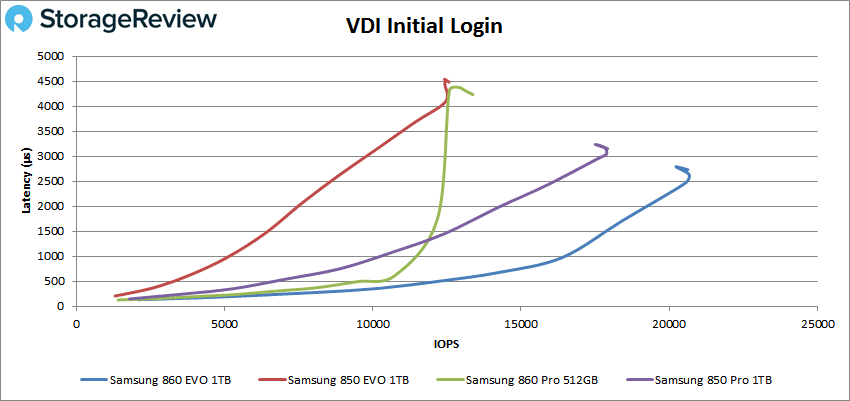
The Samsung 1TB 860 EVO continued its dominance with the VDI Initial Login benchmark. Here, we saw the new EVO with sub-millisecond performance until about 16,386 IOPS with the drive peaking at 20,669 IOPS and 2.63ms latency.
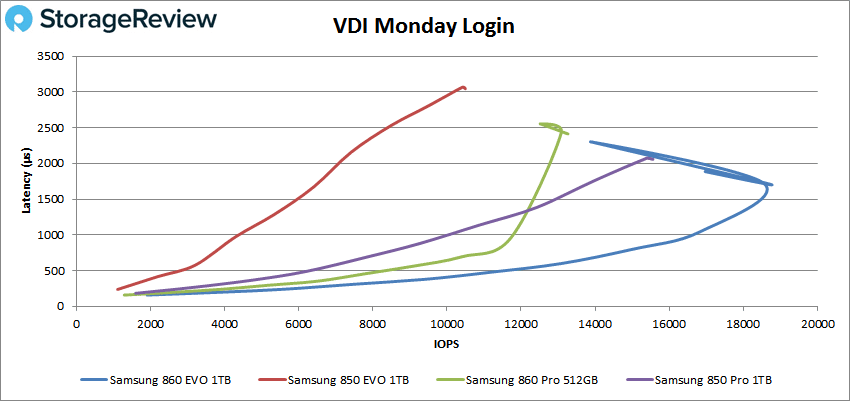
As you can see, results of VDI Monday login showed uneven performance. The new Samsung EVO SSD made it to approximately 16,819 IOPS with less than 1ms in latency while peaking at 18,693 IOPS with 1.71ms.
Conclusion
The EVO 860 is Samsung’s latest family of end-user consumer SATA SSDs, quoting a minor improvement in performance (550MB/s read and 520MB/s write) and better endurance while featuring a new controller and intelligent TurboWrite technology. The 860 EVO comes in the usual capacity range of 250GB to 4TB; however, the latter size is priced at $100 less than what Samsung listed the 850 EVO for a year ago.
As we mentioned above, the 500GB model was a performance slipup for Samsung, as the drive fell flat under performance-heavy workloads. This was certainly surprising, as new Samsung products usual set a new bar in end-user SSD performance for the past several years. The 1TB model thankfully didn’t have the same disappointing results as its lower-capacity. In our test/dev SQL server benchmark, the EVO boasted a much better 3,147 TPS and an average latency of 23.0ms. On our VDBench test, the 1TB EVO had improved performance in our 4k random read (sub-millisecond latency until 80,582 IOPS and peaking at just under 82,014 IOPS and 3.12ms) and 64k sequential read (sub-millisecond latency performance up until around 6,016 IOPS and peaking at 6,650 IOPS and 4.81ms) as well. The rest of the VDBench showed general solid results, with the exception of the VDI Monday login benchmark.
Though the 1TB is certainly the better choice performance-wise, users would have to be willing to dive significantly deeper in their pockets with its $330 price tag. That said, consumers with typical desktop use cases (shallow queue depths) will probably be more than satisfied with both capacities. It’s just a matter of how much they’re willing to pay, which includes the new premium 860 PRO line.
Like we stated in the 500GB review, storage companies are finally reaching the limitations of the SATA interface, so you will likely start seeing a performance plateau in the near future. This means that, while you will see capacity increases in Samsung’s consumer drives, performance gains will be negligible.
Sign up for the StorageReview newsletter