Debugging with Playwright
Of course you know how to do debug your tests. Everybody knows how to do it. But not everybody does it in the same way. Here are a few ways to debug your tests using playwright
Debug using Playwright trace viewer
One of the most commonly used method is to open the trace file using the playwrights trace viewer. Take the trace.zip file from your reports put it inside playwright folder or wherever you want, as long as you know the path to it and just type npx playwright show-trace path/to/trace.zip
But did you know that you can also:
- Read the trace file directly on https://trace.playwright.dev/ Just drag and drop the file there and you can view it in an instant, and don't worry, playwright will not store your trace files.
- You can open remote traces using it's URL. For example you run a CI, it publishes your reports at an url, and you just want to view the trace file without downloading it. Here is an example you can try
npx playwright show-tracehttps://adrianmaciuc.github.io/playwright-example-with-typescript/142/data/attachments/28c2d416a9f33195.zip. This is the failure if you want to see it published. By the way, I've wrote an article on how to publish your playwright reports on github pages for free. - You can also pass the URL of your uploaded trace file from some accessible storage as a parameter. CORS (Cross-Origin Resource Sharing) rules might apply. An example of such use case https://trace.playwright.dev/?trace=https://adrianmaciuc.github.io/playwright-example-with-typescript/142/data/attachments/28c2d416a9f33195.zip . Just replace whatever is written after https://trace.playwright.dev/?trace= with the direct link of your trace file.
Debug using Playwright VS Code extension
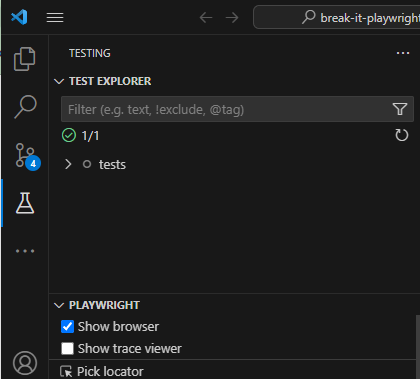
Playwright has one of the best integrations with VS Code. You can view your tests and run them from the Test Explorer section (the lab glass icon on the left) .
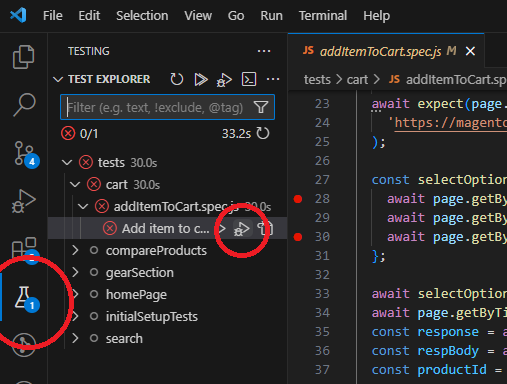
Put some breakpoints into the code you want the debugger to stop. Go to Test Explorer and click on the play button with the tiny bug on it (debug test)
But did you also know that:
While you are in debug mode you can view in real time all the steps your code will perform related to elements. You just click at the line of code you want to see and the browser will highlight the element it will attempt to perform action on. (this feature is not limited to debug mode only, see more details later in this article)
You can use watches during debug mode with the VS Code and check values in real time that come as response from your servers. You can even perform different operations or call methods and they will work. Just keep in mind that you can't do asynchronous stuff here. Only regular simple sync, like .toString() or any other.
Debug using Playwright inspector tool
That's right, Playwright even has its own debugging tool, called Playwright Inspector, if you want to give it a try. To use it you must give it the name of the file you want to debug by doing something like this npx playwright test path/to/testfile.spec.ts --debug . If for example you have multiple tests in the same file and you want just one single test, then give it also the line of the test like so npx playwright test path/to/testfile.spec.ts:27 --debug
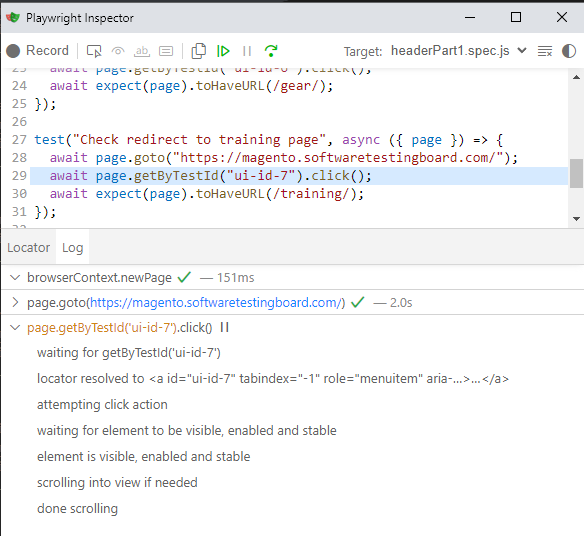
What I like the most about this inspector is the fact that it can show you what Playwright does under the hood. This can help you understand lots of things. As seen in the screenshot above, just for a simple click, Playwright does a lot of actions.
Leverage the features of Playwright debug mode to write tests really fast
First make sure that you have checked the show browser option in Test Explorer.
Now go to your tests, write the minimum code to open the web page you are about to write tests for and hit the green play button next to your test()
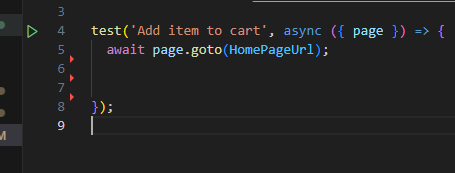
This will open the browser for you. Have it on one side (ideally a second monitor) and use it to write tests
Common errors you encounter with debug mode
playwright no tests have been found in this workspace yet
playwright vs code no tests found message
playwright framework issue no tests found
If you go to your Test Explorer and you see something like this
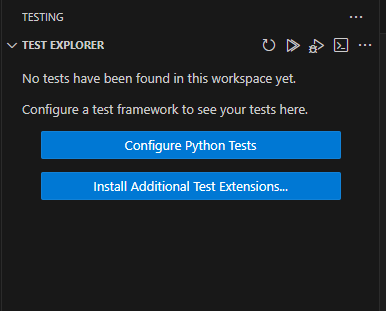
You can try any of these answers from here, but most of the solutions provided are dependencies related, either you need your latest version of VS Code or Playwright or just need to do a restart of VS Code. However I have not seen anywhere written that sometimes the tests are not there because, you the user, have misconfigured the framework. This tiny detail is almost always overlooked and can be a pain when you have a big project and at one moment someone pushed a commit that just made the tests disappear from the Test Explorer. So have a look at the playwright.config.js file and see if everything is in place, check each configuration value set, because if a value is wrong, your linter will not find it, and your tests disappear from test explorer.
From my experience here are the most common mistakes done in playwright config file that will have your tests disappear from Test Explorer:
testDir: "./path/to/tests"- does not point correctly to where the tests arereporter: "html23typo"- you played around with the reporter or any other property and you have set the value just wrong and do not match with any of the options accepted by the framework- you have a syntax error or a bad import into your files
As a side note, in this particular scenario, if you would have had a syntax error, or a misconfiguration, Cypress, will at least throw an error when you open its runner. I would love to see something like this in Playwright.
I was thinking to do an article about debugging in CI, but I am not sure if anyone would be interested. Please let me know in the comments below or on linkedin, if you would like to see how to debug like a pro in CI.
Hit the clap button if you found this useful. Or even buy me a coffee if you want to motivate me even more.


Comments ()