How much time or money would you spend to make 10% more salary? $10? $100? $1000? Hours? Days?
Many developers I know barely touch LinkedIn. They set up a profile, fill in some work experience and forget about it. They would rather be spending time on GitHub or StackOverflow than LinkedIn.
I’ve taken what I have learned from improving my LinkedIn presense and coached collegues on how level up. The notes from those experiences are now available in a book: LinkedIn for Mobile Developers. The book is still in progress but available for sale now.
It began so innocently.
My object needed to track the number of calls to begin and end methods for observing another object. It would only stop observing when those calls were balanced. To do this I had to implement a thread-safe counter. In the past you might use OSAtomicIncrement32Barrier and OSAtomicDecrement32Barrier which safely increments and decrements a 32 bit value.
Int32 counter = 0;
OSAtomicIncrement32Barrier(&counter);
OSAtomicDecrement32Barrier(&counter);
In C and Objective-C that is still usable, but deprecated. In Swift 4 it has been removed entirely. C11 introduced atomics as a language feature, which is what should be used moving forward.
_Atomic(int) counter = 0;
atomic_fetch_add_explicit(&i, 1, memory_order_seq_cst);
atomic_fetch_sub_explicit(&i, 1, memory_order_seq_cst);
…Which is not available to Swift 4, and there is no Swift equivalent. Now, normally this would be no big loss and would just be another thing that Swift is missing.
Most modern processors enforce strict ordering of access to memory. The order of things in your code is exactly the order things will be happening on the processor. For our counter and almost any other operation that requires thread-safe access to shared data that is pretty important. The order of memory access is not usually a source of problems until your code is running on a processor that has “weak” memory ordering.
ARM has weak memory ordering. The processor is free to re-order accesses to memory as it sees fit. That is a problem. For in-depth explanation of why, see here and here.
The (obvious?) solution is to bridge from Swift 4 to the missing C11 atomic functions. Lucky for us there is a library that can do this for us that was written pretty much how I would have written it myself.
But… that does not solve our problem. As it turns out even this is not safe (see developer forums thread 1 and thread 2). Swift still does not have a memory consistency model defined. Swift cannot guarantee memory ordering, even when calling C or Objective-C code from Swift.
So Swift 4 cannot guarantee memory ordering, has no memory barriers available, and even calling into C for these things is not guaranteed to work.
The core issue here is that without a well defined memory consistency model there may be no safe way to share data or communicate between threads in a Swift application.
You may not have written any code that uses the ImageIO framework but your app most definitely uses it. UIKit and other system frameworks use ImageIO extensively on your behalf.
You can get a deeper understanding of what ImageIO is doing by using logging functionality. These flags are not documented, so it is up to you to figure out if they suit your needs.
Set any of these environment variables to 1 to enable unless otherwise noted below. The output will be printed to the console.
ImageIO debug logging environment variables:
IIO_LogMemoryUsage
IIO_LogDecodingTime
IIO_LogMetadataTime
IIO_LogPurgeability
IIO_LogImageBlocks
IIO_dLogImageIOAPICalls
IIO_dLogImageIOSPICalls
IIO_LogCacheUsage
IIO_DEBUG_METADATA
IMAGEIO_DEBUG_RAW_LOADING
DISABLE_RAW_SUPPORT
IIO_SAVEINPUTDATA
IMAGEIO_ENABLE_CACHE
IIO_DISABLE_MULTIPLE_RESOLUTIONS
IIO_DisableSubsamplePNG
IIO_DisableSubsampleTIFF
IIO_DebugImageCopy
IIO_PreferUnassociatedAlphaTIFF
IIO_LogHWUsage
IIO_DebugIncrementalLoading
IIO_DebugMemMapping
IIO_DebugFileAccess
IIO_DebugReads
IIO_CreateMD5
IIO_DebugColorHandling
IIO_DebugCreateImageConforming
IIO_LogEncodingTime
IIO_SaveImageBlocks (see note)
IIO_PluginVerbose (see note)
IIO_UseResourceList
NOTE: IIO_SaveImageBlocks and IIO_PluginVerbose can both take the following values:
ALL
framework
ASTC
ATX
BMP
DDS
EXR
GIF
ICNS
ICO
JP2000
KTX
MPO
PBM
PDF
PNG
PNTG
PSD
PVRTC
QT
RAD
SGI
TGA
TIFF
WEBP
XBM
The system can kill your app at any time. If you take too long to launch or resume the Watchdog process will kill you. If you do not free memory in response to a memory warning Jetsam will kill you.
In the past you would get a crash log when the system killed your app. The stack traces included would not really describe the source of the problem but at least you would get a log.
In 2014 Apple introduced new logging and activity tracing frameworks. These let you instrument your code with effective logging and breadcrumbs. And these would show up in your crash logs. Suddenly you could see the steps leading to any crash. This is extremely valuable for troubleshooting problems. You could easily see what happened inside your app leading to the crash.
In 2016 Apple brought the different logging and activity tracing APIs into a single, unified framework. This streamlined things and was easier to adopt.
What Apple did not mention is that in 2016 they stopped including activity tracing and logging information in crash reports. No longer can you see the steps leading to a crash.
Another thing that has not been mentioned is that out of memory crashes are now logged in a new format. JetsamEvent logs do not show up in Xcode, and can only be retrieved by syncing with iTunes.
So the most common category of production crash is no longer visible to developers, and even if it was it could no longer include the necessary diagnostic information.
I have seen a lot of complaints about the performance and stability of Xcode in recent releases. Crashes during editing, freezes, and generally slow performance. In the last few years I have contracted and on a number of different Swift projects and all of them had one or more of these issues.
Each of these projects had circular dependencies within the Swift source that contributed to the problems. In some cases we could fix it, in others the best we could do was attempt to minimize it. Third party projects were the biggest offenders by far. Some common CocoaPods Swift libraries had hundreds of dependency cycles!
Checker is a free application that can be used to find many of these cycles.
Xcode 9 includes a new build system that mitigates much of the damage caused by these cycles. Strangely, most of the Swift developers I have talked to didn’t know about the new build system!
In Xcode 9.0, the new build system is disabled by default. To enable the new build system, choose File > Project Settings or File > Workspace Settings, and then choose New Builds System for the Build System option in the menu. For a command-line build, pass the -UseNewBuildSystem=YES flag to xcodebuild.
Waiting, waiting for the staging Hadoop cluster to finish a series of tests. My email chirped over the music in my headphones. I glanced at my inbox and saw an email from the version control system that was unusually large. One of the developers had been working alone for weeks on a project without a single commit, and here was all of it at once.
The new service dealt with using advertising views as a way of earning in-game currency. When a player wanted to upgrade their character they would have a choice of paying a dollar amount for the upgrade or viewing ads or offers to “earn” value. The company would show the ads or offers and once enough “ad value” was accumulated the company would pay the game company for the player’s in game credit. It was launched early Friday morning and by Sunday there were signs of problems. The money going in and coming out were not adding up. For $1 of ad views the company was paying for $1.25 in in-game currency. The developer who designed and wrote the system worked all weekend trying to find the problem with no luck.
I didn’t hear about the problem until after I came into the office Monday morning. When the symptoms were described to me I was reminded of what happened after I read through that single giant commit.
I still had time until my tests finished and looked at a few random files within the new project. A PHP script making database queries led to the database schema, which led to me taking off my headphones and looking around the room for the developer.
I found him and pulled him aside. “Hey man, using floating point numbers for dollar values is not a great idea. Floats can’t represent those values correctly”.
“It looks fine to me” was his response. The other developers kind of shrugged it off.
The source of the problem
Take this example in Objective-C:
NSLog(@"%", 1.0f - 0.41f);
This will print out:
0.590000
Which looks… OK. NSLog by default only shows 6 significant digits. If we tell NSLog to show 10 we see something else:
0.5900000334
Or 16 significant digits:
0.5900000333786011
The problem here is that floating point numbers cannot accurately represent base 10 (currency) values. Some tools or languages will hide the problem but since float, double, etc are all binary representations internally the problem is still there. Each time a mathematical operation is performed on them the “error” will grow. Pretty much all recent languages (and databases) have this behavior.
This is described in much more detail in What Every Computer Scientist Should Know about Floating-Point Arithmetic.
The lesson here is never use a floating point type to represent a currency (decimal) value. In Cocoa use the NSDecimalNumber class to be safe.
Epilogue
By the end of Monday the company had lost over $150,000 due to the floating point problem. Far more in-game currency was purchased with the company’s real currency than should have been given the number of ad views. The company basically didn’t have that money and had to borrow more - and remove two employees. The developer who introduced the problem was not one of them.
NSExpression contains a built-in function for calculating the distance between two CLLocation instances. Using it is straightforward:
The result will be an instance of NSNumber with the distance between the two locations. The arguments can be constant values, key paths, etc.
Because NSPredicate is really a tree of expression operations we can use it there too:
Filtering and searching collections of CLLocation objects by distances becomes fast and easy - there is no reason to implement your own distance methods.
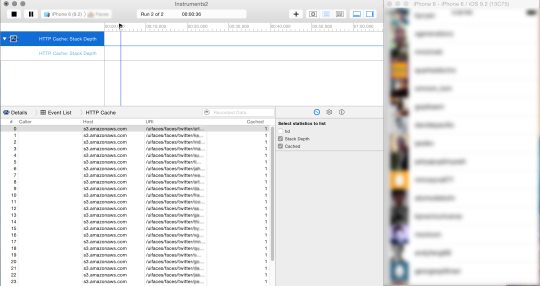
Scrolling, scrolling, scrolling. There I was, scrolling a table view in the Simulator like so many other iOS engineers. And just like them, my table view was fetching images over the network as I was scrolling through cells. Each time a cell became visible it would make an HTTP request for an image.
Usually this would be the point where I would start up Charles and re-start the simulator. The simulator has a bug that prevents it from noticing network configuration changes like starting a proxy. With a debugging proxy like Charles you can see the HTTP traffic going back and forth, though with App Transport Security setting this up can be pretty cumbersome.
To get the best user experience we want to minimize the number of times those images are actually coming from the network. If you know the HTTP 1.1 specification pretty well you can read the response headers to see how something should be cached. I know it fairly well but reading those headers can be a chore (and RedBot reads them better that I do). Just reading the headers though doesn’t always tell you want you want to know - on iOS the URL loading system doesn’t always interpret the specification the way you might think it should.
So why not just directly measure how the URL loading system cache itself is caching the response? Wouldn’t it be great if we could easily see that, and even see it in Instruments?
Well, we can. In fact, just about anything in your application that you would want to time or measure can be made available to Instruments.
Enter DTrace
Instruments is a great application, and it is mostly just a front end to a system-level tool called DTrace. MacOS and iOS both have many built in “probes” that provide data to DTrace and can be visualized in Instruments.
There are many examples out there of how to use the built in dtrace probes and script them. There are not that many examples of how to create a probe for your application and read the data in Instruments.
Creating a custom DTrace probe
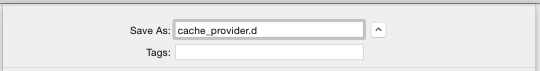
Create a new, empty file in Xcode:

Name it with a “.d” file extension:
Edit the file you just created. First we will define our provider:
For our cache probe we want to be able to pass it two strings and an integer: the host name, path, and 1 for a cached response or 0 for a response that is not cached. Add the probe to the provider:
Now build the project. When Xcode builds the project it will execute a build rule for this file that builds probe and produces a header file to make it accessible from C. That will file will be placed in the DERIVED_SOURCES directory.
After building you can now access the probe from your application. To measure wether the response is coming from the cache or not, we are going to subclass NSURLCache and override one method:
The header file that Xcode generated for the probe contains two macros: HTTP_CACHE_RESPONSE_FROM_CACHE_ENABLED() and HTTP_CACHE_RESPONSE_FROM_CACHE(arg0, arg1, arg2). HTTP_CACHE_RESPONSE_FROM_CACHE_ENABLED() returns 0 if the application is not being observed with DTrace, which is useful if you are performing heavy work to prepare data for your probe function. HTTP_CACHE_RESPONSE_FROM_CACHE(arg0, arg1, arg2) is the probe function itself, which takes the three arguments we specified in the probe file.
You can use the NSURLCache subclass with NSURLSession by setting it in the NSURLSessionConfiguration, or with NSURLConnection by setting it as the shared global cache. Without an NSURLCache set the URL loading system performs only limited, in-memory caching. Explicitly setting an NSURLCache not only allows your application to control how large the in-memory cache is, but also allows on-disk caching. Almost all applications benefit greatly from on-disk caching.
Swift
Unfortunately in Swift things are a little more complicated. The C preprocessor macros that recent versions of Xcode produce for the probe are not usable from Swift even through a bridging header. If this is functionality you would want to access from Swift, please file a radar.
With that in place we are ready to start tracing in Instruments.
Using the probe in Instruments
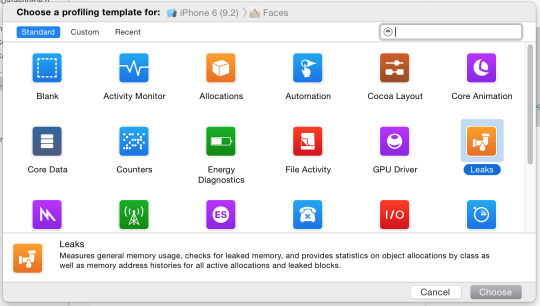
Start up an Instruments profiling session. When it prompts you to select a template, choose “Blank”:
Now from the Instrument menu, select “Build New Instrument…”. This is where you can configure Instruments to attach to DTrace probes and execute scripts with the probe data.
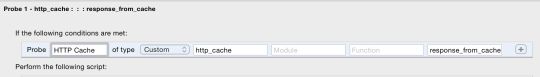
To attach to the probe we just defined we fill in the provider and probe function names in the predicate editor:
For our purposes we don’t need any scripting of the probe data, but we want to make the data available to the Instruments trace. Scroll down in the instrument editor and you can specify what data to record:

Each of the 3 arguments we pass to our probe is something we want in the trace. For whatever reason Instruments insists the last item to record is “Record No Data”.
Save the Instrument and it will be added to your Library (accessible through the Window menu).
Now you are ready to trace. Start profiling your application. If you do not see data showing up when you expect it, you may need to quit Instruments and start a new trace. Unfortunately recent versions of Instruments will not save a trace with a custom Instrument - Instruments will not even quit, it has to be force quit..
Measure, don’t log
You can measure almost anything in your application using Instruments with a custom probe. Often this can be much more useful and enlightening than using the debugger or logging. For example, in a game you could create a probe for different game states or for tracking collision detection - which would be very impractical for debugging.
Once upon a time I worked on an application that used dates. Tens of thousands of dates at a time, across different timezones. Each Spring there would be a flood of date related bugs from our QA testers and it would happen again each Fall. Here in the US we lose an hour in the Spring and gain it back in the Fall for Daylight Savings.
Making it testable
Imagine a model object class that looks like this:
-numberOfDaysInThePast calculates how long ago the eventDate is from the present in days. The implementation of that method looks like this:
This looks simple, and is actually just copied from several Stack Overflow answers.
Testing this code is difficult. The implementation has a hidden dependancy on the current system time in [NSDate date]. To test this we want both eventDate and the current date to be testable values. In order to do this we will modify the implementation slightly:
<code data-gist-id=“ae31164fe4943b2cd679” name=“numberOfDaysInThePast2”>
Now that hidden dependancy on [NSDate date] is still there, but it’s inside a method we can override. To do so in a test we will use a technique called ” extract and override to test inside the we will create a subclass of serve as our fixture. be overriden return value can against. in this example just make it property:>
Within our test case we can now use that subclass to test with known values for -currentDate :
Inside the test we’re following best practices for dealing with dates and creating a date just before a Daylight Savings change date for the timezone and calendar we’re testing with. We then create a second date that is some number of calendar days after that date.
Running the test shows that indeed the implementation of -numberOfDaysInThePast is the problem. The date calculation it is using is incorrect. If you deal with dates in your application I strongly suggest watching the WWDC 2013 session “Solutions to Common Date and Time Challenges”.
The Extract and Override technique for testing can be very empowering and is common in many languages. For whatever reason, many of the Objective-C and Swift developers I know are not aware of it. When using a private subclass as a test fixture like this it’s best to keep the overrides minimal and focused - don’t create a single class where everything can be overriden or set, instead prefer creating as many subclasses as you need with one change in each.
TL;DR; iAd is not going away. iAd is changing in ways that should benefit developers.
Last week Apple made an announcement about changes to the iAd network:
iAd App Network will be Discontinued
Apple also informed users of iTunes Radio that ad-supported radio stations would be discontinued January 28.
This has caused some confusion for developers. iAd is not going away, but it will be changing (for the better!). Unfortunately Apple has not be clear enough for many about what is changing and what the effects may be.
What is the iAd App Network, anyway?
The iAd App Network is the platform for targetted ad campaigns. An advertiser would use this for creating a campaign to be displayed through iAd in applications. For example, a developer could create an ad for their application and advertise on the iAd App Network.
What is changing for developers?
Previously, an application developer would receive 70% of ad revenue. The other 30% would go to Apple as a sort of commission - Apple’s sales team and infrastructure matched the advertising campaign with the application displaying it.
In iOS 9 Apple introduced the News application, which allowed news publishers to provide content and advertisements through the application. News publishers get 70% of revenue through ads sold through the iAd App Network but 100% through ads they sold directly. News publishers have the option of not using Apple’s iAd sales team to sell the add (not display it, sell it), which gets them 100%. This is an important distinction. Here is the exact text from Apple’s News Publisher Guide:
• Sell your own ads and keep 100% of the revenue. These ads can appear within your articles, as well as in between articles in your channel.
• Enable iAd backfill to allow iAd to sell ads in your content and keep 70% of the revenue.
Moving forward application developers will be (likely) be able to get a 100% revenue share just like News publishers by selling the ad directly (using iAd Workbench).
What does this mean for me?
What does this mean for a developer? You will have more responsibility for the ads appearing in your app. This gives a developer more control, which may be a good thing. For these ads you should see 100% of the revenue, not 70%.
Developers will not be able to publish new ads for their own apps unless that app is already part of the iAd App Network. Few developers have been advertising their own apps through iAd, so this will not affect that many people.