Tutorial Using Excel with Python and Pandas
Why learn to work with Excel with Python? Excel is one of the most popular and widely-used data tools; it's hard to find an organization that doesn't work with it in some way. From analysts, to sales VPs, to CEOs, various professionals use Excel for both quick stats and serious data crunching.
With Excel being so pervasive, data professionals must be familiar with it. Working with data in Python or R offers serious advantages over Excel's UI, so finding a way to work with Excel using code is critical. Thankfully, there's a great tool already out there for using Excel with Python called pandas.
Pandas has excellent methods for reading all kinds of data from Excel files. You can also export your results from pandas back to Excel, if that's preferred by your intended audience. Pandas is great for other routine data analysis tasks, such as:
- quick Exploratory Data Analysis (EDA)
- drawing attractive plots
- feeding data into machine learning tools like scikit-learn
- building machine learning models on your data
- taking cleaned and processed data to any number of data tools
Pandas is better at automating data processing tasks than Excel, including processing Excel files.
In this tutorial, we are going to show you how to work with Excel files in pandas. We will cover the following concepts.
- setting up your computer with the necessary software
- reading in data from Excel files into pandas
- data exploration in pandas
- visualizing data in pandas using the matplotlib visualization library
- manipulating and reshaping data in pandas
- moving data from pandas into Excel
Note that this tutorial does not provide a deep dive into pandas. To explore pandas more, check out our course.
System Prerequisites
We will use Python 3 and Jupyter Notebook to demonstrate the code in this tutorial.In addition to Python and Jupyter Notebook, you will need the following Python modules:
- matplotlib - data visualization
- NumPy - numerical data functionality
- OpenPyXL - read/write Excel 2010 xlsx/xlsm files
- pandas - data import, clean-up, exploration, and analysis
- xlrd - read Excel data
- xlwt - write to Excel
- XlsxWriter - write to Excel (xlsx) files
There are multiple ways to get set up with all the modules. We cover three of the most common scenarios below.
- If you have Python installed via Anaconda package manager, you can install the required modules using the command
conda install. For example, to install pandas, you would execute the command -conda install pandas. - If you already have a regular, non-Anaconda Python installed on the computer, you can install the required modules using
pip. Open your command line program and execute commandpip install <module name>to install a module. You should replace<module name>with the actual name of the module you are trying to install. For example, to install pandas, you would execute command -pip install pandas. - If you don't have Python already installed, you should get it through the Anaconda package manager. Anaconda provides installers for Windows, Mac, and Linux Computers. If you choose the full installer, you will get all the modules you need, along with Python and pandas within a single package. This is the easiest and fastest way to get started.
The Data Set
In this tutorial, we will use a multi-sheet Excel file we created from Kaggle's IMDB Scores data. You can download the file here.
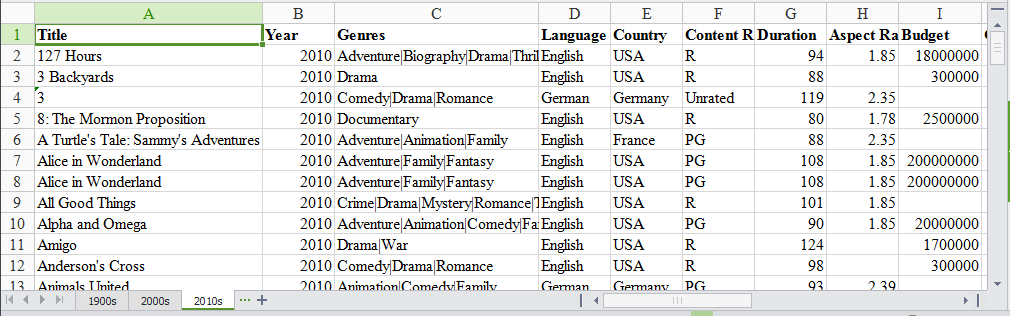
Our Excel file has three sheets: '1900s,' '2000s,' and '2010s.' Each sheet has data for movies from those years.
We will use this data set to find the ratings distribution for the movies, visualize movies with highest ratings and net earnings and calculate statistical information about the movies. We will be analyzing and exploring this data using Python and pandas, thus demonstrating pandas capabilities for working with Excel data in Python.
Read data from the Excel file
We need to first import the data from the Excel file into pandas. To do that, we start by importing the pandas module.
import pandas as pdWe then use the pandas' read_excel method to read in data from the Excel file. The easiest way to call this method is to pass the file name. If no sheet name is specified then it will read the first sheet in the index (as shown below).
excel_file = 'movies.xls'
movies = pd.read_excel(excel_file)
Here, the read_excel method read the data from the Excel file into a pandas DataFrame object. Pandas defaults to storing data in DataFrames. We then stored this DataFrame into a variable called movies.
Pandas has a built-in DataFrame.head() method that we can use to easily display the first few rows of our DataFrame. If no argument is passed, it will display first five rows. If a number is passed, it will display the equal number of rows from the top.
movies.head()| Title | Year | Genres | Language | Country | Content Rating | Duration | Aspect Ratio | Budget | Gross Earnings | ... | Facebook Likes - Actor 1 | Facebook Likes - Actor 2 | Facebook Likes - Actor 3 | Facebook Likes - cast Total | Facebook likes - Movie | Facenumber in posters | User Votes | Reviews by Users | Reviews by Crtiics | IMDB Score | |
|---|---|---|---|---|---|---|---|---|---|---|---|---|---|---|---|---|---|---|---|---|---|
| 0 | Intolerance: Love's Struggle Throughout the Ages | 1916 | Drama|History|War | NaN | USA | Not Rated | 123 | 1.33 | 385907.0 | NaN | ... | 436 | 22 | 9.0 | 481 | 691 | 1 | 10718 | 88 | 69.0 | 8.0 |
| 1 | Over the Hill to the Poorhouse | 1920 | Crime|Drama | NaN | USA | NaN | 110 | 1.33 | 100000.0 | 3000000.0 | ... | 2 | 2 | 0.0 | 4 | 0 | 1 | 5 | 1 | 1.0 | 4.8 |
| 2 | The Big Parade | 1925 | Drama|Romance|War | NaN | USA | Not Rated | 151 | 1.33 | 245000.0 | NaN | ... | 81 | 12 | 6.0 | 108 | 226 | 0 | 4849 | 45 | 48.0 | 8.3 |
| 3 | Metropolis | 1927 | Drama|Sci-Fi | German | Germany | Not Rated | 145 | 1.33 | 6000000.0 | 26435.0 | ... | 136 | 23 | 18.0 | 203 | 12000 | 1 | 111841 | 413 | 260.0 | 8.3 |
| 4 | Pandora's Box | 1929 | Crime|Drama|Romance | German | Germany | Not Rated | 110 | 1.33 | NaN | 9950.0 | ... | 426 | 20 | 3.0 | 455 | 926 | 1 | 7431 | 84 | 71.0 | 8.0 |
5 rows × 25 columns
Excel files quite often have multiple sheets and the ability to read a specific sheet or all of them is very important. To make this easy, the pandas read_excel method takes an argument called sheetname that tells pandas which sheet to read in the data from. For this, you can either use the sheet name or the sheet number. Sheet numbers start with zero. If the sheetname argument is not given, it defaults to zero and pandas will import the first sheet.
By default, pandas will automatically assign a numeric index or row label starting with zero. You may want to leave the default index as such if your data doesn't have a column with unique values that can serve as a better index. In case there is a column that you feel would serve as a better index, you can override the default behavior by setting index_col property to a column. It takes a numeric value for setting a single column as index or a list of numeric values for creating a multi-index.
In the below code, we are choosing the first column, 'Title', as index (index=0) by passing zero to the index_col argument.
movies_sheet1 = pd.read_excel(excel_file, sheetname=0, index_col=0)
movies_sheet1.head()| Year | Genres | Language | Country | Content Rating | Duration | Aspect Ratio | Budget | Gross Earnings | Director | ... | Facebook Likes - Actor 1 | Facebook Likes - Actor 2 | Facebook Likes - Actor 3 | Facebook Likes - cast Total | Facebook likes - Movie | Facenumber in posters | User Votes | Reviews by Users | Reviews by Crtiics | IMDB Score | |
|---|---|---|---|---|---|---|---|---|---|---|---|---|---|---|---|---|---|---|---|---|---|
| Title | |||||||||||||||||||||
| Intolerance: Love's Struggle Throughout the Ages | 1916 | Drama|History|War | NaN | USA | Not Rated | 123 | 1.33 | 385907.0 | NaN | D.W. Griffith | ... | 436 | 22 | 9.0 | 481 | 691 | 1 | 10718 | 88 | 69.0 | 8.0 |
| Over the Hill to the Poorhouse | 1920 | Crime|Drama | NaN | USA | NaN | 110 | 1.33 | 100000.0 | 3000000.0 | Harry F. Millarde | ... | 2 | 2 | 0.0 | 4 | 0 | 1 | 5 | 1 | 1.0 | 4.8 |
| The Big Parade | 1925 | Drama|Romance|War | NaN | USA | Not Rated | 151 | 1.33 | 245000.0 | NaN | King Vidor | ... | 81 | 12 | 6.0 | 108 | 226 | 0 | 4849 | 45 | 48.0 | 8.3 |
| Metropolis | 1927 | Drama|Sci-Fi | German | Germany | Not Rated | 145 | 1.33 | 6000000.0 | 26435.0 | Fritz Lang | ... | 136 | 23 | 18.0 | 203 | 12000 | 1 | 111841 | 413 | 260.0 | 8.3 |
| Pandora's Box | 1929 | Crime|Drama|Romance | German | Germany | Not Rated | 110 | 1.33 | NaN | 9950.0 | Georg Wilhelm Pabst | ... | 426 | 20 | 3.0 | 455 | 926 | 1 | 7431 | 84 | 71.0 | 8.0 |
5 rows × 24 columns
As you noticed above, our Excel data file has three sheets. We already read the first sheet in a DataFrame above. Now, using the same syntax, we will read in rest of the two sheets too.
movies_sheet2 = pd.read_excel(excel_file, sheetname=1, index_col=0)
movies_sheet2.head()| Year | Genres | Language | Country | Content Rating | Duration | Aspect Ratio | Budget | Gross Earnings | Director | ... | Facebook Likes - Actor 1 | Facebook Likes - Actor 2 | Facebook Likes - Actor 3 | Facebook Likes - cast Total | Facebook likes - Movie | Facenumber in posters | User Votes | Reviews by Users | Reviews by Crtiics | IMDB Score | |
|---|---|---|---|---|---|---|---|---|---|---|---|---|---|---|---|---|---|---|---|---|---|
| Title | |||||||||||||||||||||
| 102 Dalmatians | 2000 | Adventure|Comedy|Family | English | USA | G | 100.0 | 1.85 | 85000000.0 | 66941559.0 | Kevin Lima | ... | 2000.0 | 795.0 | 439.0 | 4182 | 372 | 1 | 26413 | 77.0 | 84.0 | 4.8 |
| 28 Days | 2000 | Comedy|Drama | English | USA | PG-13 | 103.0 | 1.37 | 43000000.0 | 37035515.0 | Betty Thomas | ... | 12000.0 | 10000.0 | 664.0 | 23864 | 0 | 1 | 34597 | 194.0 | 116.0 | 6.0 |
| 3 Strikes | 2000 | Comedy | English | USA | R | 82.0 | 1.85 | 6000000.0 | 9821335.0 | DJ Pooh | ... | 939.0 | 706.0 | 585.0 | 3354 | 118 | 1 | 1415 | 10.0 | 22.0 | 4.0 |
| Aberdeen | 2000 | Drama | English | UK | NaN | 106.0 | 1.85 | 6500000.0 | 64148.0 | Hans Petter Moland | ... | 844.0 | 2.0 | 0.0 | 846 | 260 | 0 | 2601 | 35.0 | 28.0 | 7.3 |
| All the Pretty Horses | 2000 | Drama|Romance|Western | English | USA | PG-13 | 220.0 | 2.35 | 57000000.0 | 15527125.0 | Billy Bob Thornton | ... | 13000.0 | 861.0 | 820.0 | 15006 | 652 | 2 | 11388 | 183.0 | 85.0 | 5.8 |
5 rows × 24 columns
movies_sheet3 = pd.read_excel(excel_file, sheetname=2, index_col=0)
movies_sheet3.head()| Year | Genres | Language | Country | Content Rating | Duration | Aspect Ratio | Budget | Gross Earnings | Director | ... | Facebook Likes - Actor 1 | Facebook Likes - Actor 2 | Facebook Likes - Actor 3 | Facebook Likes - cast Total | Facebook likes - Movie | Facenumber in posters | User Votes | Reviews by Users | Reviews by Crtiics | IMDB Score | |
|---|---|---|---|---|---|---|---|---|---|---|---|---|---|---|---|---|---|---|---|---|---|
| Title | |||||||||||||||||||||
| 127 Hours | 2010.0 | Adventure|Biography|Drama|Thriller | English | USA | R | 94.0 | 1.85 | 18000000.0 | 18329466.0 | Danny Boyle | ... | 11000.0 | 642.0 | 223.0 | 11984 | 63000 | 0.0 | 279179 | 440.0 | 450.0 | 7.6 |
| 3 Backyards | 2010.0 | Drama | English | USA | R | 88.0 | NaN | 300000.0 | NaN | Eric Mendelsohn | ... | 795.0 | 659.0 | 301.0 | 1884 | 92 | 0.0 | 554 | 23.0 | 20.0 | 5.2 |
| 3 | 2010.0 | Comedy|Drama|Romance | German | Germany | Unrated | 119.0 | 2.35 | NaN | 59774.0 | Tom Tykwer | ... | 24.0 | 20.0 | 9.0 | 69 | 2000 | 0.0 | 4212 | 18.0 | 76.0 | 6.8 |
| 8: The Mormon Proposition | 2010.0 | Documentary | English | USA | R | 80.0 | 1.78 | 2500000.0 | 99851.0 | Reed Cowan | ... | 191.0 | 12.0 | 5.0 | 210 | 0 | 0.0 | 1138 | 30.0 | 28.0 | 7.1 |
| A Turtle's Tale: Sammy's Adventures | 2010.0 | Adventure|Animation|Family | English | France | PG | 88.0 | 2.35 | NaN | NaN | Ben Stassen | ... | 783.0 | 749.0 | 602.0 | 3874 | 0 | 2.0 | 5385 | 22.0 | 56.0 | 6.1 |
5 rows × 24 columns
Since all the three sheets have similar data but for different recordsmovies, we will create a single DataFrame from all the three DataFrames we created above. We will use the pandas concat method for this and pass in the names of the three DataFrames we just created and assign the results to a new DataFrame object, movies. By keeping the DataFrame name same as before, we are over-writing the previously created DataFrame.
movies = pd.concat([movies_sheet1, movies_sheet2, movies_sheet3])We can check if this concatenation by checking the number of rows in the combined DataFrame by calling the method shape on it that will give us the number of rows and columns.
movies.shape(5042, 24)Using the ExcelFile class to read multiple sheets
We can also use the ExcelFile class to work with multiple sheets from the same Excel file. We first wrap the Excel file using ExcelFile and then pass it to read_excel method.
xlsx = pd.ExcelFile(excel_file)
movies_sheets = []
for sheet in xlsx.sheet_names:
   movies_sheets.append(xlsx.parse(sheet))
movies = pd.concat(movies_sheets)
If you are reading an Excel file with a lot of sheets and are creating a lot of DataFrames, ExcelFile is more convenient and efficient in comparison to read_excel. With ExcelFile, you only need to pass the Excel file once, and then you can use it to get the DataFrames. When using read_excel, you pass the Excel file every time and hence the file is loaded again for every sheet. This can be a huge performance drag if the Excel file has many sheets with a large number of rows.
Exploring the data
Now that we have read in the movies data set from our Excel file, we can start exploring it using pandas. A pandas DataFrame stores the data in a tabular format, just like the way Excel displays the data in a sheet. Pandas has a lot of built-in methods to explore the DataFrame we created from the Excel file we just read in.
We already introduced the method head in the previous section that displays few rows from the top from the DataFrame. Let's look at few more methods that come in handy while exploring the data set.
We can use the shape method to find out the number of rows and columns for the DataFrame.
movies.shape(5042, 25)This tells us our Excel file has 5042 records and 25 columns or observations. This can be useful in reporting the number of records and columns and comparing that with the source data set.
We can use the tail method to view the bottom rows. If no parameter is passed, only the bottom five rows are returned.
movies.tail()| Title | Year | Genres | Language | Country | Content Rating | Duration | Aspect Ratio | Budget | Gross Earnings | ... | Facebook Likes - Actor 1 | Facebook Likes - Actor 2 | Facebook Likes - Actor 3 | Facebook Likes - cast Total | Facebook likes - Movie | Facenumber in posters | User Votes | Reviews by Users | Reviews by Crtiics | IMDB Score | |
|---|---|---|---|---|---|---|---|---|---|---|---|---|---|---|---|---|---|---|---|---|---|
| 1599 | War & Peace | NaN | Drama|History|Romance|War | English | UK | TV-14 | NaN | 16.00 | NaN | NaN | ... | 1000.0 | 888.0 | 502.0 | 4528 | 11000 | 1.0 | 9277 | 44.0 | 10.0 | 8.2 |
| 1600 | Wings | NaN | Comedy|Drama | English | USA | NaN | 30.0 | 1.33 | NaN | NaN | ... | 685.0 | 511.0 | 424.0 | 1884 | 1000 | 5.0 | 7646 | 56.0 | 19.0 | 7.3 |
| 1601 | Wolf Creek | NaN | Drama|Horror|Thriller | English | Australia | NaN | NaN | 2.00 | NaN | NaN | ... | 511.0 | 457.0 | 206.0 | 1617 | 954 | 0.0 | 726 | 6.0 | 2.0 | 7.1 |
| 1602 | Wuthering Heights | NaN | Drama|Romance | English | UK | NaN | 142.0 | NaN | NaN | NaN | ... | 27000.0 | 698.0 | 427.0 | 29196 | 0 | 2.0 | 6053 | 33.0 | 9.0 | 7.7 |
| 1603 | Yu-Gi-Oh! Duel Monsters | NaN | Action|Adventure|Animation|Family|Fantasy | Japanese | Japan | NaN | 24.0 | NaN | NaN | NaN | ... | 0.0 | NaN | NaN | 0 | 124 | 0.0 | 12417 | 51.0 | 6.0 | 7.0 |
5 rows × 25 columns
In Excel, you're able to sort a sheet based on the values in one or more columns. In pandas, you can do the same thing with the sort_values method. For example, let's sort our movies DataFrame based on the Gross Earnings column.
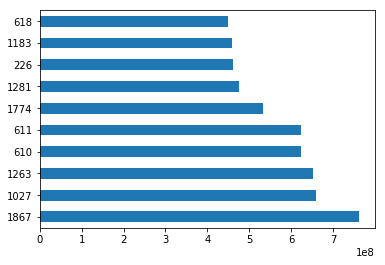
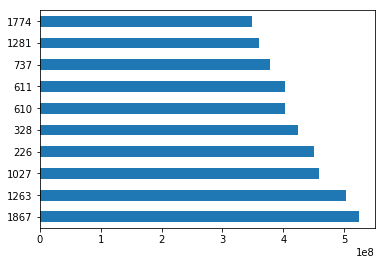
sorted_by_gross = movies.sort_values(['Gross Earnings'], ascending=False)Since we have the data sorted by values in a column, we can do few interesting things with it. For example, we can display the top 10 movies by Gross Earnings.
sorted_by_gross["Gross Earnings"].head(10)1867 760505847.0
1027 658672302.0
1263 652177271.0
610 623279547.0
611 623279547.0
1774 533316061.0
1281 474544677.0
226 460935665.0
1183 458991599.0
618 448130642.0
Name: Gross Earnings, dtype: float64We can also create a plot for the top 10 movies by Gross Earnings. Pandas makes it easy to visualize your data with plots and charts through matplotlib, a popular data visualization library. With a couple lines of code, you can start plotting. Moreover, matplotlib plots work well inside Jupyter Notebooks since you can displace the plots right under the code.
First, we import the matplotlib module and set matplotlib to display the plots right in the Jupyter Notebook.
import matplotlib.pyplot as pl
We will draw a bar plot where each bar will represent one of the top 10 movies. We can do this by calling the plot method and setting the argument kind to barh. This tells matplotlib to draw a horizontal bar plot.
sorted_by_gross['Gross Earnings'].head(10).plot(kind="barh")
plt.show()
Let's create a histogram of IMDB Scores to check the distribution of IMDB Scores across all movies. Histograms are a good way to visualize the distribution of a data set. We use the plot method on the IMDB Scores series from our movies DataFrame and pass it the argument.
movies['IMDB Score'].plot(kind="hist")
plt.show()
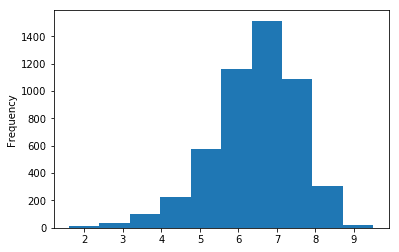
This data visualization suggests that most of the IMDB Scores fall between six and eight.
Getting statistical information about the data
Pandas has some very handy methods to look at the statistical data about our data set. For example, we can use the describe method to get a statistical summary of the data set.
movies.describe()
Year
Duration
Aspect Ratio
Budget
Gross Earnings
Facebook Likes - Director
Facebook Likes - Actor 1
Facebook Likes - Actor 2
Facebook Likes - Actor 3
Facebook Likes - cast Total
Facebook likes - Movie
Facenumber in posters
User Votes
Reviews by Users
Reviews by Crtiics
IMDB Score
count
4935.000000
5028.000000
4714.000000
4.551000e+03
4.159000e+03
4938.000000
5035.000000
5029.000000
5020.000000
5042.000000
5042.000000
5029.000000
5.042000e+03
5022.000000
4993.000000
5042.000000
mean
2002.470517
107.201074
2.220403
3.975262e+07
4.846841e+07
686.621709
6561.323932
1652.080533
645.009761
9700.959143
7527.457160
1.371446
8.368475e+04
272.770808
140.194272
6.442007
std
12.474599
25.197441
1.385113
2.061149e+08
6.845299e+07
2813.602405
15021.977635
4042.774685
1665.041728
18165.101925
19322.070537
2.013683
1.384940e+05
377.982886
121.601675
1.125189
min
1916.000000
7.000000
1.180000
2.180000e+02
1.620000e+02
0.000000
0.000000
0.000000
0.000000
0.000000
0.000000
0.000000
5.000000e+00
1.000000
1.000000
1.600000
25%
1999.000000
93.000000
1.850000
6.000000e+06
5.340988e+06
7.000000
614.500000
281.000000
133.000000
1411.250000
0.000000
0.000000
8.599250e+03
65.000000
50.000000
5.800000
50%
2005.000000
103.000000
2.350000
2.000000e+07
2.551750e+07
49.000000
988.000000
595.000000
371.500000
3091.000000
166.000000
1.000000
3.437100e+04
156.000000
110.000000
6.600000
75%
2011.000000
118.000000
2.350000
4.500000e+07
6.230944e+07
194.750000
11000.000000
918.000000
636.000000
13758.750000
3000.000000
2.000000
9.634700e+04
326.000000
195.000000
7.200000
max
2016.000000
511.000000
16.000000
1.221550e+10
7.605058e+08
23000.000000
640000.000000
137000.000000
23000.000000
656730.000000
349000.000000
43.000000
1.689764e+06
5060.000000
813.000000
9.500000
The describe method displays below information for each of the columns.
- the count or number of values
- mean
- standard deviation
- minimum, maximum
- 25%, 50%, and 75% quantile
Please note that this information will be calculated only for the numeric values.
We can also use the corresponding method to access this information one at a time. For example, to get the mean of a particular column, you can use the mean method on that column.
movies["Gross Earnings"].mean()
48468407.526809327
Just like mean, there are methods available for each of the statistical information we want to access. You can read about these methods in our free pandas cheat sheet.
Reading files with no header and skipping records
Earlier in this tutorial, we saw some ways to read a particular kind of Excel file that had headers and no rows that needed skipping. Sometimes, the Excel sheet doesn't have any header row. For such instances, you can tell pandas not to consider the first row as header or columns names. And If the Excel sheet's first few rows contain data that should not be read in, you can ask the read_excel method to skip a certain number of rows, starting from the top.
For example, look at the top few rows of this Excel file.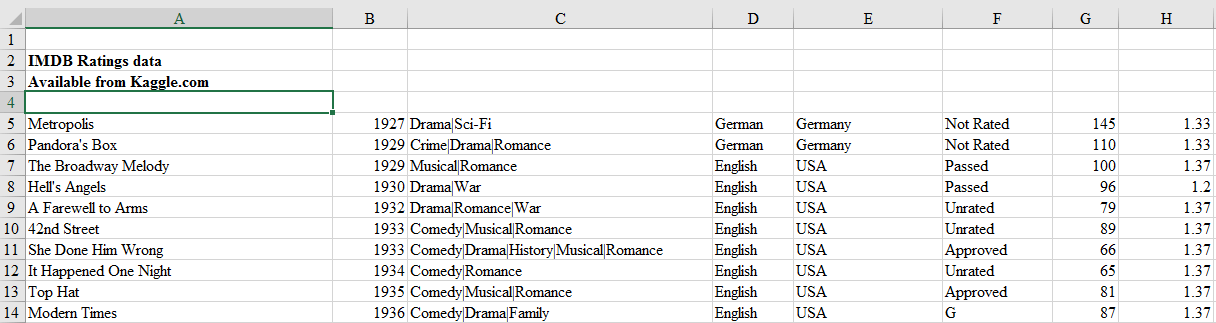
This file obviously has no header and first four rows are not actual records and hence should not be read in. We can tell read_excel there is no header by setting argument header to None and we can skip first four rows by setting argument skiprows to four.
movies_skip_rows = pd.read_excel("movies-no-header-skip-rows.xls", header=None, skiprows=4)
movies_skip_rows.head(5)
0
1
2
3
4
5
6
7
8
9
...
15
16
17
18
19
20
21
22
23
24
0
Metropolis
1927
Drama|Sci-Fi
German
Germany
Not Rated
145
1.33
6000000.0
26435.0
...
136
23
18.0
203
12000
1
111841
413
260.0
8.3
1
Pandora's Box
1929
Crime|Drama|Romance
German
Germany
Not Rated
110
1.33
NaN
9950.0
...
426
20
3.0
455
926
1
7431
84
71.0
8.0
2
The Broadway Melody
1929
Musical|Romance
English
USA
Passed
100
1.37
379000.0
2808000.0
...
77
28
4.0
109
167
8
4546
71
36.0
6.3
3
Hell's Angels
1930
Drama|War
English
USA
Passed
96
1.20
3950000.0
NaN
...
431
12
4.0
457
279
1
3753
53
35.0
7.8
4
A Farewell to Arms
1932
Drama|Romance|War
English
USA
Unrated
79
1.37
800000.0
NaN
...
998
164
99.0
1284
213
1
3519
46
42.0
6.6
5 rows × 25 columns
We skipped four rows from the sheet and used none of the rows as the header. Also, notice that one can combine different options in a single read statement. To skip rows at the bottom of the sheet, you can use option skip_footer, which works just like skiprows, the only difference being the rows are counted from the bottom upwards.
The column names in the previous DataFrame are numeric and were allotted as default by the pandas. We can rename the column names to descriptive ones by calling the method columns on the DataFrame and passing the column names as a list.
movies_skip_rows.columns = ['Title', 'Year', 'Genres', 'Language', 'Country', 'Content Rating', 'Duration', 'Aspect Ratio', 'Budget', 'Gross Earnings', 'Director', 'Actor 1', 'Actor 2', 'Actor 3', 'Facebook Likes - Director', 'Facebook Likes - Actor 1', 'Facebook Likes - Actor 2', 'Facebook Likes - Actor 3', 'Facebook Likes - cast Total', 'Facebook likes - Movie', 'Facenumber in posters', 'User Votes', 'Reviews by Users', 'Reviews by Crtiics', 'IMDB Score']
movies_skip_rows.head()
Title
Year
Genres
Language
Country
Content Rating
Duration
Aspect Ratio
Budget
Gross Earnings
...
Facebook Likes - Actor 1
Facebook Likes - Actor 2
Facebook Likes - Actor 3
Facebook Likes - cast Total
Facebook likes - Movie
Facenumber in posters
User Votes
Reviews by Users
Reviews by Crtiics
IMDB Score
0
Metropolis
1927
Drama|Sci-Fi
German
Germany
Not Rated
145
1.33
6000000.0
26435.0
...
136
23
18.0
203
12000
1
111841
413
260.0
8.3
1
Pandora's Box
1929
Crime|Drama|Romance
German
Germany
Not Rated
110
1.33
NaN
9950.0
...
426
20
3.0
455
926
1
7431
84
71.0
8.0
2
The Broadway Melody
1929
Musical|Romance
English
USA
Passed
100
1.37
379000.0
2808000.0
...
77
28
4.0
109
167
8
4546
71
36.0
6.3
3
Hell's Angels
1930
Drama|War
English
USA
Passed
96
1.20
3950000.0
NaN
...
431
12
4.0
457
279
1
3753
53
35.0
7.8
4
A Farewell to Arms
1932
Drama|Romance|War
English
USA
Unrated
79
1.37
800000.0
NaN
...
998
164
99.0
1284
213
1
3519
46
42.0
6.6
5 rows × 25 columns
Now that we have seen how to read a subset of rows from the Excel file, we can learn how to read a subset of columns.
Reading a subset of columns
Although read_excel defaults to reading and importing all columns, you can choose to import only certain columns. By passing parse_cols=6, we are telling the read_excel method to read only the first columns till index six or first seven columns (the first column being indexed zero).
movies_subset_columns = pd.read_excel(excel_file, parse_cols=6)
movies_subset_columns.head()
Title
Year
Genres
Language
Country
Content Rating
Duration
0
Intolerance: Love's Struggle Throughout the Ages
1916
Drama|History|War
NaN
USA
Not Rated
123
1
Over the Hill to the Poorhouse
1920
Crime|Drama
NaN
USA
NaN
110
2
The Big Parade
1925
Drama|Romance|War
NaN
USA
Not Rated
151
3
Metropolis
1927
Drama|Sci-Fi
German
Germany
Not Rated
145
4
Pandora's Box
1929
Crime|Drama|Romance
German
Germany
Not Rated
110
Alternatively, you can pass in a list of numbers, which will let you import columns at particular indexes.
Applying formulas on the columns
One of the much-used features of Excel is to apply formulas to create new columns from existing column values. In our Excel file, we have Gross Earnings and Budget columns. We can get Net earnings by subtracting Budget from Gross earnings. We could then apply this formula in the Excel file to all the rows. We can do this in pandas also as shown below.
movies["Net Earnings"] = movies["Gross Earnings"] - movies["Budget"]
Above, we used pandas to create a new column called Net Earnings, and populated it with the difference of Gross Earnings and Budget. It's worth noting the difference here in how formulas are treated in Excel versus pandas. In Excel, a formula lives in the cell and updates when the data changes - with Python, the calculations happen and the values are stored - if Gross Earnings for one movie was manually changed, Net Earnings won't be updated.
Let's use the sort_values method to sort the data by the new column we created and visualize the top 10 movies by Net Earnings.
sorted_movies = movies[['Net Earnings']].sort_values(['Net Earnings'], ascending=[False])sorted_movies.head(10)['Net Earnings'].plot.barh()
plt.show()
Pivot Table in pandas
Advanced Excel users also often use pivot tables. A pivot table summarizes the data of another table by grouping the data on an index and applying operations such as sorting, summing, or averaging. You can use this feature in pandas too.
We need to first identify the column or columns that will serve as the index, and the column(s) on which the summarizing formula will be applied. Let's start small, by choosing Year as the index column and Gross Earnings as the summarization column and creating a separate DataFrame from this data.
movies_subset = movies[['Year', 'Gross Earnings']]
movies_subset.head()
Year
Gross Earnings
0
1916.0
NaN
1
1920.0
3000000.0
2
1925.0
NaN
3
1927.0
26435.0
4
1929.0
9950.0
We now call pivot_table on this subset of data. The method pivot_table takes a parameter index. As mentioned, we want to use Year as the index.
earnings_by_year = movies_subset.pivot_table(index=['Year'])
earnings_by_year.head()
Gross Earnings
Year
1916.0
NaN
1920.0
3000000.0
1925.0
NaN
1927.0
26435.0
1929.0
1408975.0
This gave us a pivot table with grouping on Year and summarization on the sum of Gross Earnings. Notice, we didn't need to specify Gross Earnings column explicitly as pandas automatically identified it the values on which summarization should be applied.
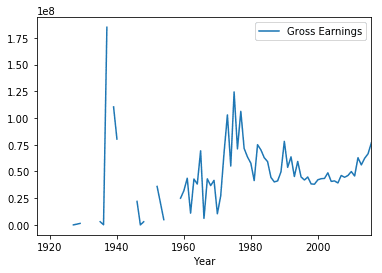
We can use this pivot table to create some data visualizations. We can call the plot method on the DataFrame to create a line plot and call the show method to display the plot in the notebook.
earnings_by_year.plot()
plt.show()
We saw how to pivot with a single column as the index. Things will get more interesting if we can use multiple columns. Let's create another DataFrame subset but this time we will choose the columns, Country, Language and Gross Earnings.
movies_subset = movies[['Country', 'Language', 'Gross Earnings']]
movies_subset.head()
Country
Language
Gross Earnings
0
USA
NaN
NaN
1
USA
NaN
3000000.0
2
USA
NaN
NaN
3
Germany
German
26435.0
4
Germany
German
9950.0
We will use columns Country and Language as the index for the pivot table. We will use Gross Earnings as summarization table, however, we do not need to specify this explicitly as we saw earlier.
earnings_by_co_lang = movies_subset.pivot_table(index=['Country', 'Language'])
earnings_by_co_lang.head()
Gross Earnings
Country
Language
Afghanistan
Dari
1.127331e+06
Argentina
Spanish
7.230936e+06
Aruba
English
1.007614e+07
Australia
Aboriginal
6.165429e+06
Dzongkha
5.052950e+05
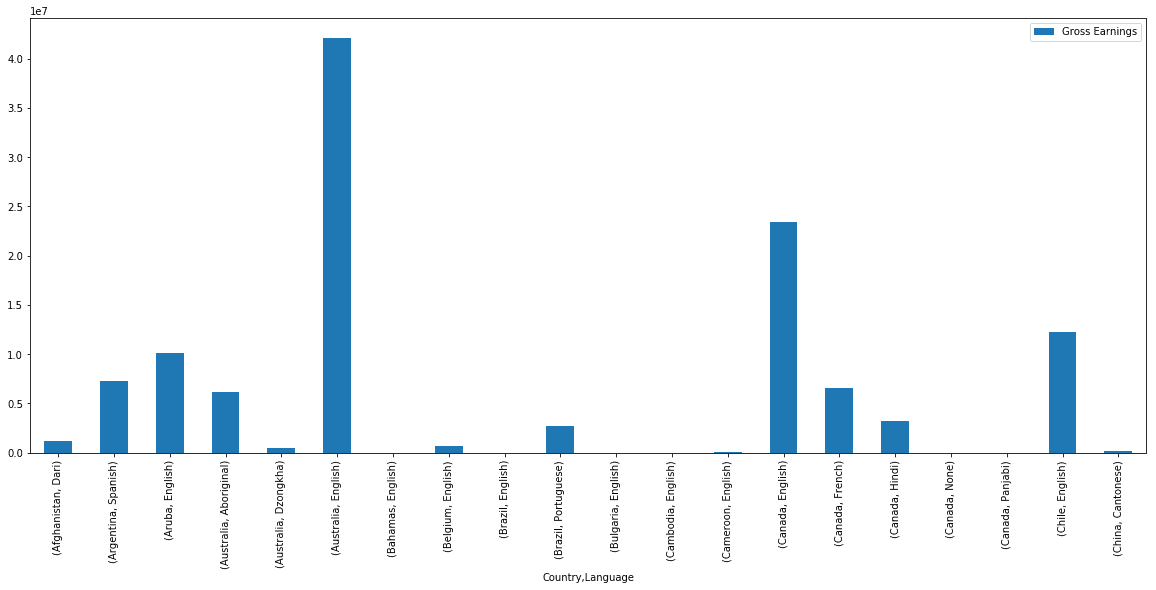
Let's visualize this pivot table with a bar plot. Since there are still few hundred records in this pivot table, we will plot just a few of them.
earnings_by_co_lang.head(20).plot(kind='bar', figsize=(20,8))
plt.show()
Exporting the results to Excel
If you're going to be working with colleagues who use Excel, saving Excel files out of pandas is important. You can export or write a pandas DataFrame to an Excel file using pandas to_excel method. Pandas uses the xlwt Python module internally for writing to Excel files. The to_excel method is called on the DataFrame we want to export.We also need to pass a filename to which this DataFrame will be written.
movies.to_excel('output.xlsx')
By default, the index is also saved to the output file. However, sometimes the index doesn't provide any useful information. For example, the movies DataFrame has a numeric auto-increment index, that was not part of the original Excel data.
movies.head()
Title
Year
Genres
Language
Country
Content Rating
Duration
Aspect Ratio
Budget
Gross Earnings
...
Facebook Likes - Actor 2
Facebook Likes - Actor 3
Facebook Likes - cast Total
Facebook likes - Movie
Facenumber in posters
User Votes
Reviews by Users
Reviews by Crtiics
IMDB Score
Net Earnings
0
Intolerance: Love's Struggle Throughout the Ages
1916.0
Drama|History|War
NaN
USA
Not Rated
123.0
1.33
385907.0
NaN
...
22.0
9.0
481
691
1.0
10718
88.0
69.0
8.0
NaN
1
Over the Hill to the Poorhouse
1920.0
Crime|Drama
NaN
USA
NaN
110.0
1.33
100000.0
3000000.0
...
2.0
0.0
4
0
1.0
5
1.0
1.0
4.8
2900000.0
2
The Big Parade
1925.0
Drama|Romance|War
NaN
USA
Not Rated
151.0
1.33
245000.0
NaN
...
12.0
6.0
108
226
0.0
4849
45.0
48.0
8.3
NaN
3
Metropolis
1927.0
Drama|Sci-Fi
German
Germany
Not Rated
145.0
1.33
6000000.0
26435.0
...
23.0
18.0
203
12000
1.0
111841
413.0
260.0
8.3
-5973565.0
4
Pandora's Box
1929.0
Crime|Drama|Romance
German
Germany
Not Rated
110.0
1.33
NaN
9950.0
...
20.0
3.0
455
926
1.0
7431
84.0
71.0
8.0
NaN
5 rows × 26 columns
You can choose to skip the index by passing along index-False.
movies.to_excel('output.xlsx', index=False)
We need to be able to make our output files look nice before we can send it out to our co-workers. We can use pandas ExcelWriter class along with the XlsxWriter Python module to apply the formatting.
We can do use these advanced output options by creating a ExcelWriter object and use this object to write to the EXcel file.
writer = pd.ExcelWriter('output.xlsx', engine='xlsxwriter')
movies.to_excel(writer, index=False, sheet_name='report')
workbook = writer.bookworksheet = writer.sheets['report']
We can apply customizations by calling add_format on the workbook we are writing to. Here we are setting header format as bold.
header_fmt = workbook.add_format({'bold': True})
worksheet.set_row(0, None, header_fmt)
Finally, we save the output file by calling the method save on the writer object.
writer.save()
As an example, we saved the data with column headers set as bold. And the saved file looks like the image below.
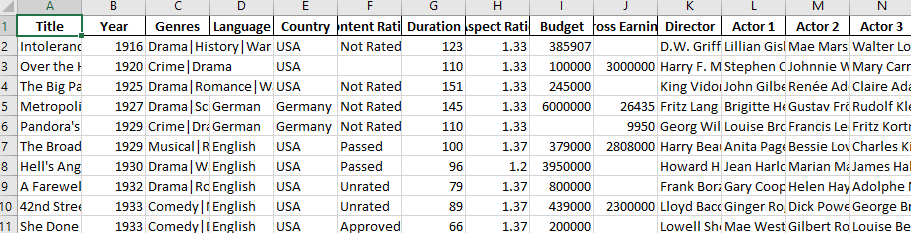
Like this, one can use XlsxWriter to apply various formatting to the output Excel file.
Conclusion
Pandas is not a replacement for Excel. Both tools have their place in the data analysis workflow and can be very great companion tools. As we demonstrated, pandas can do a lot of complex data analysis and manipulations, which depending on your need and expertise, can go beyond what you can achieve if you are just using Excel. One of the major benefits of using Python and pandas over Excel is that it helps you automate Excel file processing by writing scripts and integrating with your automated data workflow. Pandas also has excellent methods for reading all kinds of data from Excel files. You can export your results from pandas back to Excel too if that's preferred by your intended audience.
On the other hand, Excel is a such a widely used data tool, it's not a wise to ignore it. Acquiring expertise in both pandas and Excel and making them work together gives you skills that can help you stand out in your organization.
If you’d like to learn more about this topic, check out Dataquest's interactive Pandas and NumPy Fundamentals course, and our Data Analyst in Python, and Data Scientist in Python paths that will help you become job-ready in around 6 months.