
Researchers at Goethe University in Frankfurt are developing new data-driven approaches to competitive analysis using data from SISTRIX. Find out the most important details in a nutshell here.
Competitive analysis should answer three questions:
- Which competitors are in the market?
- How successful are they?
- What are their positions? (i.e. who competes with whom and to what degree? Are there different groups of highly competitive rivals?)
The answers to these three questions form the basis of a successful competitive strategy.
Challenges in competitive analysis
Which competitors are in the market? Sounds like an easy question, but it’s often not that straightforward to answer.
On the one hand, most providers do not compete in a single area of the market. For example, banks not only offer current accounts, but also loans and pension plans. They compete with different competitors in each of these areas.
On the other hand, providers today also compete at several points along the value chain. For example, banks not only offer their customers traditional banking products (such as current accounts and loans) and compete mainly with other banks for these products; they also provide information on financial products and topics, and therefore compete with totally different providers, such as information or comparison portals.
So is it even possible to talk about the “market” and “competitors”?
What the research says
Such questions are being addressed by a team of researchers from Goethe University Frankfurt & the University of North Carolina at Chapel Hill (USA), led by Professors Bernd Skiera, Daniel Ringel and PhD student Maximilian Matthe.
They are developing new data-driven approaches to competitive analysis. One of their goals is to create “market maps”, i.e. 2D maps that depict all competitors in a market and their respective relationships to each other.
On these maps, individual competitors (either products, brands, companies or websites) are represented by dots so that strong competitors appear close together. The following illustration shows an example of such a map for the German LED TV market1. Each individual dot represents a specific LED TV.
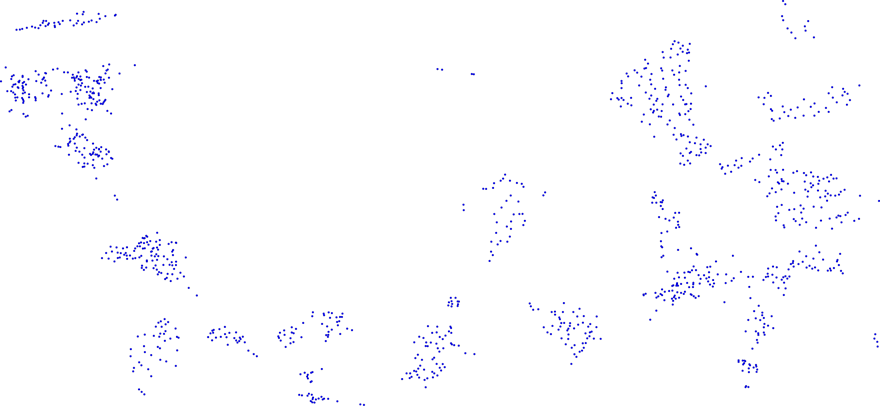
Behind this are new algorithms from machine learning, among other things, which generate such maps from large amounts of data. In the past, such maps were used in many areas for various data sources – and now for the first time with SEO data from SISTRIX.
The basis for creating such maps is always data regarding which providers in the market are “similar” to each other. Such similarity can be determined in several ways using the SISTRIX Toolbox, e.g. which providers appear together on the same SERPs, or use similar texts in the SERP snippets.


Example: The US banking market
By way of illustration, here is a concrete example from the US retail banking market (i.e. the banking of private customers). The individual dots on the following map represent the position of a single provider in the market. Strongly competing providers appear close together, while poorly competing providers are further apart.
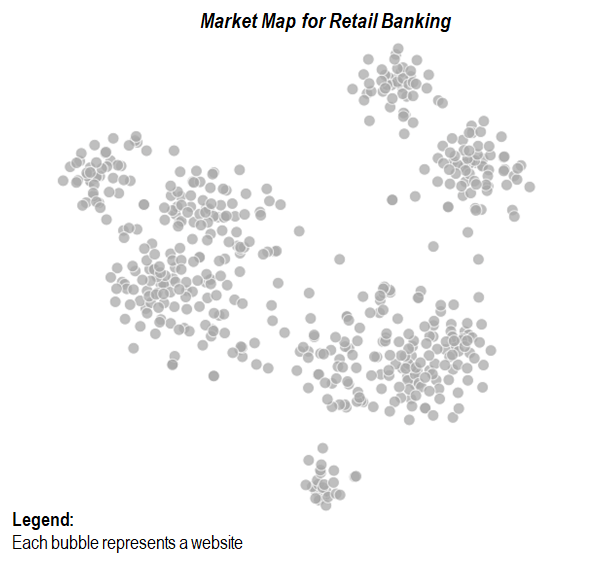
The map already shows that there is not “one market”, but rather different “submarkets” that can be recognised by the clearly separated groups of providers that compete strongly with each other. This becomes clearer if the providers on the map are coloured according to their submarkets and the individual sub-markets are labelled:
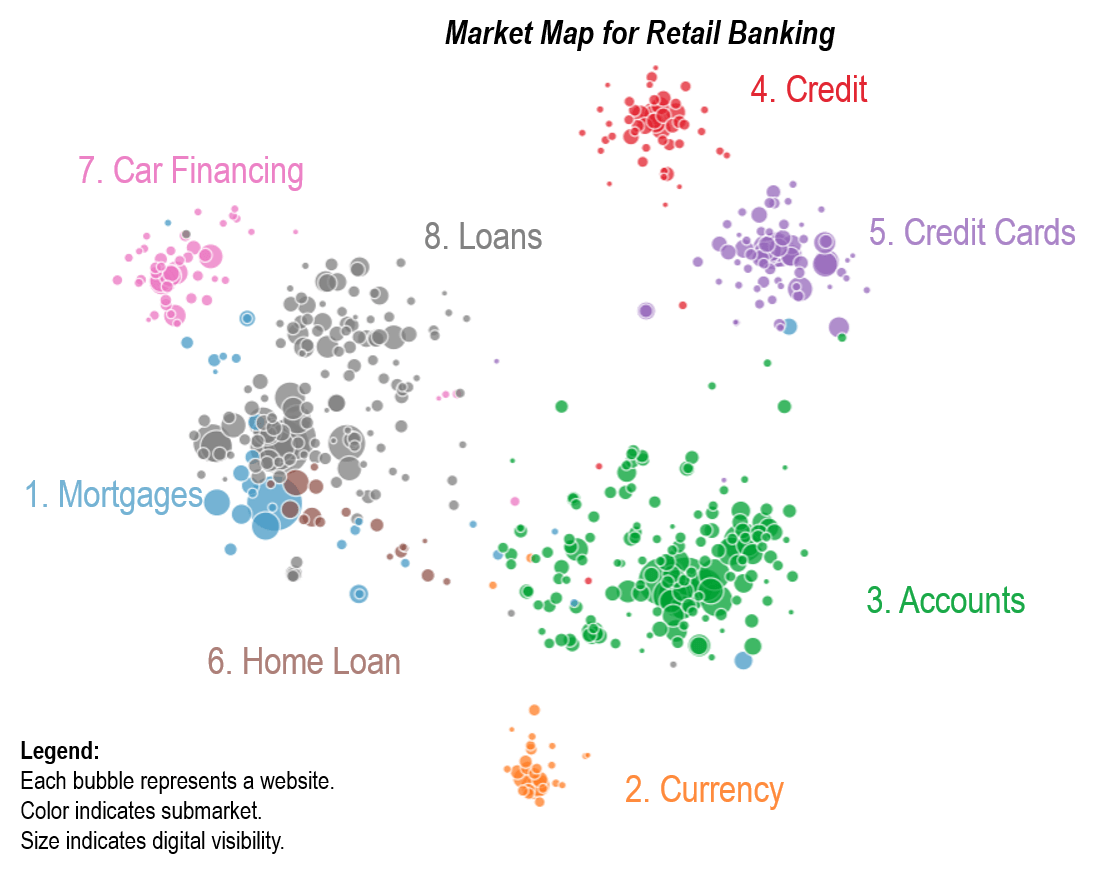
What does this mean in concrete terms for competitive analysis? This can be illustrated using “Bank of America” (www.bankofamerica.com) as an example. Bank of America doesn’t appear in just one place in the market, but is represented in several submarkets.
In the next image, each of the highlighted dots shows Bank of America’s position in each submarket. In addition, the size of each dot shows how successful it is in that submarket (measured by the visibility in the respective submarket).
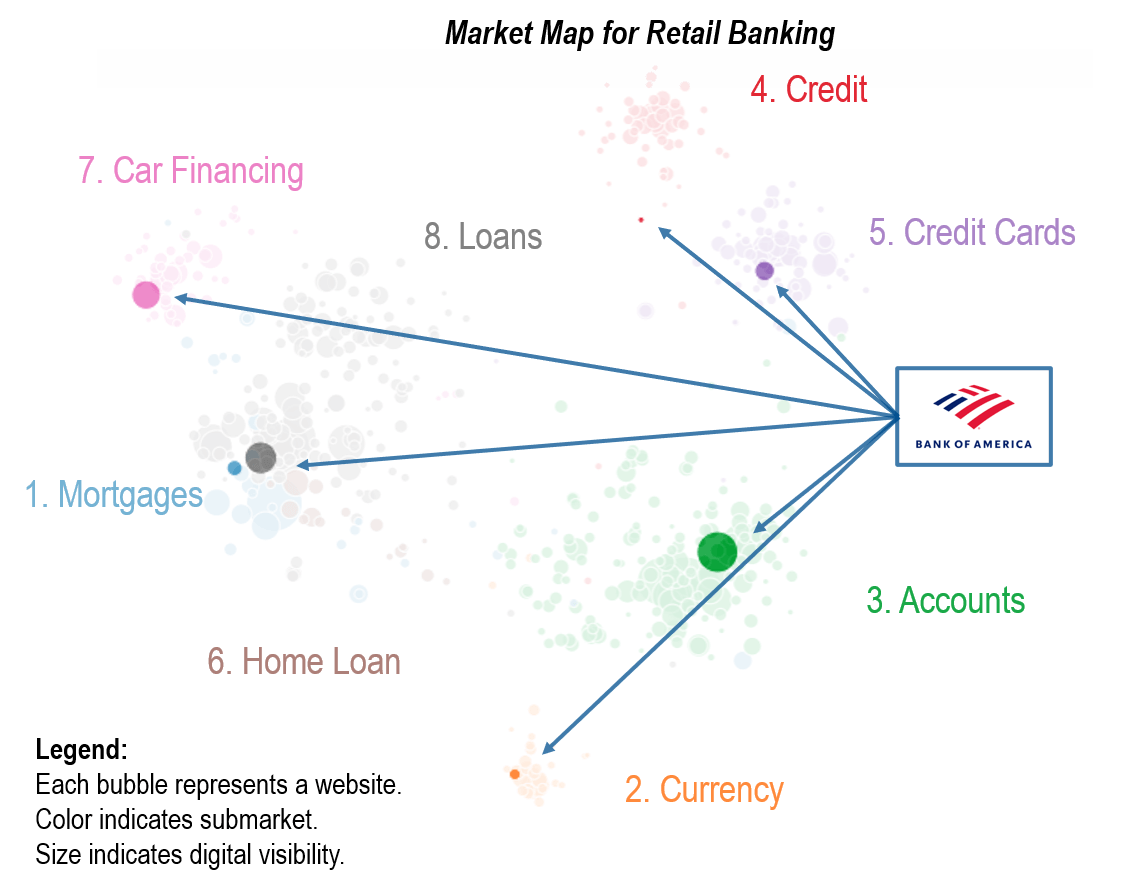
As you can see, Bank of America is represented to varying degrees in each of these submarkets. For example, it achieves high visibility in the “Accounts” submarket (i.e. current accounts) as indicated by the large green dot, whereas it is much less visible in the “Credit Cards” submarket, as indicated by the smaller purple dot. Moreover, it has quite different competitors in each of these submarkets, as shown in the next two figures, where we zoom in a little further to ascertain Bank of America’s respective positions.
Submarket 3 “Accounts”
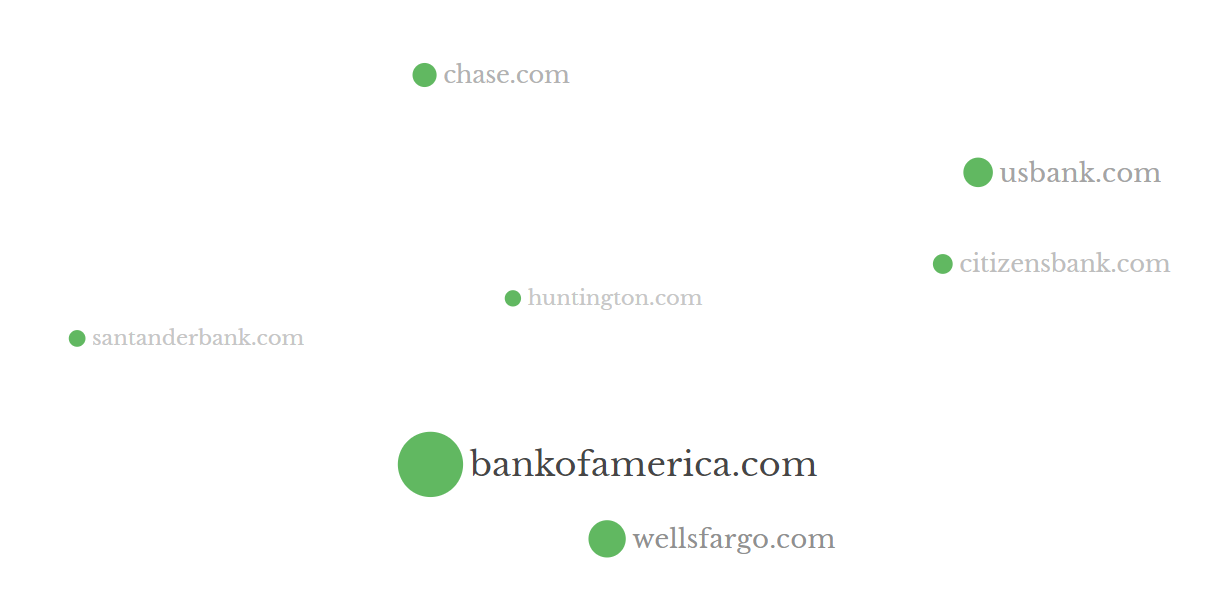
When it comes to current accounts, the strongest competitors are mainly other banks, such as “Wells Fargo” (www.wellsfargo.com). Bank of America is much more visible than it, as indicated by the larger dot.
Submarket 5 “Credit Cards”
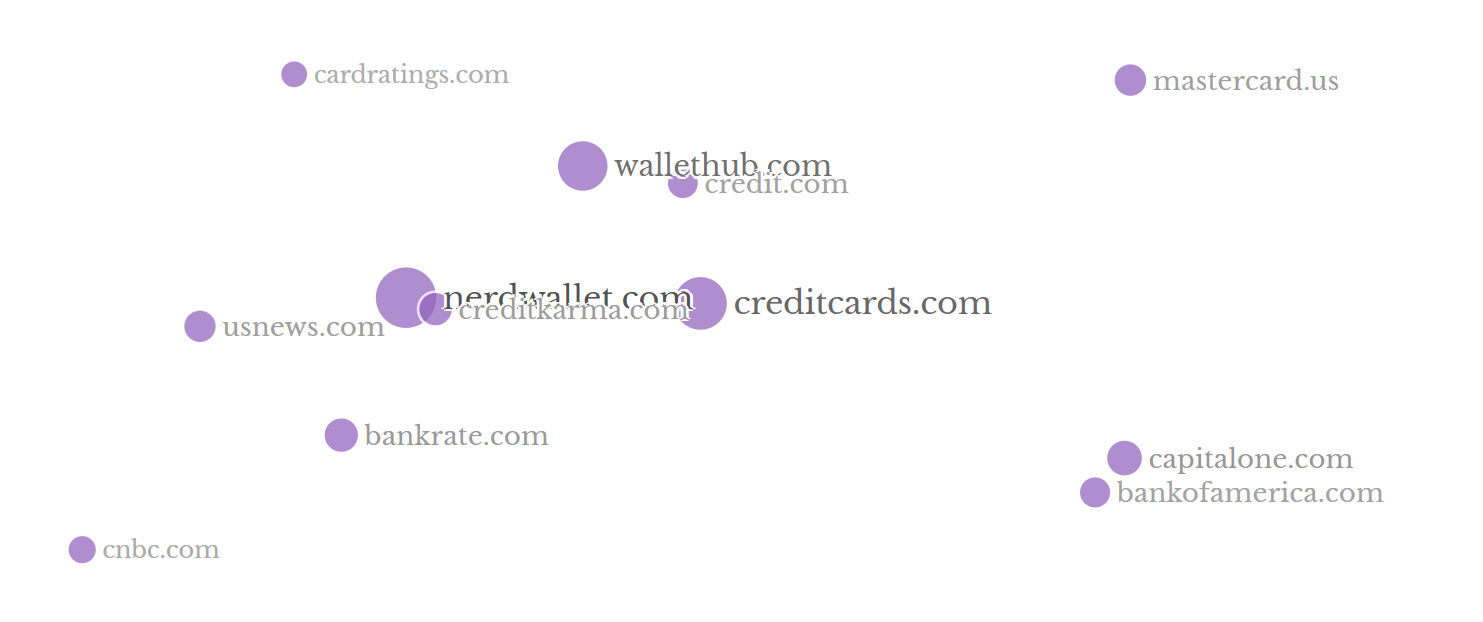
When it comes to credit cards, things look quite different. There is only one bank among the competitors (Capital One) and only one credit card provider (Mastercard). Most of the competitors are information and comparison portals, which also dominate this submarket in terms of visibility.
The entire map for the US banking market can be explored interactively at https://mapxp.app/retail-banking/.
Conclusions
Competitive analysis forms the basis of any sound marketing strategy. However, as the example from the US banking market shows, performing competitive analysis poses some challenges.
SEO data (such as the SISTRIX Toolbox) and market maps can help here. Such maps give detailed insights into the competition from an SEO perspective, and as such can directly provide valuable information to ensure a successful SEO strategy.
In many cases, we can deduce something about who is competing in the online area from an SEO perspective. And as the coronavirus crisis has demonstrated, visibility in the online world can be an important success factor offline. Consequently, the findings from the competitive analysis are by no means limited to the SEO world, but can also be useful for your general marketing strategy.
Further information
If you’re interested in how to create such maps, you should have a look at the research team’s web pages.
The example from the banking market can also be explored in more detail at https://mapxp.app/retail-banking/.
An introduction to the topic is also available on the SEO stream, on which the researchers from Frankfurt have already been guests:
Maximilian Matthe
Prof. Dr. Bernd Skiera
1The academic contribution behind this map:
- Ringel, Daniel / Skiera, Bernd (2016), “Visualizing Asymmetric Competition among More than 1,000 Products Using Big Search Data”, Marketing Science, 35(3), 511-534.