


A north star metric is a single metric that represents the success of your community.
Ideally, it’s a single metric all stakeholders can track to see if the community is delivering more value than in the past. If it goes up, you’re doing well. If it goes down, things aren’t going so well.
If you find the right metric, it’s a lot easier to get more support and build more awareness of the community. However, finding the right metric isn’t easy. Every metric has limitations and it’s not easy to find a metric which reflects your organisation’s unique goals and constraints.
In this post, I want to share some of our thinking about finding your north star and finding the perfect metric for your efforts.
Why Finding The North Star Is Painfully Difficult
Before we begin, it’s important to be mindful of why this process is painfully difficult. Most previous efforts to find a north star metric suffer from four problems.
1) They don’t reflect value. Many metrics show increases or decreases in activity, but not whether the activity is important or not. This leads to the ‘engagement trap’ problem.
2) Gaming the metrics. Many metrics are easy to game. This undermines the entire value of the metric. Good metrics always need to be accompanied by good judgment (and ethical behaviour).
3) They are driven by external factors. Many metrics change not as a result of community, but as a result of external factors outside of the community team’s control. You shouldn’t be held accountable for metrics you can’t directly influence.
4) They aren’t comparable to other metrics. It’s hard to know if the metric matters if it can’t be compared to any existing metrics. A community-focused metric is great, but how do you compare that to a return on marketing spend?
Be mindful that the challenge isn’t to find a flawless metric. There isn’t one. The challenge is to find out which flaws are acceptable and communicate these well to others.
We will go deeper into each of these flaws and make suggestions about which kinds of metrics might make sense.
Resource: The Tyranny of Metrics
Resource: The Engagement Trap
Resource: Don’t Use Bogus Metrics
The Journey Is As Important As The Destination
The process of finding the right north star metric is as important as the metric itself.
You shouldn’t come up with a metric by yourself. That’s a surefire way to set yourself up for endless years of arguing why the metric matters. Instead, you should treat this as a journey of discovery and close collaboration where you listen to the thoughts of others and bring people along on the journey.
Everyone should feel they were involved in finding the final metric. If you don’t do this, you might face a concerted effort of people to unpick the value later.
You can see a typical process to find the north star metric below:
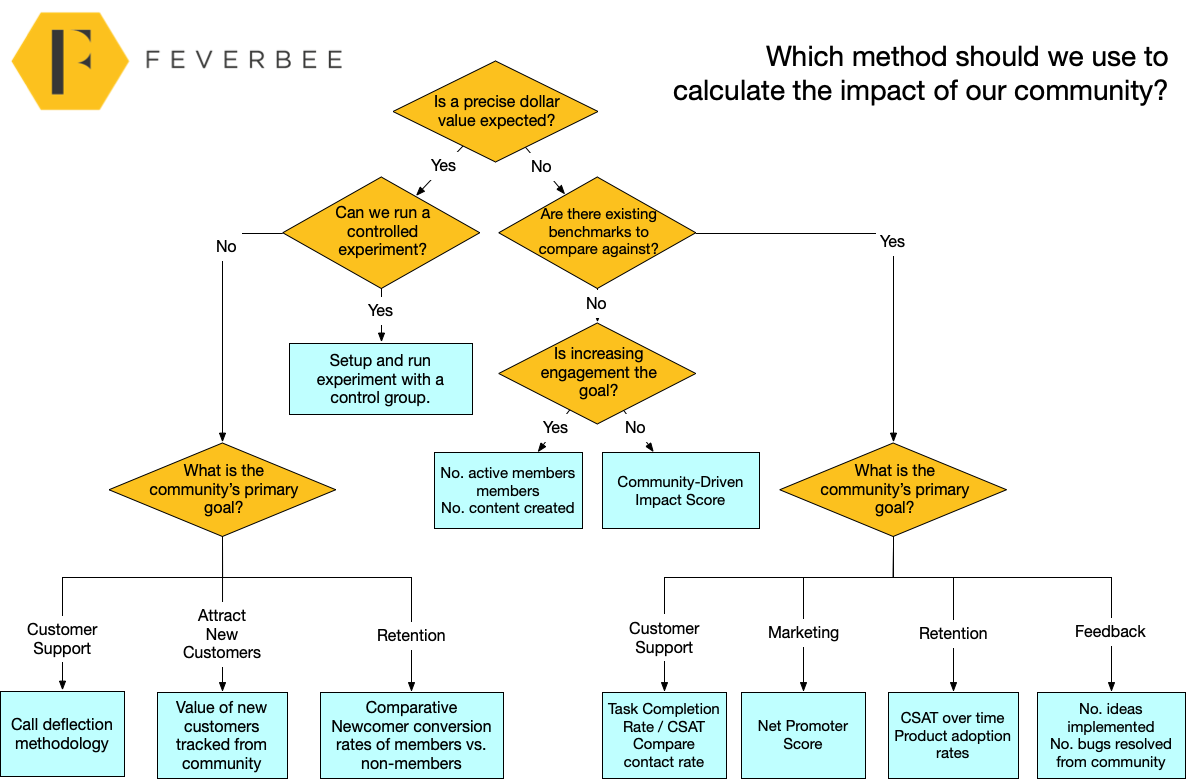
At every stage of the process, you need to build greater understanding and keep people informed. This might begin with knowing if a precise dollar value is needed. But that’s far from the end of the journey.
Be mindful that this chart isn’t prescriptive – it’s not designed to cover every possible type of community (non-profits, partners, developers etc…), but it might be a good place to begin investigating the opportunities.
PART ONE – FINDING THE DOLLAR VALUE
Is A Precise Dollar Value Required?
The first challenge is to ascertain expectations. Perhaps the most important determination is whether you’re looking for a dollar value return or not.
The method to find a precise dollar value is completely different than if one that has a different goal.
If a dollar value is required, you need to develop and explain a methodology that leads to a precise calculation. The end result is a dollar value return which will likely be compared to other departments to determine if the community merits more investment.
Also, if a dollar value is required, you will need data not just from the community but from whatever systems store the spending and behaviour of customers. You need to combine community data with your CRM data.
If a dollar value is not required, you have more flexibility to design an approach that reflects the unique value of your community. If a dollar value isn’t required, it’s possible to determine value just with community data.
In this approach, you can find a metric that perfectly encapsulates the impact of the community – but might not assign a precise dollar value to the community. This is like the difference between measuring the value of a branding effort vs. a dollar ad spend. The former requires metrics that either show revenue driven by ads or a change in feelings and perceptions (usually acquired by questionnaires).
You begin the process then by answering some critical questions.
These questions include:
- Who will be looking at the metric?
- What do they want to know about your community?
- How will they be using the metric?
- What will good or bad look like?
Once you’re armed with answers to these questions, you can begin to figure out what kind of metric might make the most sense. Crucially, are people looking for a precise dollar value or a broader sense of impact?
For now, let’s assume a dollar value is required.
Understand The Purpose
The next step is to determine the purpose(s) of the community. We’re not talking about specific goals here, but a broad understanding of why the community exists. This can be singular or there might be multiple reasons. Often the answer is suggested by whichever department the community reports to (which is why shifting departments is such a big deal, the purpose of your community will also change).
Some simple questions to ask here might include:
- Which department does the community report to (and why?)
- Who was behind the community’s launch and what was expected?
- What are the expectations stakeholders have of the community?
If no one seems to know (or seems reluctant to own the decision), it’s often a good idea to host a stakeholder workshop to gain some sense of alignment. This is where you guide members through the process of prioritising what is the best match for a community.
You can see a typical outcome of the process below.

You don’t need specific metrics at this stage, but you should have a fairly clear purpose (or set of purposes) to define how the community helps. Is it support? Attract new customers? Retention? Or some other benefit?
Resource: 46 questions for uncovering community goals
Resource: A Framework For Hosting A Successful Workshop To Gain Alignment On Community Goals
The Four Methods Of Finding A Dollar Value
Once we know the purpose, we can start finding the right methodology to calculate community value to a precise dollar value.
You can see the four options below:

Each method has some obvious pros and cons. You have to decide between precision or simplicity, correlation or causation.
The former is a question of capabilities, the latter is a question of preferences.
Let’s go a little deeper into each method.
Controlled Experiments
The gold standard is to run an experiment.
However, this rarely happens because experiments usually require:
- An analyst with experience in running experiments.
- 3 to 6 months to plan and execute.
- Removal of access (or not providing access) to a significant percentage of your audience.
If you don’t have the capabilities, resources, and support for this, it won’t be possible to run an experiment. This means you can only determine correlation, not causation. Also, be mindful that an experiment gives you data from a single point in time. If things change, this data might quickly become outdated.
Controlled experiments let you make statements like:
“The community causes members to spend/do [x] more than they otherwise would”
Article: The Real Value Of Your Brand Community
Group Comparison
The second approach is to compare two groups (or more) by a specific condition.
The most common example is to compare spending or retention of members vs. non-members. Statistically, this isn’t too difficult to do. The catch is this provides you with correlation, not causation. This simply indicates there is a relationship between membership and the desired outcome, it doesn’t show which way the relationship goes (i.e. does retention drive engagement or engagement drive retention?).
Nor does it reveal whether there is a confounding variable that influences both variables as you can see below.
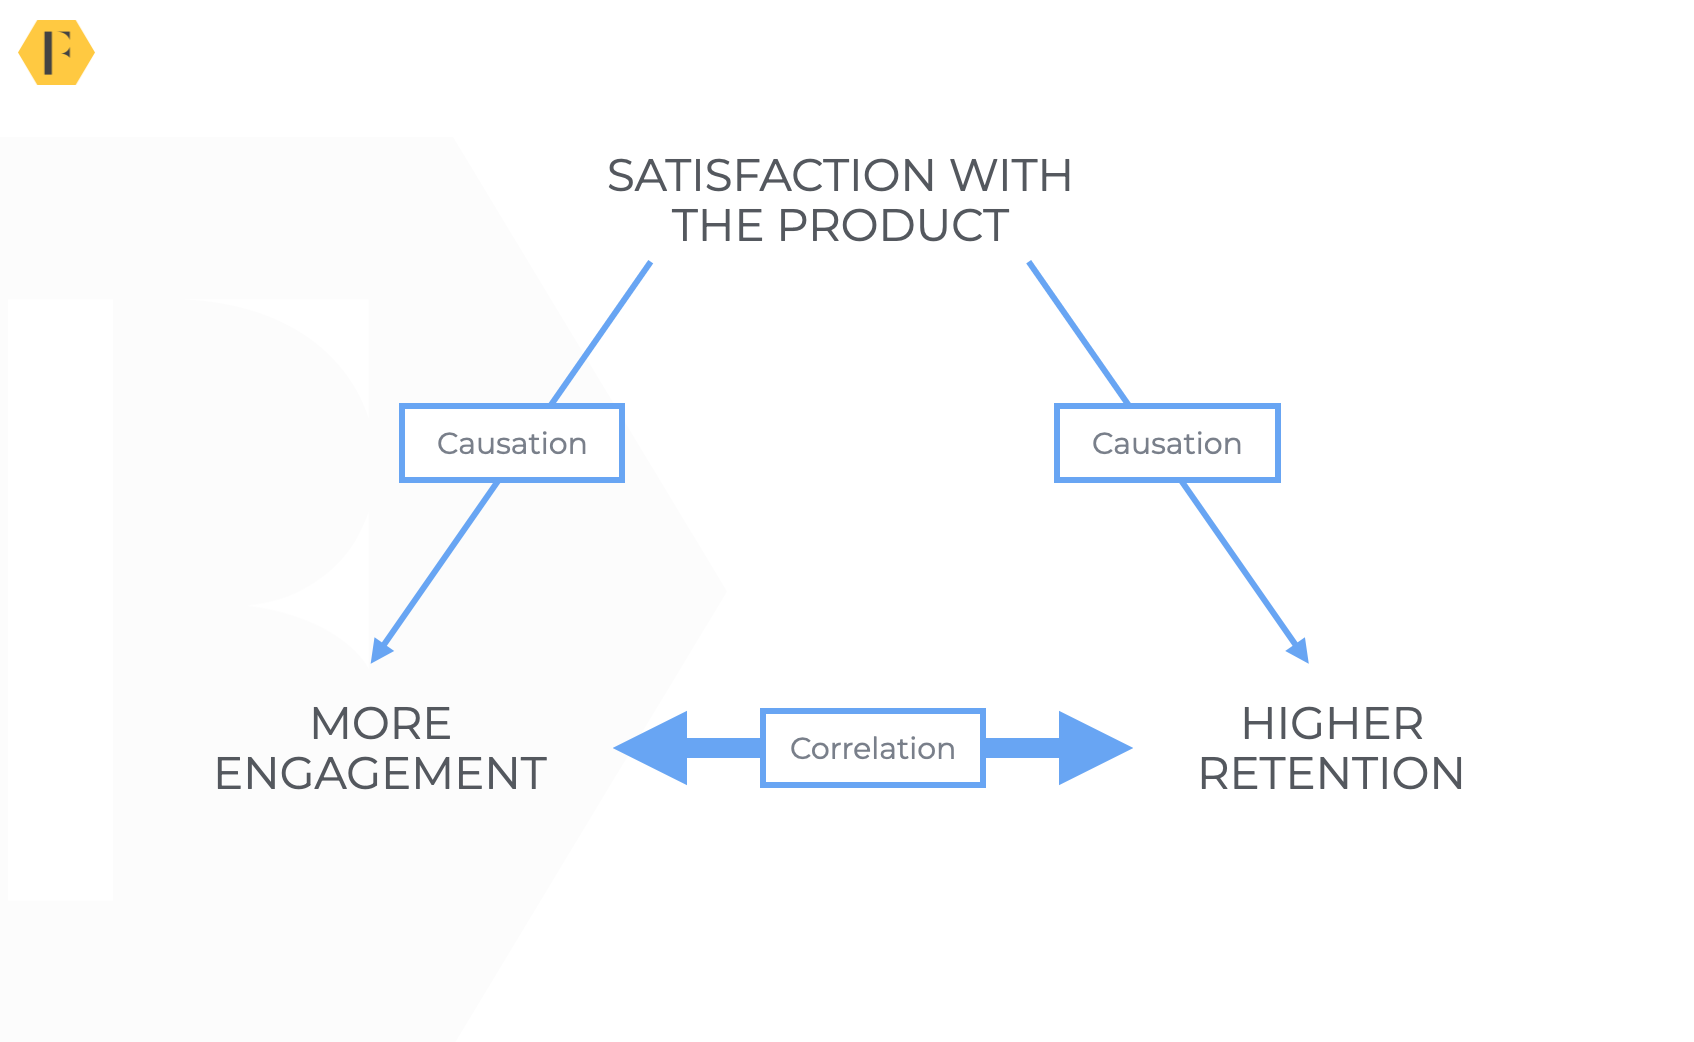
This doesn’t make the data redundant (and there are more complex calculations you can do to try and ascertain the unique impact of the community), but overall it’s a useful, interesting, signal.
This lets you make statements like:
“Community members spend/do [x] more than non-members (or comparative group)”
Note: You can (and should) be precise about how you’re comparing groups. For example, you can find groups of people who closely resemble one another before they join a community and then track their spending a year later etc…
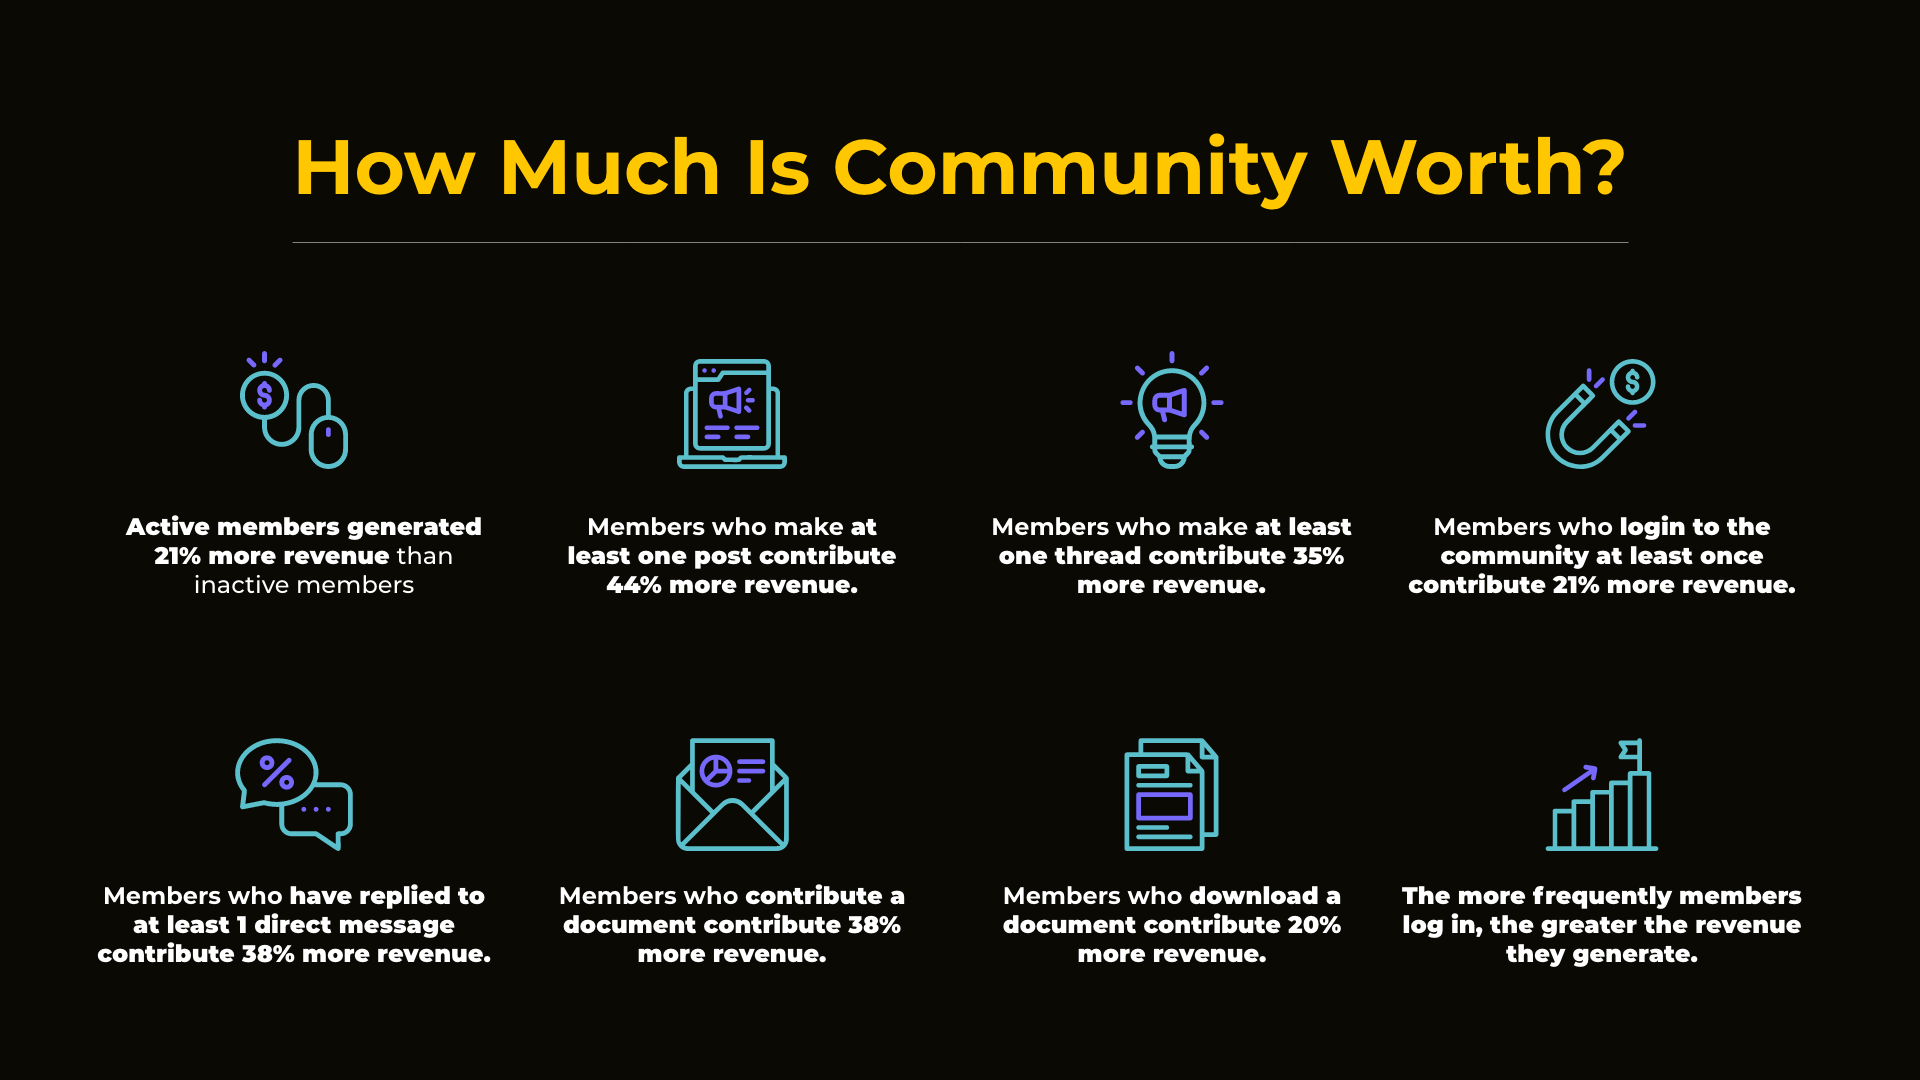
Article: What Is A Login, Post, Or Download Worth? An Analysis By FeverBee
Surveys and Polls
Surveys are a handy tool which can be used to determine the value of a community. For example, you can ask members about their spending before and after they join the community.
The upsides of using surveys and polls are obvious; they’re easy to set up and analyse the results.
However, surveys suffer from three common problems.
1) Getting enough responses. You usually need around 300 survey responses to have meaningful results. If we assume a 5% survey response rate, you must contact at least 6000 people.
2) Sampling bias. Surveys suffer from a sampling bias. The most active members are also those most likely to respond to survey requests. This means surveys tend to skew towards the happiest and highest-spending members. You need to use a quota system by activity level to gain an accurate picture.
3) Responses are often inaccurate. You can ask members questions like how much they purchase before and after the community (or even track purchases over time), but memories are often fuzzy and the answers might not be accurate (people might also give you the answers they think you want to hear).
This doesn’t mean surveys aren’t useful. For tracking trends over time, they are especially useful. They can also give you a precise value you can easily justify. For example, you can say something like:
“Members tell us they’re spending $343 per year because of the community”
But if you’re going to use them to calculate value just be mindful of the downsides as much as the upsides.
Assigning Values To Behaviors
The final approach is to assign values to member behaviours. There are two common ways to achieve this, regression analysis and alternative costs.
Regression Analysis To Assign Values To Behaviors
Let’s tackle regression (or multiple regression) analyses. This is where you look at how a change in one variable relates to another. So you might look at how changes in independent variables like asking questions, reading articles, and receiving answers affect a dependent variable such as additional sales or revenue.
This study will give you coefficients which let you assign a value to this behaviour. This helps you make statements like “We know members who ask a question spend $4 more”.
However, be mindful of the phrasing above. We’re not claiming asking a question causes the increase in spending. We’re simply asserting members who do this one thing also do this other thing. This is correlation, not causation.
This methodology offers a precise value that helps you estimate the potential value of the community and the key behaviours you might want to encourage more of.
You can see an example of this in our work with The Pragmatic Institute.
Alternative Costs
Perhaps a more familiar approach is to look at the comparative cost (i.e. what would it cost to achieve the same result if the community didn’t exist?).
The most common form of this is call deflection. This is how much it would cost to support the same number of customers if the community didn’t exist.
In the standard approach, you calculate the value of a view of an answered question and multiply it by the number of answered questions. This doesn’t mean these cost savings were realised (not many people actually reduce the size of their support team). But it gives a theoretical value to a community.
Other approaches include calculating the cost of acquiring customers, and traffic, or creating the same amount of content if the community didn’t exist. First, you find the baseline cost of the work today. Second, you determine the cost of a single incident of the behaviour happening in the community. Then you multiply this figure by the number of behaviours in the community.
This will you let assert an answer like ‘the community is potentially saving $7.04m per year in deflected tickets’
Which Approach Should You Use?
If each approach has significant advantages and disadvantages, how do you determine which is the best approach for you?
This depends upon your organisation. You shouldn’t develop the methodology alone because it might later be picked apart due to inherent flaws. If we know every approach has flaws, it’s good to determine which flaws are already acceptable to your organisation (or department) and select that approach.
This means it’s useful to investigate which methods are used to calculate the value of other activities within that function.
This might include questions such as
- How are dollar returns calculated for activities within that department today?
- Do they want to adopt a similar method for calculating community activity?
- What kind of formula or methodology are they expecting?
- How will the results be used in the decision-making process?
Find out which methodologies are already in use, and you can adopt a similar methodology to the community.
Once you know the methodology, you can zero in on the specific value metric.
Zeroing In On The Metric
It’s not possible to cover every possible metric, but it might help to cover some of the most common approaches below based on the methodology.
| Purpose | Approach | Common Method(s) |
|---|---|---|
| Customer Support | Value Assignment | Call Deflection Method (No. visitors to accepted solutions * % who state they received the answer * % who would otherwise have contacted support (* % in warranty) * avg. cost per ticket. Monthly Contact Rate No. members * (avg. contact rate of non-members - avg. contact rate of members) * avg. cost per contact. |
| Customer Support | Controlled Experiment | Expose or withhold community from a group Remove community access from one or more product groups and measure the increase or decrease on customer support tickets. |
| Customer Retention | Paired Groups | Member vs. non-member retention rate Avg. annual retention rate of members - avg. the annual retention rate of non-members * no. members * avg. value of a customer. Trial completion rate % trial completion of new community members - % trial completion of non-members * avg. value of completing trial (CLV) * no. new community members. |
| Customer Retention | Controlled Experiment | Invite One Group, Block Another Invite one group of prospects to join the community and hide the community from another. Compare the results after a fixed time frame. |
| Customer Acquisition | Value Assignment | Track signups from the community Calculating the avg. lifetime value of members who joined the community prior to becoming a customer. Track conversions from the corporate site Conversion rate of visitors to corporate site * visitors from the community. Track direct sales Direct sales of products and upgrades promoted to the community. Track value of leads Number of leads sourced from community sources * avg. value of a lead. |
The right metric for your community might not be above. The key, however, is to engage with others to calculate the right metric for your organisation.
If you need help here, drop us a line.
PART TWO – IMPACT
If the value refers to a dollar return, impact refers to everything which isn’t a dollar return.
Much of the work of the community sits several levels beneath calculable value.
For example, if a salesperson uses the community to gather testimonials, how would you quantify the value of that? You can’t attribute the sale to the community, yet few organisations want to do a test comparing presentations with testimonials as opposed to those without. Yet, you know it has an impact.
If you’re not under pressure to show a dollar value return, you have a lot more flexibility to develop a method that truly reflects the impact of your community.
But be mindful of a potential problem here. The further you drift from a dollar value, the more likely it is people will question your metric. Everyone understands dollars, fewer people understand impact.
The challenge is to strike the balance between metrics that perfectly encapsulate the value of the community and those which will be accepted internally.
As a general rule, the more support there is for the community internally, the more you can design community-specific metrics.
This also serves as a good rule of thumb. The less internal support exists for the community, the more you need to skew the metrics in favour of value over impact.
Using Existing Benchmarks
The first step is to find out if there are already metrics which can be used to benchmark the community against.
These might not be dollar-value metrics. Instead, they might refer to things like member sentiment (or change in sentiment). In this case, you might compare a community by the quality of answers provided by members or the quantity of content created.
There isn’t any shortage of potential impact metrics you can use here. So begin by asking a few key questions for whatever department or purpose(s) your community serves. These questions might include:
- How are results measured?
- What metrics are important? And why?
- How are those metrics calculated?
- Who gets the metrics and what do they do with them?
- Is the community likely to be compared against them?
Based on the department your community serves, there are some common metrics you might need to use here. These include
- Net Promoter Score
- Customer Satisfaction Score
- Customer Contact Rate
- Task Completion Rate
- Product Adoption Rate
- No. Bugs Resolved.
- No Features Implemented
If you adopt one of these metrics for your community, be mindful of the context.
There are many areas where a community will naturally have advantages or disadvantages against other programs.
One client, for example, had terrible NPS scores compared with other customer support channels. The problem wasn’t the community experience. The problem was the community had been positioned as the final destination for people who hadn’t been able to solve their problems through any other channel. These are the same people who were already frustrated before they arrived in the community. Often they simply had problems which couldn’t be solved and had nowhere else to express their frustration.
Comparing the NPS scores of someone in a community vs. someone who gets personalised help on a support call doesn’t make sense unless cost is considered in the conclusion. This is why you might want to compare NPS scores/cost of each contact as a metric rather than just NPS scores.
Never take a single benchmark from another program and apply it to the community. Always consider the unique context and ensure this is reflected in your recommendations.
Is Engagement The Goal?
If you don’t have existing benchmarks to compare against, you have the option to design a unique metric for the community. The most common example is to use some measure of engagement.
We’ve talked endlessly about the challenge of using engagement metrics to serve as the north star (I wrote an entire book about it).
Put simply, the problem with using engagement is many people simply don’t value engagement. Even those who just want to see a lot of engagement in a community recognise not all engagement is good (if they disagree, try removing the spam filter).
We’ve worked with dozens of clients over the year who just want to see a highly engaged community. They might not know precisely what success looks like, but they know having a huge number of people highly engaged in an ecosystem they control is critically important.
This is where you want to probe a little deeper to find out exactly what they want to see.
- What is your definition of community?
- What kind of metrics do you want to see?
- How will you know if the community is achieving its goals?
- What does success or failure look like?
You might not need precise metrics here, but you should be able to get to a business question which you can then translate into more precise metrics.
Setting Engagement Metrics
If engagement is the goal, the next step is to translate the broad goals you’ve been given in discussions into more specific metrics.
This is where you need to ‘operationalize’ a goal. This can sound far more complicated than it really is. Essentially, you look for metrics which reflect what stakeholders have said they’re trying to achieve.
For example “I want to see a thriving community with thousands of members reflecting our diverse audience and lots of healthy discussions”
In this example, you can see the number of members, diversity of the audience, and quality of discussion matters. So you might begin testing metrics such as
- No. active members (1+ posts in the past 30 days).
- % of members from each core audience group.
- No. responses to questions.
There aren’t any rigid rules about this process so go with what works best for you. Notice how important it is to pay close attention to language. If the person had referred to thousands of ‘happy members’, we would have also incorporated satisfaction score in there too.
Develop the potential metrics and check internally if they accurately reflect the business question.
Resource: CMX Indispensable Community Talk.
Establishing Community-Driven Impact Score
If engagement isn’t a goal (but you know there aren’t existing benchmarks to use), you have the freedom to come up with a better method. This is where we recommend the Community-Driven Impact Score.
This is a simple process where you ask members what the impact is and multiply this by the no. members represented.
For example
- On a scale of 0 to 10, to what extent did the community influence your likelihood to renew your subscription?
If you have an average score of 8.8 and 10,000 visitors, that’s a score of 88k. Your job is to make that score go up by increasing the number of visitors or improving the impact of community upon members.
In our minds, this is the purest score which reflects the unique impact of community. However, it requires deep internal support and understanding to be fully utilised.
Resource: Setting Up Community-Driven Impact Score.
Next Steps
Begin the process of finding a north star metric with the full process in mind. Once you know the process, you can start guiding others through it and find a metric which works for everyone. This includes
1) Outline the process for your colleagues (and bring everyone along on the journey). There isn’t much point in developing a north-star metric if no one else supports it. Instead, if you bring people with you on the journey of discovery you can ideally land upon a metric which works for everyone. Make sure everyone understands the process of finding your north star.
2) Make sure people understand the limitations of metrics. If you need to calculate the dollar value return, make sure everyone understands the limitations of each approach and try to find how other departments have accepted the trade-off to find the right metric.
3) Use existing methods and benchmarks where possible. If you don’t need to show a dollar value, find out if there are existing benchmarks to compare against and if not you can develop community-specific metrics for your organisation. This might mean tracking some measure of engagement or utilising the Community-Driven Impact score.
4) Repeat this process this when things change. This isn’t a one-time process. As stakeholders and corporate strategies change you will likely need to revive and update the process over time. Renew the effort as often as needed and try to expand the value of the community over time.
If you feel you need expert help to develop this process and gain internal support, contact FeverBee.
Resources
Article: The Tyranny of Metrics
Article: The Engagement Trap
Article: Don’t Use Bogus Metrics
Template: The Community ROI Flow-Chart
Template: 46 Questions for Uncovering Community Goals
Template: A Framework For Hosting A Successful Workshop To Gain Alignment On Community Goals
Article: Setting Up Community-Driven Impact Score
Talk: CMX Indispensable Community Talk
Book: The Indispensable Community


