Misc
Chart: A Global Look at How People Spend Their Time
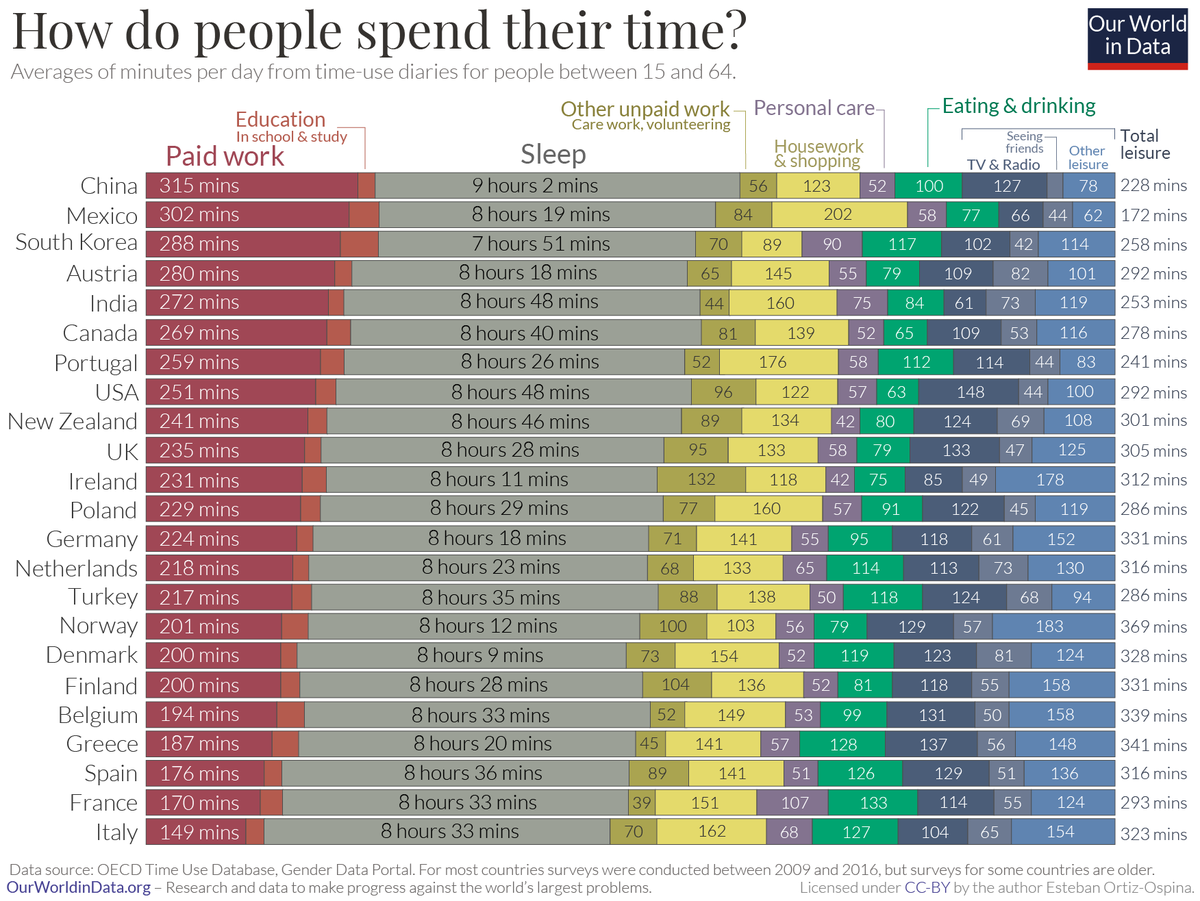
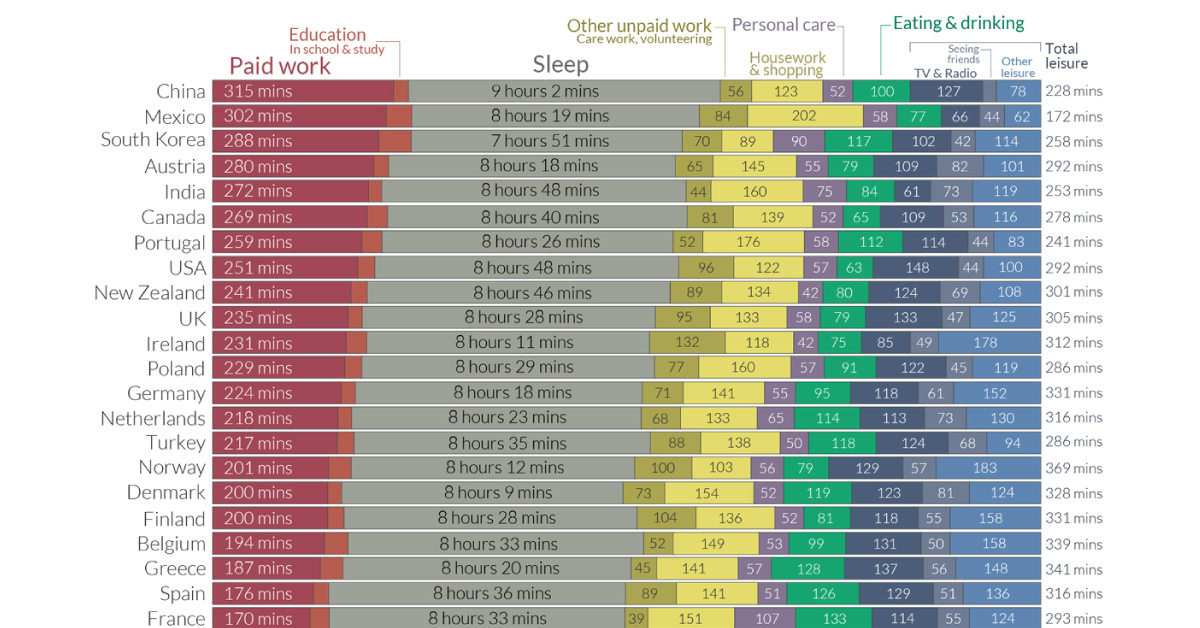
A Global Look at How People Spend Their Time
We all have the same 24 hours in a day, but we don’t spend them the same way. Some prioritize family time or household chores, while others cherish a good night’s sleep or seeing friends.
This chart from Our World in Data compares the average time allocated across various day-to-day activities, from paid work to leisurely activities.
The data for the 33 countries profiled come from the Organization for Economic Co-operation and Development (OECD)’s Time Use database, for ages 15 through 64 years old.
Countries with the Highest Time Spent Per Activity
As the chart shows, basic patterns—work, rest, and play—emerge across the board.
When it comes to paid work, Japan emerges the highest on this list with approximately 5.5 hours per day. However, this country also has some of the highest overtime in a workweek. In contrast, European countries such as France and Spain report nearly half the same hours (less than 3 hours) of paid work per day on average.
Certain trends, however, transcend cultural boundaries. Those in Mexico find themselves spending significant portions of the day (3 hours or more) on housework, as do those in Portugal.
| Activity category | Country with highest time spent | Time spent in minutes |
|---|---|---|
| Paid work | 🇯🇵 Japan | 326 (Approx. 5.5 hrs) |
| Education | 🇰🇷 South Korea | 57 |
| Care for household members | 🇮🇪 Ireland | 61 |
| Housework | 🇲🇽 Mexico | 187 (Approx. 3 hrs) |
| Shopping | 🇩🇪 Germany | 32 |
| Other unpaid work & volunteering | 🇯🇵 Japan | 98 (Approx. 1.5 hrs) |
| Sleep | 🇿🇦 South Africa | 553 (Approx. 9 hrs) |
| Eating | 🇫🇷 France | 133 (Approx. 2 hours) |
| Personal care | 🇫🇷 France | 107 (Approx. 1 hr 45 min) |
| Sports | 🇪🇸 Spain | 42 |
| Attending events | 🇮🇪 Ireland | 42 |
| Seeing friends | 🇿🇦 South Africa | 82 |
| TV and radio | 🇺🇸 U.S. | 148 (Approx. 2.5 hrs) |
| Other leisure (Religious/ civic duties, or unspecified) | 🇳🇴 Norway | 154 (Approx. 2.5 hrs) |
As the saying goes, all work and no play makes Jack a dull boy. In the realm of leisure activities, those in the U.S. spend approximately 2.5 hours consuming media in a day, a number that has risen even higher during the pandemic.
Meanwhile, another interesting cultural pattern is that people in France spend the most time eating, approximately 2 hours per day. These durations are similar to those in other Mediterranean countries such as Greece, Italy, and Spain—perhaps because meals are viewed as a social activity in these cultures.
Gender Disparities in Time Spent
Digging deeper, another way to look at how people spend their time globally is through the lens of gender.
Women spend nearly three times more in unpaid care work compared to men—a whopping total of 1.1 trillion hours each year—which means a lot less leisure time. This inequality is clearly defined by country in the following scatterplot:
In Norway, both men and women have equally high levels of leisure time—though it’s a rare example of such a case.
Meanwhile, in countries like India or China, significant gender gaps prevent women from moving up the socioeconomic ladder, potentially costing trillions of dollars to the global economy.


Misc
How Hard Is It to Get Into an Ivy League School?
We detail the admission rates and average annual cost for Ivy League schools, as well as the median SAT scores required to be accepted.


How Hard Is It to Get Into an Ivy League School?
This was originally posted on our Voronoi app. Download the app for free on iOS or Android and discover incredible data-driven charts from a variety of trusted sources.
Ivy League institutions are renowned worldwide for their academic excellence and long-standing traditions. But how hard is it to get into one of the top universities in the U.S.?
In this graphic, we detail the admission rates and average annual cost for Ivy League schools, as well as the median SAT scores required to be accepted. The data comes from the National Center for Education Statistics and was compiled by 24/7 Wall St.
Note that “average annual cost” represents the net price a student pays after subtracting the average value of grants and/or scholarships received.
Harvard is the Most Selective
The SAT is a standardized test commonly used for college admissions in the United States. It’s taken by high school juniors and seniors to assess their readiness for college-level academic work.
When comparing SAT scores, Harvard and Dartmouth are among the most challenging universities to gain admission to. The median SAT scores for their students are 760 for reading and writing and 790 for math. Still, Harvard has half the admission rate (3.2%) compared to Dartmouth (6.4%).
| School | Admission rate (%) | SAT Score: Reading & Writing | SAT Score: Math | Avg Annual Cost* |
|---|---|---|---|---|
| Harvard University | 3.2 | 760 | 790 | $13,259 |
| Columbia University | 3.9 | 750 | 780 | $12,836 |
| Yale University | 4.6 | 760 | 780 | $16,341 |
| Brown University | 5.1 | 760 | 780 | $26,308 |
| Princeton University | 5.7 | 760 | 780 | $11,080 |
| Dartmouth College | 6.4 | 760 | 790 | $33,023 |
| University of Pennsylvania | 6.5 | 750 | 790 | $14,851 |
| Cornell University | 7.5 | 750 | 780 | $29,011 |
*Costs after receiving federal financial aid.
Additionally, Dartmouth has the highest average annual cost at $33,000. Princeton has the lowest at $11,100.
While student debt has surged in the United States in recent years, hitting $1.73 trillion in 2023, the worth of obtaining a degree from any of the schools listed surpasses mere academics. This is evidenced by the substantial incomes earned by former students.
Harvard grads, for example, have the highest average starting salary in the country, at $91,700.

-

 Real Estate2 weeks ago
Visualizing America’s Shortage of Affordable Homes
-

 Technology1 week ago
Ranked: Semiconductor Companies by Industry Revenue Share
-

 Money2 weeks ago
Which States Have the Highest Minimum Wage in America?
-

 Real Estate2 weeks ago
Ranked: The Most Valuable Housing Markets in America
-

 Business2 weeks ago
Charted: Big Four Market Share by S&P 500 Audits
-

 AI2 weeks ago
The Stock Performance of U.S. Chipmakers So Far in 2024
-

 Misc2 weeks ago
Almost Every EV Stock is Down After Q1 2024
-

 Money2 weeks ago
Where Does One U.S. Tax Dollar Go?