Misc
Chart: A Global Look at How People Spend Their Time
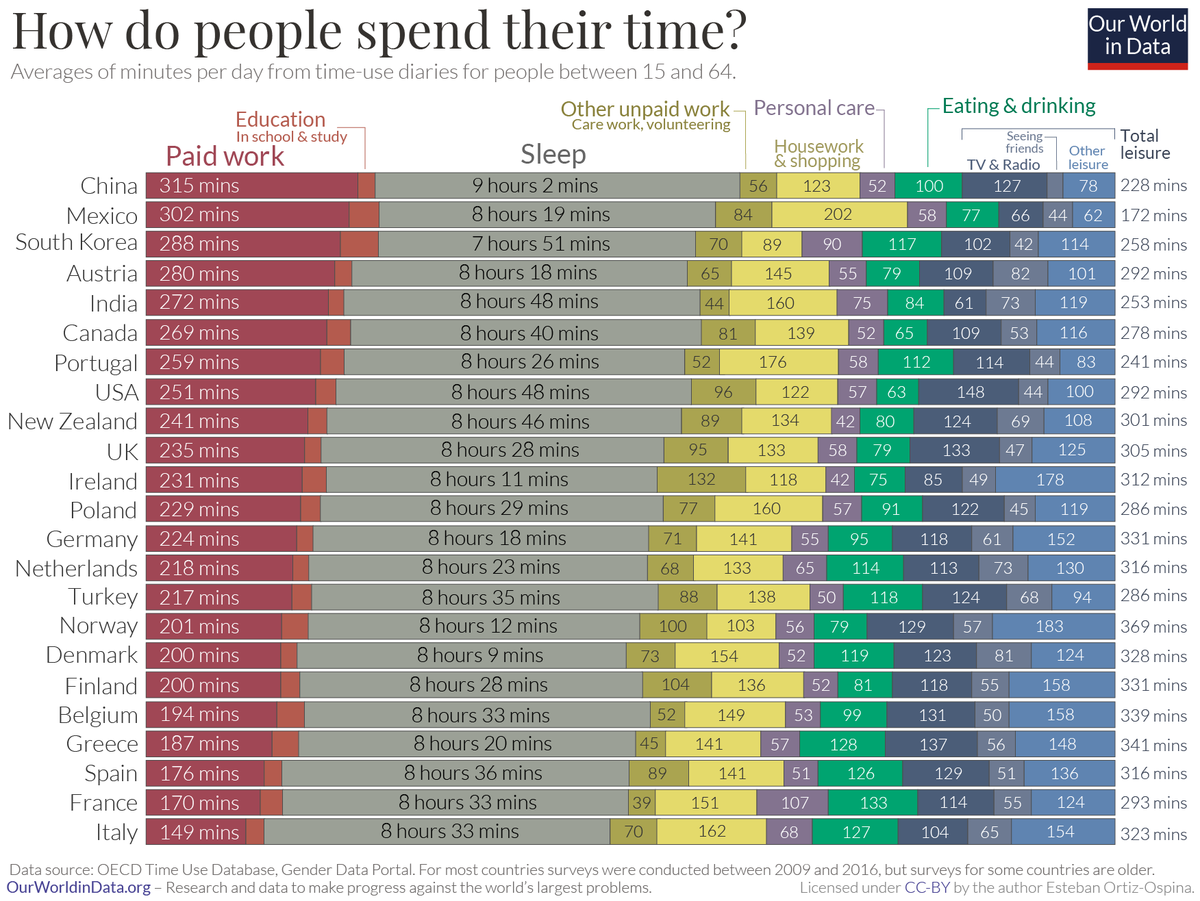
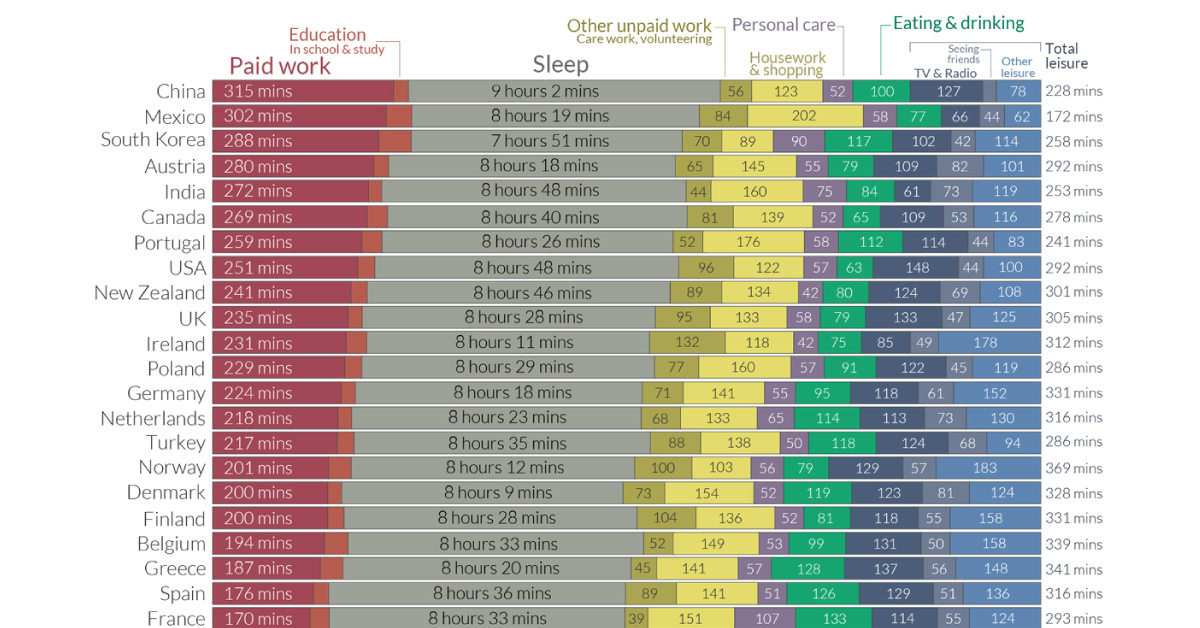
A Global Look at How People Spend Their Time
We all have the same 24 hours in a day, but we don’t spend them the same way. Some prioritize family time or household chores, while others cherish a good night’s sleep or seeing friends.
This chart from Our World in Data compares the average time allocated across various day-to-day activities, from paid work to leisurely activities.
The data for the 33 countries profiled come from the Organization for Economic Co-operation and Development (OECD)’s Time Use database, for ages 15 through 64 years old.
Countries with the Highest Time Spent Per Activity
As the chart shows, basic patterns—work, rest, and play—emerge across the board.
When it comes to paid work, Japan emerges the highest on this list with approximately 5.5 hours per day. However, this country also has some of the highest overtime in a workweek. In contrast, European countries such as France and Spain report nearly half the same hours (less than 3 hours) of paid work per day on average.
Certain trends, however, transcend cultural boundaries. Those in Mexico find themselves spending significant portions of the day (3 hours or more) on housework, as do those in Portugal.
| Activity category | Country with highest time spent | Time spent in minutes |
|---|---|---|
| Paid work | 🇯🇵 Japan | 326 (Approx. 5.5 hrs) |
| Education | 🇰🇷 South Korea | 57 |
| Care for household members | 🇮🇪 Ireland | 61 |
| Housework | 🇲🇽 Mexico | 187 (Approx. 3 hrs) |
| Shopping | 🇩🇪 Germany | 32 |
| Other unpaid work & volunteering | 🇯🇵 Japan | 98 (Approx. 1.5 hrs) |
| Sleep | 🇿🇦 South Africa | 553 (Approx. 9 hrs) |
| Eating | 🇫🇷 France | 133 (Approx. 2 hours) |
| Personal care | 🇫🇷 France | 107 (Approx. 1 hr 45 min) |
| Sports | 🇪🇸 Spain | 42 |
| Attending events | 🇮🇪 Ireland | 42 |
| Seeing friends | 🇿🇦 South Africa | 82 |
| TV and radio | 🇺🇸 U.S. | 148 (Approx. 2.5 hrs) |
| Other leisure (Religious/ civic duties, or unspecified) | 🇳🇴 Norway | 154 (Approx. 2.5 hrs) |
As the saying goes, all work and no play makes Jack a dull boy. In the realm of leisure activities, those in the U.S. spend approximately 2.5 hours consuming media in a day, a number that has risen even higher during the pandemic.
Meanwhile, another interesting cultural pattern is that people in France spend the most time eating, approximately 2 hours per day. These durations are similar to those in other Mediterranean countries such as Greece, Italy, and Spain—perhaps because meals are viewed as a social activity in these cultures.
Gender Disparities in Time Spent
Digging deeper, another way to look at how people spend their time globally is through the lens of gender.
Women spend nearly three times more in unpaid care work compared to men—a whopping total of 1.1 trillion hours each year—which means a lot less leisure time. This inequality is clearly defined by country in the following scatterplot:
In Norway, both men and women have equally high levels of leisure time—though it’s a rare example of such a case.
Meanwhile, in countries like India or China, significant gender gaps prevent women from moving up the socioeconomic ladder, potentially costing trillions of dollars to the global economy.


Politics
Charted: How Americans Feel About Federal Government Agencies
Fourteen of 16 federal government agencies garnered more favorable responses than unfavorable ones. But what were the outliers?
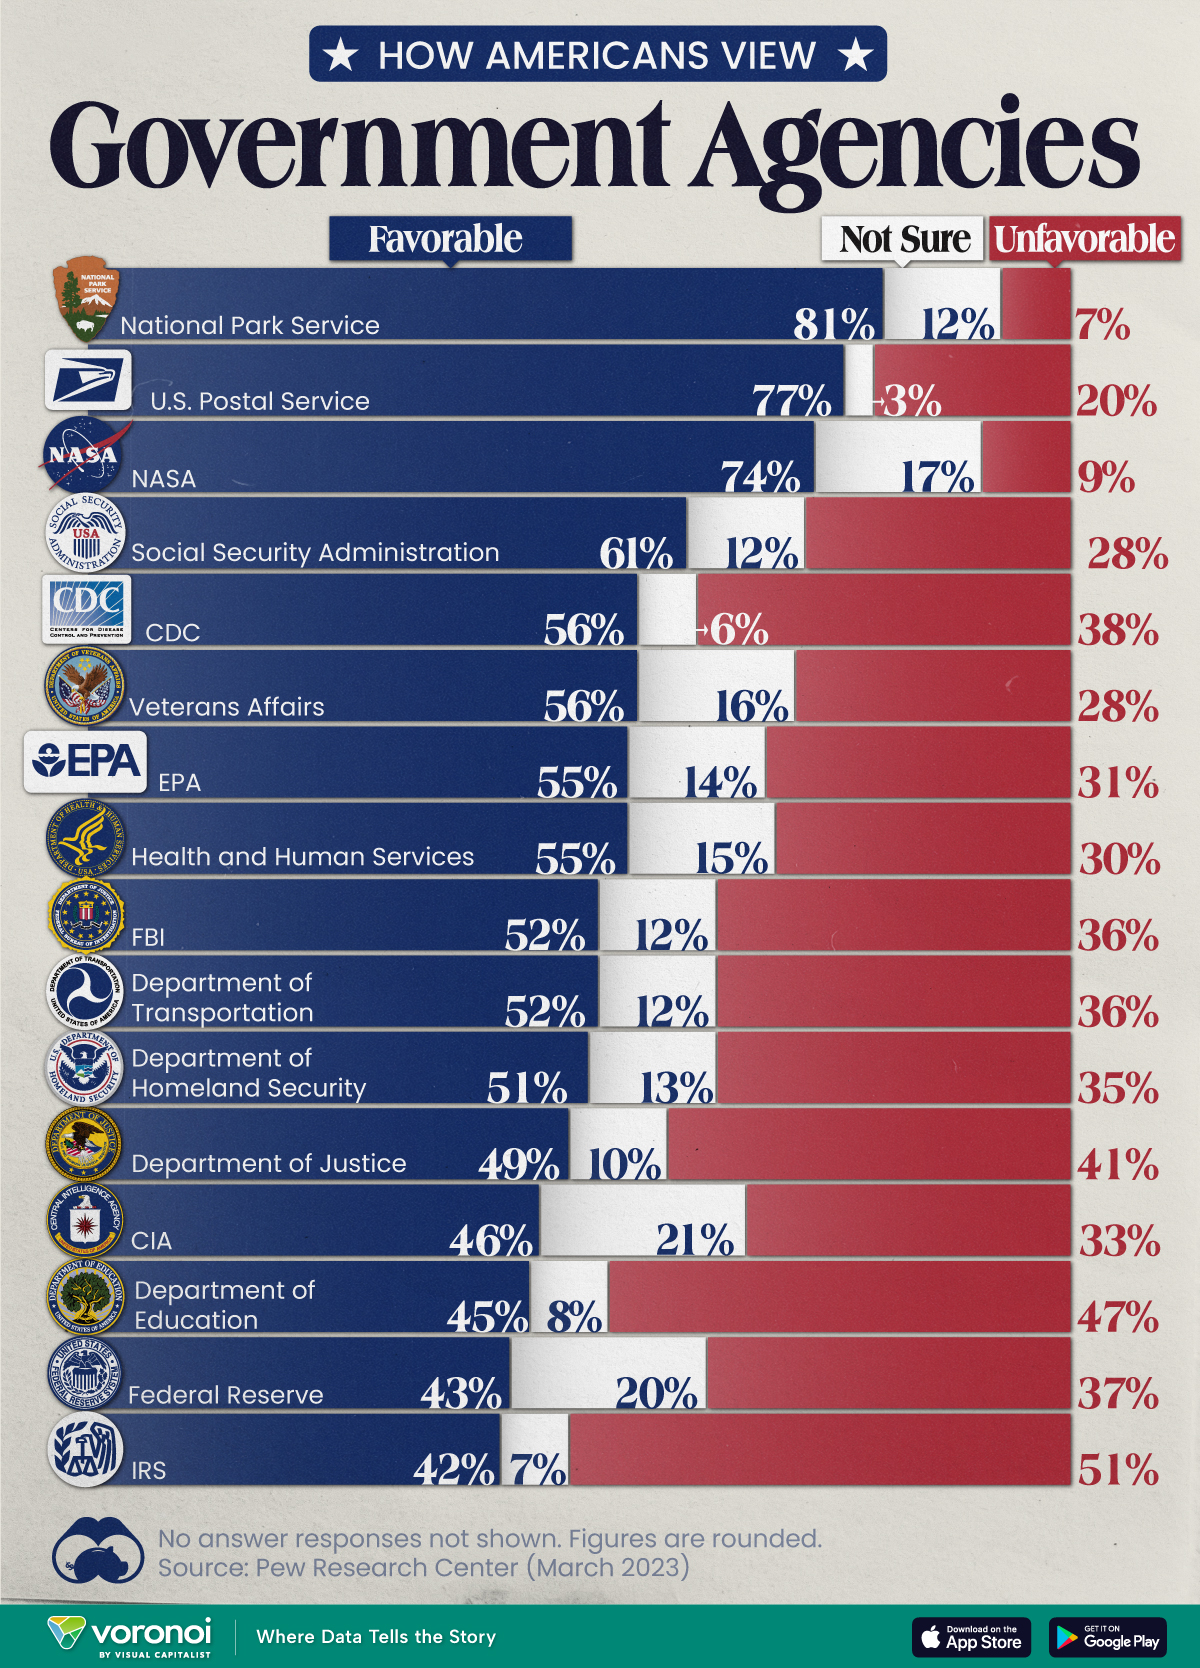

Chart: How Americans Rate 16 Federal Government Agencies
This was originally posted on our Voronoi app. Download the app for free on iOS or Android and discover incredible data-driven charts from a variety of trusted sources.
Come election time, America won’t hesitate to show its approval or disapproval of the country’s elected political representatives. That said, feelings about the federal bureaucracy and its associated agencies are a little harder to gauge.
We chart the results from an opinion poll conducted by Pew Research Center between March 13-19, 2023. In it, 10,701 adults—a representative of the U.S. adult population—were asked whether they felt favorably or unfavorably towards 16 different federal government agencies.
Americans Love the Park Service, Are Divided Over the IRS
Broadly speaking, 14 of the 16 federal government agencies garnered more favorable responses than unfavorable ones.
Of them, the Parks Service, Postal Service, and NASA all had the approval of more than 70% of the respondents.
| Agency | Favorable | Unfavorable | Not sure |
|---|---|---|---|
| 🏞️ National Park Service | 81% | 7% | 12% |
| 📮 U.S. Postal Service | 77% | 20% | 3% |
| 🚀 NASA | 74% | 9% | 17% |
| 💼 Social Security Administration | 61% | 28% | 12% |
| 🔬 CDC | 56% | 38% | 6% |
| 🎖️ Veterans Affairs | 56% | 28% | 16% |
| 🌿 EPA | 55% | 31% | 14% |
| 💉 Health & Human Services | 55% | 30% | 15% |
| 🕵️ FBI | 52% | 36% | 12% |
| 🚗 Department of Transportation | 52% | 36% | 12% |
| 🛡️ Department of Homeland Security | 51% | 35% | 13% |
| ⚖️ Department of Justice | 49% | 41% | 10% |
| 🕵️♂️ CIA | 46% | 33% | 21% |
| 📚 Department of Education | 45% | 47% | 8% |
| 💰 Federal Reserve | 43% | 37% | 20% |
| 💼 IRS | 42% | 51% | 7% |
Note: Figures are rounded. No answer responses are not shown.
Only the Department of Education and the IRS earned more unfavorable responses, and between them, only the IRS had a majority (51%) of unfavorable responses.
There are some caveats to remember with this data. Firstly, tax collection is a less-friendly activity than say, maintaining picturesque parks. Secondly, the survey was conducted a month before taxes were typically due, a peak time for experiencing filing woes.
Nevertheless, the IRS has come under fire in recent years. As per a New York Times article in 2019, eight years of budget cuts have stymied the agency’s ability to scrutinize tax filings from wealthier and more sophisticated filers.
At the same time poorer Americans are facing increasing audits on wage subsidies available to low income workers. According to a Transactional Records Access Clearinghouse report, this subset of filers was audited five-and-a-half more times the average American.

-

 Technology5 days ago
Mapped: The Number of AI Startups By Country
-

 Markets2 weeks ago
The Best U.S. Companies to Work for According to LinkedIn
-

 Economy2 weeks ago
Ranked: The Top 20 Countries in Debt to China
-

 United States2 weeks ago
Charted: Trust in Government Institutions by G7 Countries
-

 Energy2 weeks ago
Mapped: The Age of Energy Projects in Interconnection Queues, by State
-

 Mining2 weeks ago
Visualizing Global Gold Production in 2023
-

 Markets1 week ago
Visualized: Interest Rate Forecasts for Advanced Economies
-

 Economy1 week ago
The Most Valuable Companies in Major EU Economies