A reader asks:
Is there any way of telling when a stock has probably hit its peak, if not for good, for a long, long time? For example, GE hit its all-time peak back in the year 2000, and since then, it’s been on a long decline. What are some signs that an investor can look for that a stock has probably gotten as high as it’s ever going to get?
General Electric is a wonderful example here. The price was as high as $480 a share at the turn of the century:
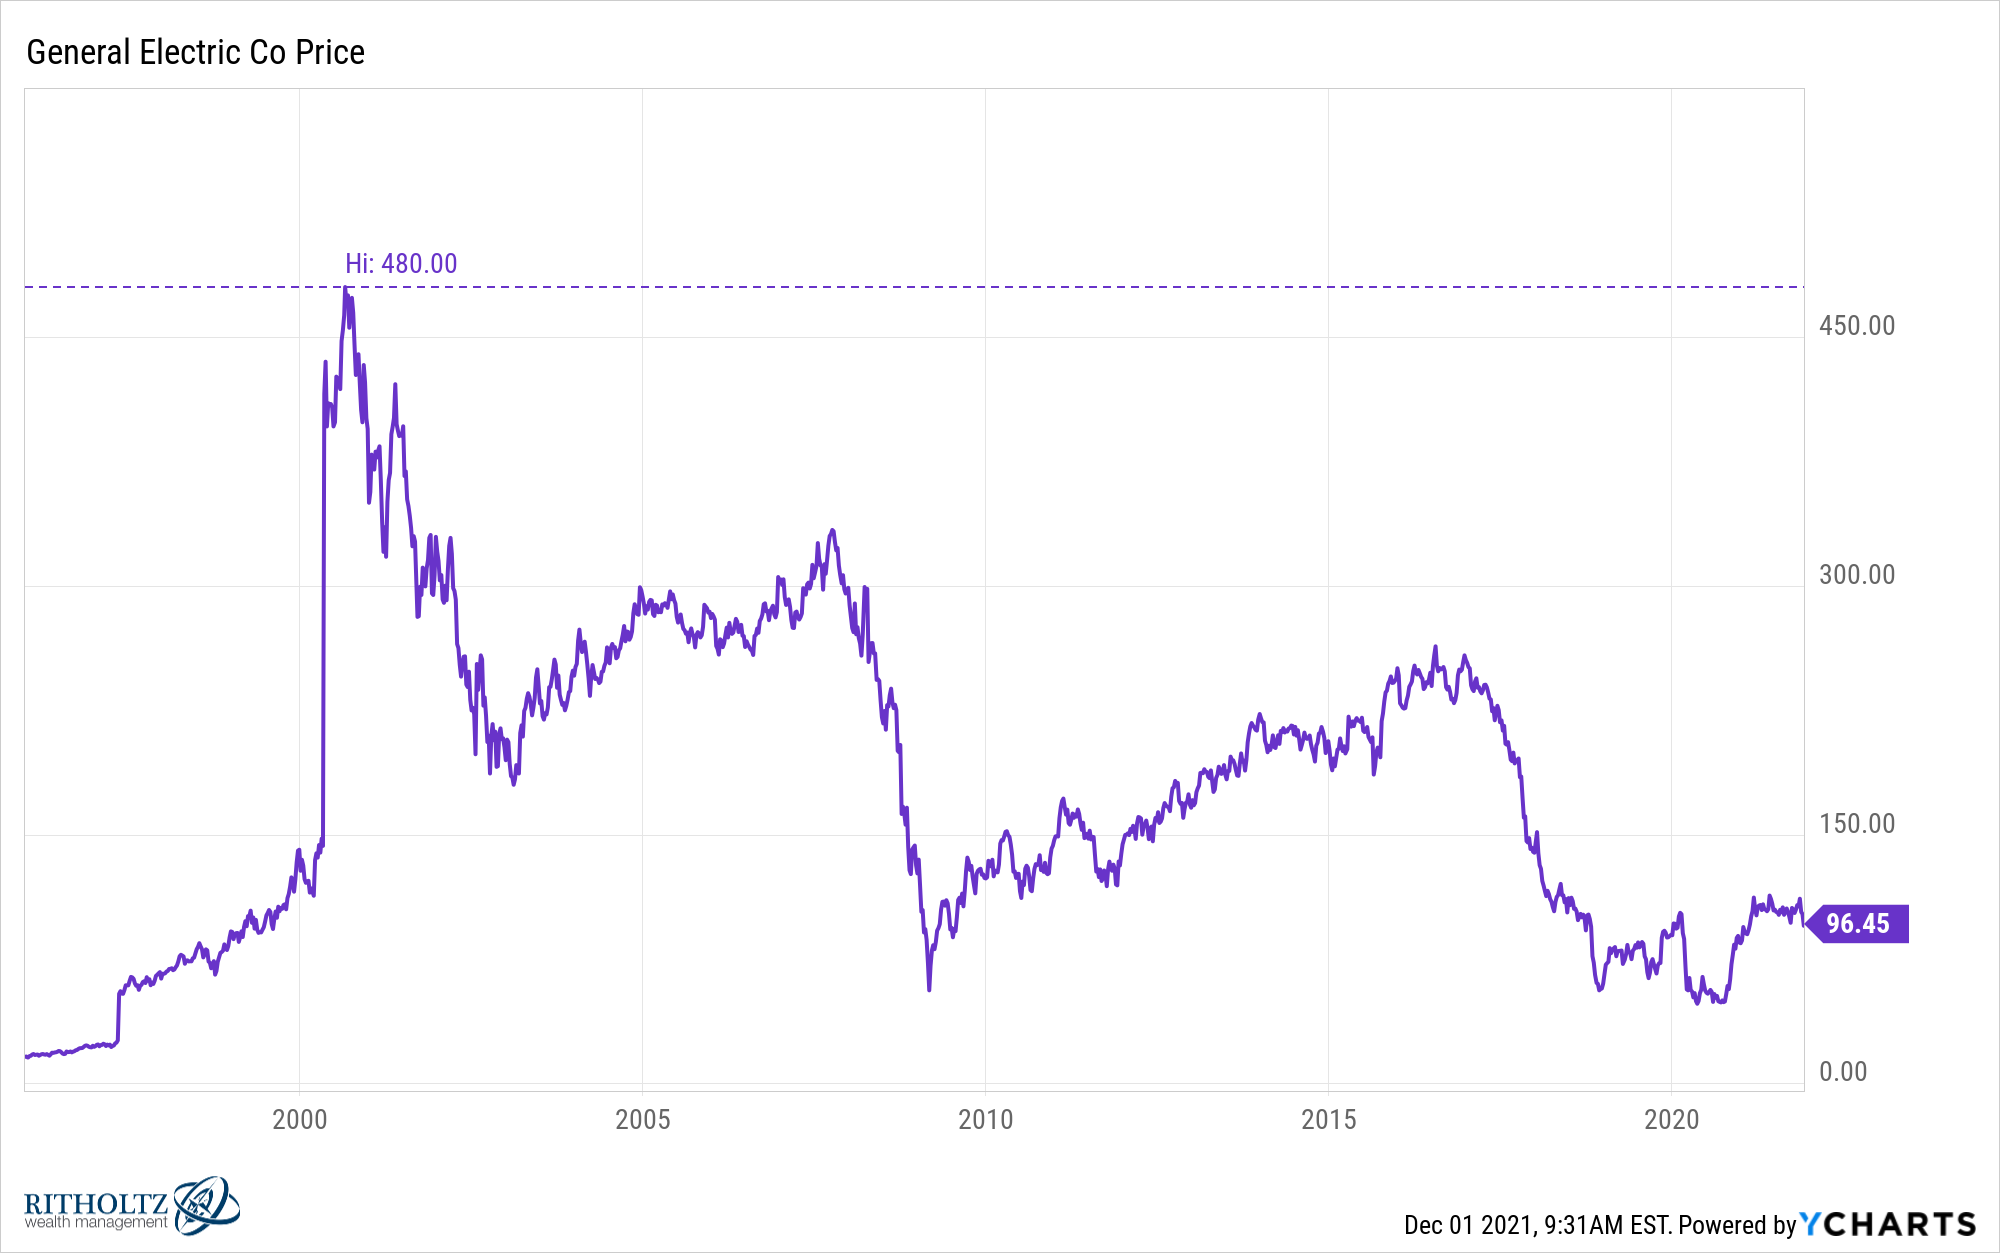
It’s now under one hundred dollars, meaning the share price has fallen 80% from the peak.
This is a notable fall from grace for a stock that was consistently in the top 10 biggest names in the S&P 500 for decades:
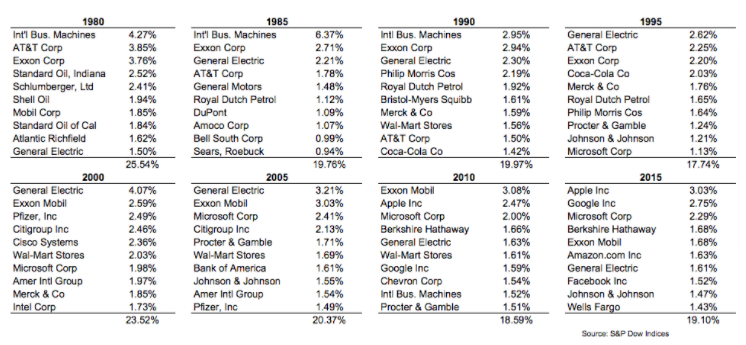
From 1980 to 2015 General Electric was a top 10 holding in the S&P 500. It’s now the 86th largest name in the index.
GE’s share price woes may seem like an outlier but it’s actually the norm.
I count 56 stocks in the S&P 500 that are currently down 50% or worse from their all-time highs. There are 18 names that are down 70% or worse. And these companies are still in the index.
There are way more stocks that have fallen out of the S&P over time.
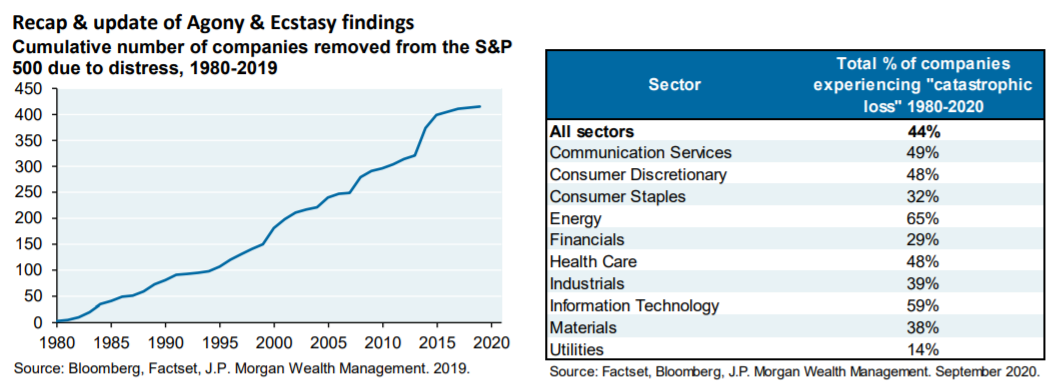
JP Morgan has a report called The Agony & The Ecstasy that’s easily one of my favorite pieces of long-term research on the difficulty of picking the winners in the stock market.
They find more than 40% of stocks in the Russell 3000 since 1980 have experienced a catastrophic loss, meaning the stock fell 70% from peak levels and never reached those levels again.
Some more stats from this report that are borderline mind-blowing if you’re a stock-picker:
- Pick any stock from the Russell 3000 (which is basically the entire U.S. stock market) and two-thirds of the time that stock would have underperformed the index itself.
- More than 40% of all stocks experienced negative returns on an absolute basis.
- Just 10% of all stocks since 1980 can be defined as mega-winners.
Basically you have a much higher probability of picking a mega-loser than a mega-winner in your portfolio.
But because of survivorship bias, we hear far more stories about the winners than the losers. No one likes to brag about a stock that lost them tons of money. Everyone loves a story about a stock that made someone gobs of money.
The winners write the history books.
As to how to spot those companies that are on the precipice of a downfall, that’s very difficult to answer.
JP Morgan’s research found most of the time it wasn’t poor corporate management like Lehman Brothers. It was typically outside forces that caused problems:
- Commodity prices
- Government policy
- Deregulation
- Foreign competitors/globalization
- Intellectual property infringement
- Trade policies
- Fraud
- Technological innovation
- Pricing power collapses
I would imagine some combination of innovation, obsolescence and disruption play the largest role in creating big losers in today’s market.
I had Josh Brown help me answer this one on this week’s Portfolio Rescue:
We also answered questions about buying your first home when you’re single, how much money to leave to your children and how many stocks to own in your portfolio.
Subscribe to The Compound so you never miss an episode and be sure to email us at AskTheCompoundShow@gmail.com if you have a question.
