
Application of PageRank Algorithm to Division I NCAA men’s basketball as bracket formation and outcome predictive utility
Abstract
This article examines the use of the PageRank algorithm to rank the teams and predict team performance in the tournament. This method has the potential to be utilized as an alternative method to choose tournament participants, as opposed to the traditional ranking and seeding process currently employed by the NCAA. PageRank allows for the consideration of all games played during the regular season (average of 5832 games per season) and for customizable performance weights in the prediction. The PageRank algorithm is a viable tool in predicting tournament outcomes due to depth and extensiveness of the data. The PageRank analysis helped to predict over half of the tournament game outcomes correctly in 2014-2018 and produced an average bracket score of 81.8 points out of 192 possible over the same 5 years.
1Introduction
Each year, thousands of people fill out a bracket attempting to predict the outcome of the NCAA Division I Men’s Basketball tournament. Most individuals simply guess winning teams based on a very limited knowledge of the regular season performances of each team. With an average of 5832 games per season (Table 1), it is nearly impossible for any person to watch every game every team plays within the NCAA D1 (National Collegiate Athletic Association, Division-1) season.
Table 1
Number of teams and games by year
| Year | Number of Teams | Number of Games |
| 2014 | 640 | 5800 |
| 2015 | 640 | 5789 |
| 2016 | 640 | 5832 |
| 2017 | 643 | 5829 |
| 2018 | 656 | 5912 |
In NCAA basketball, D1 teams compete in regular season games to be given a chance to play in the final tournament of the season, the NCAA Men’s Division 1 Basketball Tournament (i.e., March Madness, Big Dance), hereafter referred to as the tournament. The NCAA is divided into 32 conferences. The winners from each conference tournament are automatically given a spot (i.e., bid) within the tournament bracket. The remaining 32 positions are based on the selection committee’s decision after careful deliberations. These decisions can be made based on a team’s performance, their location, and even the historic popularity of the school to drive viewership ratings. Another important aspect to these deliberations is that they are behind closed doors.
While it is known that the selection committee typically utilized the Ratings Percentage Index (RPI) as a basis for their decisions in the past before moving to the NCAA Evaluation Tool (NET) they now utilize, there is still room for improvement. Each year, the committee receives scrutiny for their approaches when constructing the tournament bracket of 68 teams. The goal of a committee is to determine which team appears to be more deserving than another. The scrutiny arrives when the committee appears to become subjective by not considering objective measures (e.g., computerized rankings). Lunardi (2018) believes that the committee should have a model that optimizes “performance results (e.g., “most deserving” teams) and predictive data (an objective version of the so-called “eye test”) to rank a widely disparate Division I more accurately.” The PageRank method gives a ranking that is based solely on past and predictive performance. The current selection methods by the selection committee, which may include popularity of a team and expected attendance at the tournament venue, are more subjective.
The investigators will explore whether Google’s PageRank algorithm is sufficient for two purposes. The first purpose is to provide an unbiased alternative (or additional) method for deciding which teams will participate in the tournament. The second will be to find an accurate way to predict outcomes in the NCAA tournament.
To rank the teams, the investigators utilized the PageRank algorithm. PageRank is an algorithm that was developed by Larry Page in 1996 for ranking academic papers. It is a probability distribution that uses a weighted network to optimize rankings, and the past success of a team produces a cumulative advantage that continues to grow as the season continues (Page, et al., 1999).
2Contextual background
2.1Choosing tournament participants
Currently, the NCAA utilizes a team of individuals (i.e., selection committee) to choose and seed the tournament teams. The winner from each conference tournament receives an automatic bid to compete within the tournament, and several other teams will earn an at-large bid partially based on their season performance. These at-large teams are selected based on a variety of undisclosed factors used by the selection committee.
Committee members have access to many resources to be employed in the decision-making process. In addition to watching games during the regular season, they also have access to conference monitoring calls, National Association of Basketball Coaches regional advisory rankings, along with various computer metrics. The entire season’s statistics, including wins, losses, and point margins are considered. Additional factors that may be considered are road record, strength of schedule, player and coach availability, and quality of wins and losses (NCAA.COM, 2019).
Several computer-based methods, including the Saragin method and Rating Percentage Index (RPI) scores, can be utilized to help choose or seed the teams, but do not seem to be any more effective than the current method (Gray & Schwertman, 2012).
With half of the tournament participants being chosen by a selection committee of ten school and conference administrators, there should be a more objective method for choosing teams. During selection, teams are seeded by the committee through a series of confidential polling. Members of the committee are not permitted to vote for or against any team with which a conflict of interest may occur. Although these fail safes have been put in place, the committee members are humans and prone to bias either purposely or unintentionally. Utilizing an algorithm-based selection process could remove some potential bias.
2.2Predicting tournament outcomes
Several analytical methods, including Winning Percentage, Colley Method, Massey Method, and NCAA seed are currently utilized to predict the outcomes of the tournament. Winning percentage is a score calculated from the number of games a team won out of the number of games the team played. This method does not consider the caliber of teams playing, the venue, date in the season, or point margin. The Colley method takes things a step further and computes a rating for each team that depends on the ratings of all the team’s opponents. The Colley method does not take point margin or when the game occurred in the season into account.
The Massey method utilizes transitivity to include game scores in ranking but does not consider when in the season the games are played (Chartier, et al., 2010). Some also predict outcomes by choosing the teams with the higher NCAA seed. This method is only useful in early rounds, as there is no basis for choosing which team would win from different regions (Stekler & Klein, 2012). With the unpredictable nature of sporting events, different methods will achieve better results some years than others. The PageRank method can include individual game point margins as well as the date and venue of the game that could possibly perform at a superior level than the existing ranking tools.
3Method
3.1Data set
A publicly available data source was utilized, Spreadsheet Sports: Sports Analytics and Projection Tools (https://www.spreadsheetsports.com), which provides data on various sports, including college basketball. Data is available by tournament year and provides information on all regular season and conference tournament games. Five seasons of data from 2014-2018 were acquired from this source. The extensiveness of the data set can be seen in Table 1. With thousands of games played each season, an algorithmic computational approach needs to be taken to capture the complete picture. See Table 2 for a sample of the information utilized from the data set to create the network, including: winning team, losing team, point margin, date of the game, and venue.
Table 2
Example information from data set
| Date | Team | Venue | Team Score | Oppenet | Opponent Score | Out come | Point Differential |
| 3/10/2018 | Villanova | Neutral | 76 | Providence | 66 | Win | 10 |
As the PageRank calculation is computationally rigorous, the data set was imported into MATLAB (Matrix Laboratory) as an array. Data was then separated into two separate arrays, team data and game data. The team data consists of a list of all the teams involved in a particular year of NCAA Division I basketball. Each team is assigned a numerical identifier that will assist in building the network later. The game data consists of winning team (identified by numerical identifier), losing team (identified by numerical identifier), point margin, date of game, and venue.
3.2Network creation
A method for building a particular season for analysis can be done by creating a network of nodes and edges. Nodes were created for each team utilizing their unique numerical identifier and containing the team name for eventual identification and analysis. Edges were created for each game linking the losing team and winning team. This network can more specifically be labeled a directed graph where an edge flows from a losing team to winning team.
3.3Directed graph
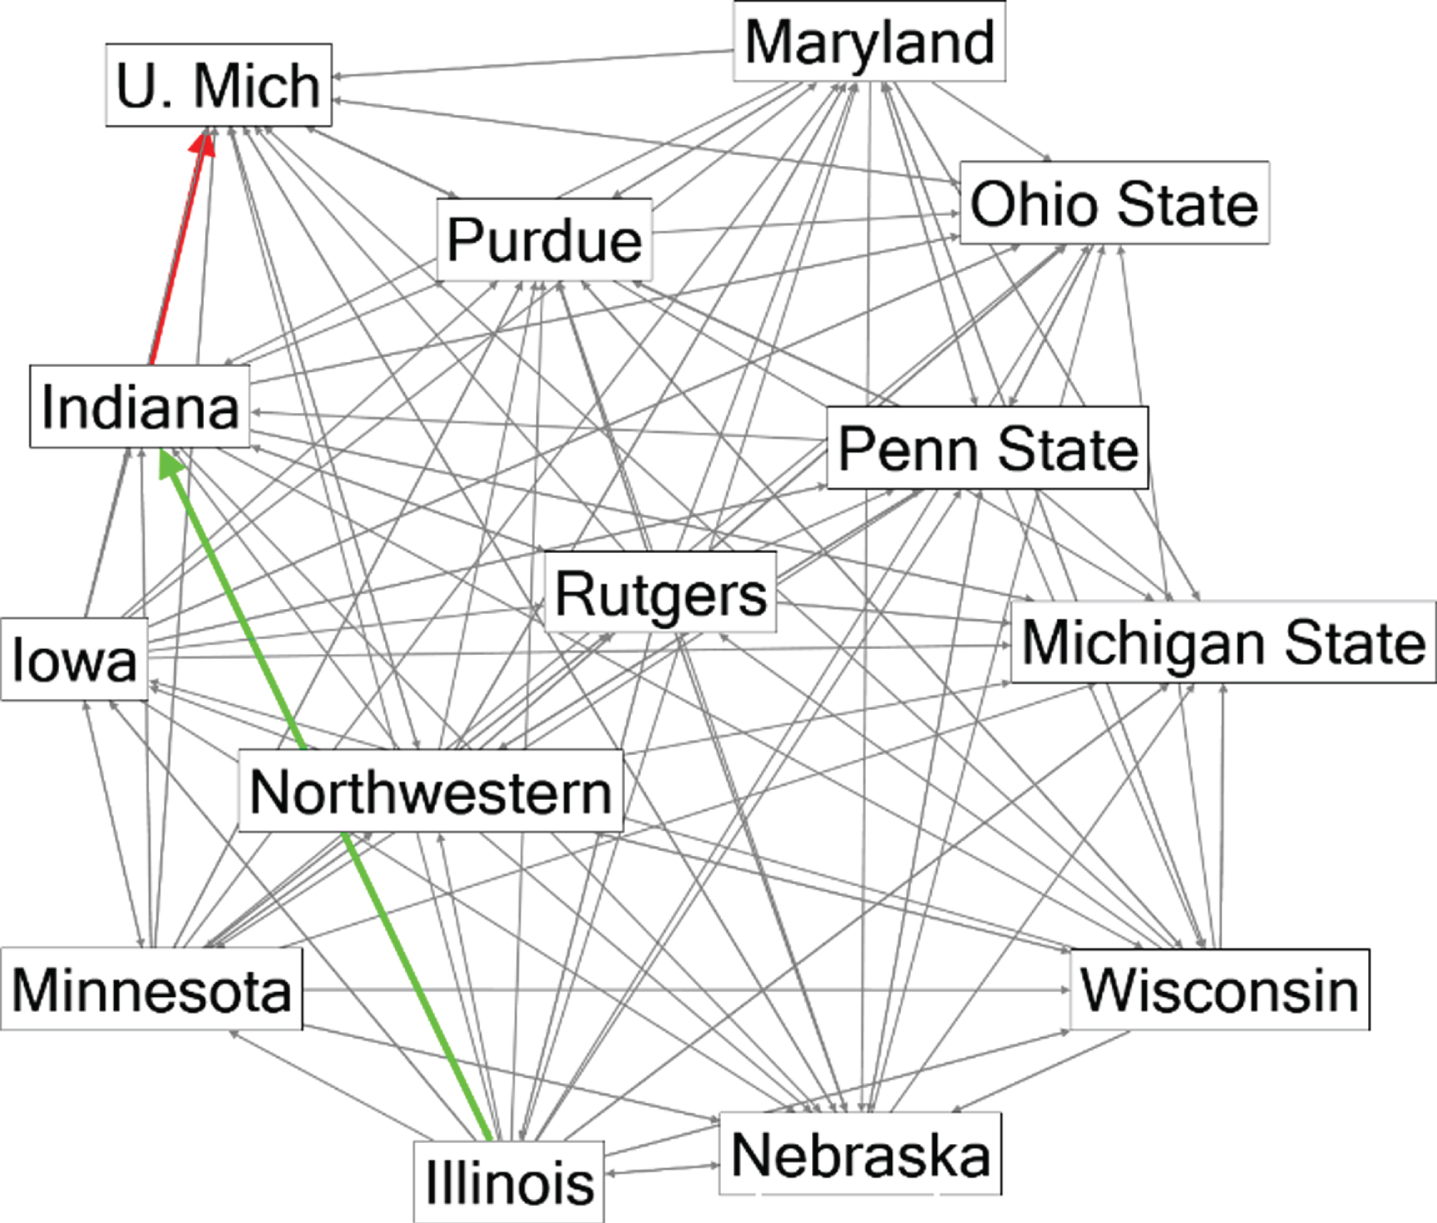
A directed graph allows for a visual representation of all the nodes and edges and essentially the entire season of NCAA Men’s Division 1 Basketball. For illustrative purposes, a subgraph of the entire directed graph for the 2017-2018 season can be seen in Fig. 1. This subgraph is made up of entirely Big 10 conference games. The individual nodes shown as rectangles have edges leaving and entering them. For example, the rectangular box labeled Indiana is the node that represents Indiana University’s men’s basketball team, a green edge can be seen entering this node but originating from the Illinois node. This edge represents a single game played between the University of Illinois and Indiana University. Indiana won this particular game, so the edge’s arrow is directed into the Indiana node. Conversely, Indiana shares another node with the University of Michigan shown in red. This edge’s arrow is directed to enter the University of Michigan’s node representing a loss for Indiana.
Fig. 1
Directed Graph of Big 10 2017-2018 Season.
3.4Weights
The edges were also weighted to provide more accurate representation of the value of each game. Point margin, date, and venue were all mentioned as potential areas to add weights (Chartier, et al., 2010). Adding weights to the edges allows for additional factors to be later considered in the probability distribution analysis of PageRank.
1. Point Margin: The point margin is the number of points a team won the game by over their opponent. The NCAA selection committee’s newest form of team ranking uses point margin as a dynamic in their deliberations. They chose to cap their point margin at 10 points to account for blowout games (Gleeson, 2018). To prevent over-inflation of the weight of any game, a cap was placed on the point margin. This cap was set at the average of the point margins over the entire season. This cap was chosen to reward winners, but not overly penalize losers. Final weights are found utilizing a percentage of the point margin weight.
2. Date: The next weight area that was considered is the date of the game. All teams should be improving as a season progresses. Teams that win later in the season should have increased chances of performing well in the tournament compared with teams who performed well early in the season but lost more games later in the season. The season was divided into four quarters for this analysis. For games won in the first quarter of the season, 50% of the adjusted point margin was awarded. In the second quarter of the season, teams were awarded 75% of the adjusted point margin. The third quarter weights were unaffected by the date of the game. The final quarter leading up to the tournament is viewed as a crucial point for team performance. Because of the importance of winning games close to the tournament time, the weights in the final quarter were 150% of the adjusted point margin. These percentages were discussed further by Professor Tim Chartier in his lecture Bracketology–The Math of March Madness (Chartier, 2014).
3. Venue: The final weight considered was the venue of the game. Teams tend to perform better at home, so less weight is given to teams winning at home. For games played in a neutral venue, both teams were considered to have equal odds, so the point margin was not adjusted for neutral venue games. For games won at home, teams were awarded 75% of the weight calculated from the point margin and date. For games won away, teams were awarded 125% of the weight calculated from the point margin and date.
3.5PageRank calculation
Once the directed graph was created and the edges are weighted the teams can be ranked. To rank the teams, the PageRank algorithm was used, which was originally developed in the webpage search engine revolution of the late 1990’s. The concept is that the webpages are assigned higher PageRank values based not only on the number, but also the quality of the links. Page et al. (1999) gave the PageRank algorithm in early publications as shown in equation 1:
(1)
In terms of basketball teams, PR(A) is the PageRank of team A, PR(Ti) is the PageRank of team Ti linked to team A with a loss, C(Ti) is the number of edges leaving team Ti; that is, number of losses. Finally, d is a damping factor, empirically preferred to be 0.85 (Tennant, et al., 2017).
The algorithm is an iterative process that can be explained by the concept of a random walk through the directed graph. The walker will randomly enter the graph on a node (team) then randomly travel along one of the outward-bound edges (game that was lost) to another node (winning team). This random walk will continuously occur and essentially build a probability distribution on what node (team) the walker would be located at any time.
To force convergence of the PageRank algorithm a damping factor (d = .85) was utilized, this is often referred to as teleportation when applied to the random walk paradigm. At the current node position the walker will 15% of the time not take an outward-bound edge and randomly teleport to another node (team) in the directed graph. This process of teleportation avoids the walker being trapped on a node with no edges out, commonly referred to as a dangling node, in this non-convergence of the algorithm is avoided.
The alternative to teleportation is the random selection of the outward-bound edge (game). This process has been modified in the directed graph to favor certain edges based on the weights discussed previously. This gives the ability to place more emphasis on performance such as a late season win, playing away from home, or winning with a large points margin.
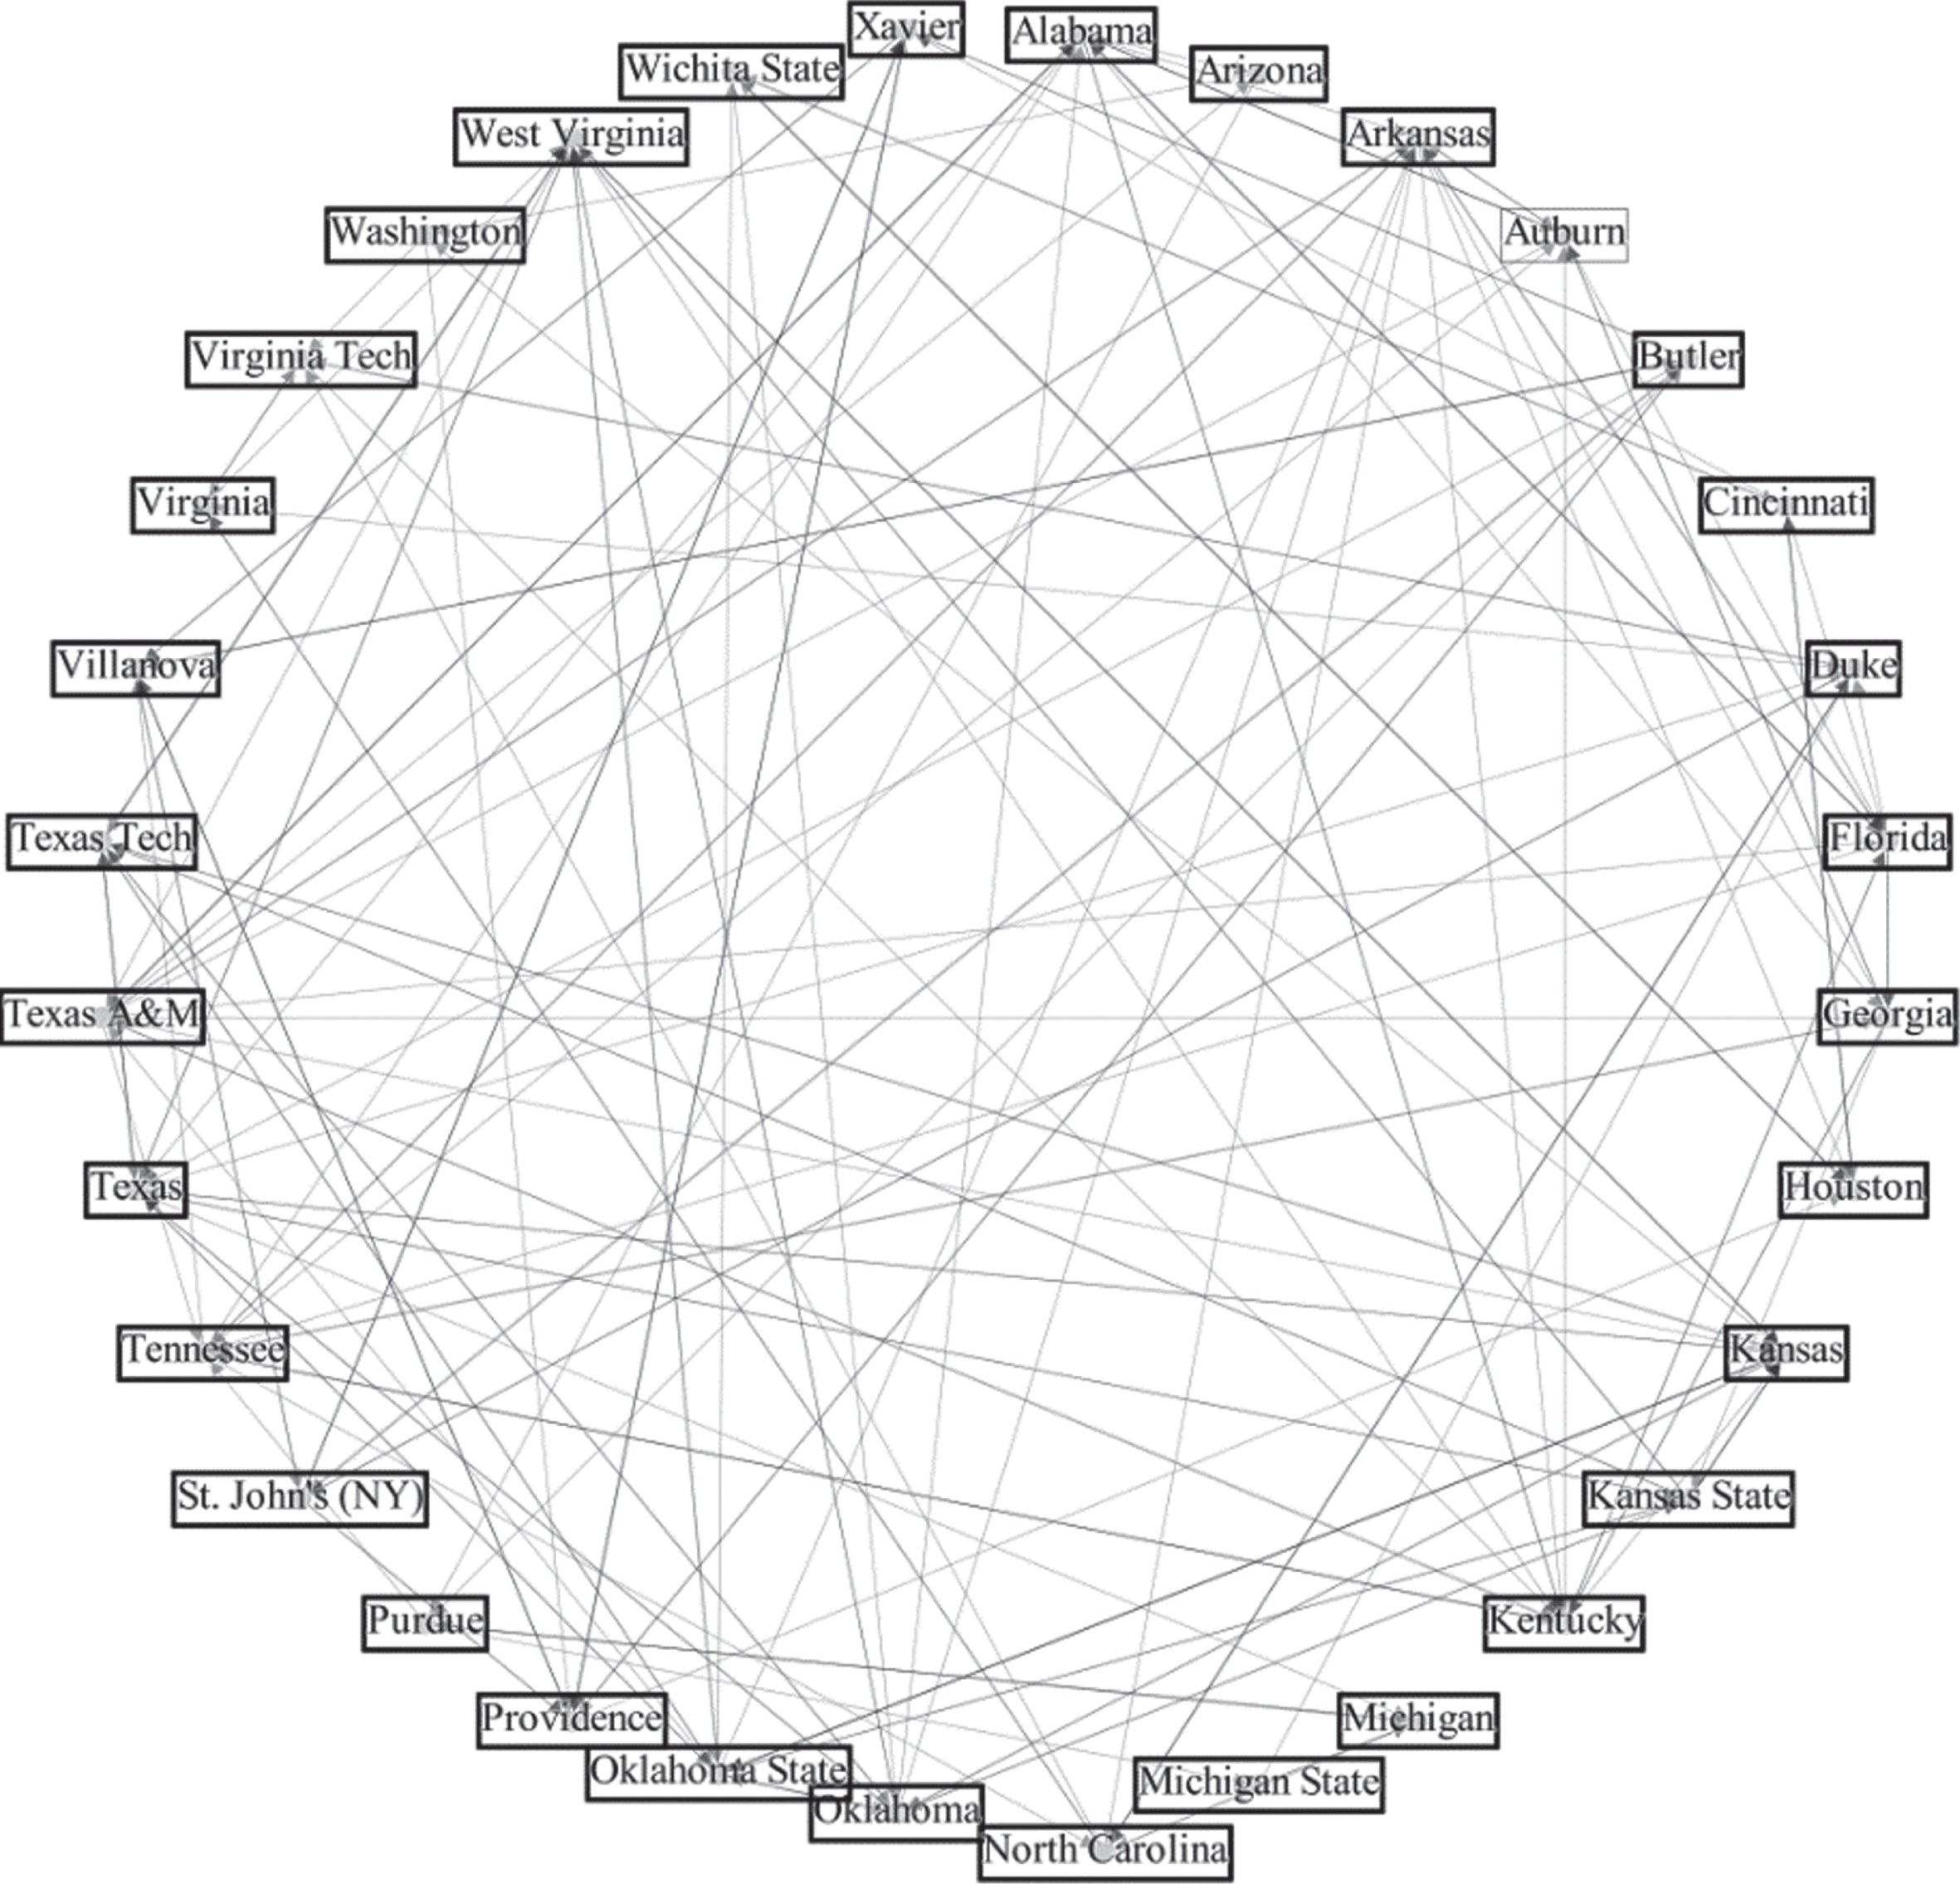
The directed graph can be adjusted to display a limited number of only the teams with high PageRank scores. In Fig. 2, only the teams with the 32 greatest PageRank scores for the 2017-2018 regular season are displayed. This view makes the nodes (teams) and edges (games) much clearer to the observer.
Fig. 2
Directed Graph of Top 32 Teams by PageRank Score.
4Results
4.1Choosing tournament participants
Choosing teams to compete in the tournament becomes an easy process once a selection system has been chosen. A PageRank analysis is completed, and the top 64 teams would progress to the tournament (Table 3). With this selection method, conference winners are not guaranteed a position in the tournament. Alternatively, the top 32 non-conference winners could be chosen based on PageRank scores while still guaranteeing a position for conference winners.
Table 3
Top 64 Teams for 2018 Utilizing PageRank Analysis
| Team | PageRank | Team | PageRank |
| Villanova | 0.012255 | Baylor | 0.006026 |
| Providence | 0.010994 | Missouri | 0.005955 |
| Xavier | 0.010419 | Texas Christian | 0.005949 |
| Kansas | 0.010376 | Louisiana State | 0.005851 |
| Florida | 0.009835 | Gonzaga | 0.00575 |
| Virginia Tech | 0.009583 | Southern California | 0.00575 |
| Tennessee | 0.009303 | Arizona State | 0.005683 |
| Duke | 0.008784 | UCLA | 0.00567 |
| North Carolina | 0.00862 | Saint Marys (CA) | 0.005505 |
| St. Johns (NY) | 0.00853 | Creighton | 0.005452 |
| Alabama | 0.00837 | Oregon | 0.005299 |
| Kentucky | 0.008318 | Temple | 0.00511 |
| West Virginia | 0.008262 | Stanford | 0.005026 |
| Oklahoma | 0.00821 | San Diego State | 0.00501 |
| Virginia | 0.008038 | Marquette | 0.004939 |
| Purdue | 0.007887 | Middle Tennessee | 0.004928 |
| Texas Tech | 0.007613 | Seton Hall | 0.004816 |
| Michigan | 0.007591 | Mississippi State | 0.004764 |
| Auburn | 0.007588 | Rhode Island | 0.004654 |
| Cincinnati | 0.007484 | North Carolina State | 0.004595 |
| Oklahoma State | 0.007364 | Clemson | 0.004578 |
| Houston | 0.007243 | Ohio State | 0.004519 |
| Arkansas | 0.007166 | Western Kentucky | 0.004474 |
| Texas | 0.006888 | North Carolina-Greensboro | 0.004281 |
| Butler | 0.006788 | South Carolina | 0.004241 |
| Georgia | 0.006731 | Loyola (IL) | 0.004228 |
| Kansas State | 0.006703 | Nevada | 0.004183 |
| Washington | 0.006637 | Louisville | 0.004104 |
| Arizona | 0.006409 | Colorado | 0.004096 |
| Wichita State | 0.006375 | Penn State | 0.004002 |
| Michigan State | 0.00632 | Miami (FL) | 0.003995 |
| Texas A&M | 0.006273 | Wofford | 0.00398 |
When choosing the entire field of 64 teams for the tournament based solely on PageRank scores, in 2018, 41 out of 64 of the teams were the same as those chosen by the selection committee. Seeing this much consistency between the committee’s decision and the PageRank scores gives reason to support this unbiased form of decision making moving forward.
Each year, the teams that do not get an invitation to the NCAA Division 1 Men’s Basketball Tournament are considered for the National Invitation Tournament (NIT). The winner of the NIT is considered a top caliber team. However, competing in this tournament means that they were not invited to the NCAA’s March Madness tournament.
With the PageRank algorithm being utilized in choosing tournament participants, the NIT winner and runner up in 2018, Penn State and Utah, and 2017, TCU and Georgia Tech, would have all received a chance in the NCAA Division 1 Men’s Basketball Tournament. The fact that these teams performed so well in the NIT tournament suggests that they could have performed well in the NCAA tournament and further validates the PageRank participant selection process.
4.2Predicting tournament outcomes
For tournament games, each team was assigned a PageRank score as calculated from their regular season games. For each round, the higher ranked team was chosen to advance to the next round until a winner was reached in the final round.
Bracket scores were calculated using a standard scoring system. First round games are valued at 1 point, second round games are valued at 2 points, third round games are valued at 4 points, fourth round games are valued at 8 points, fifth round games are valued at 16 points, and the championship game is valued at 32 points (Katz, 2015).
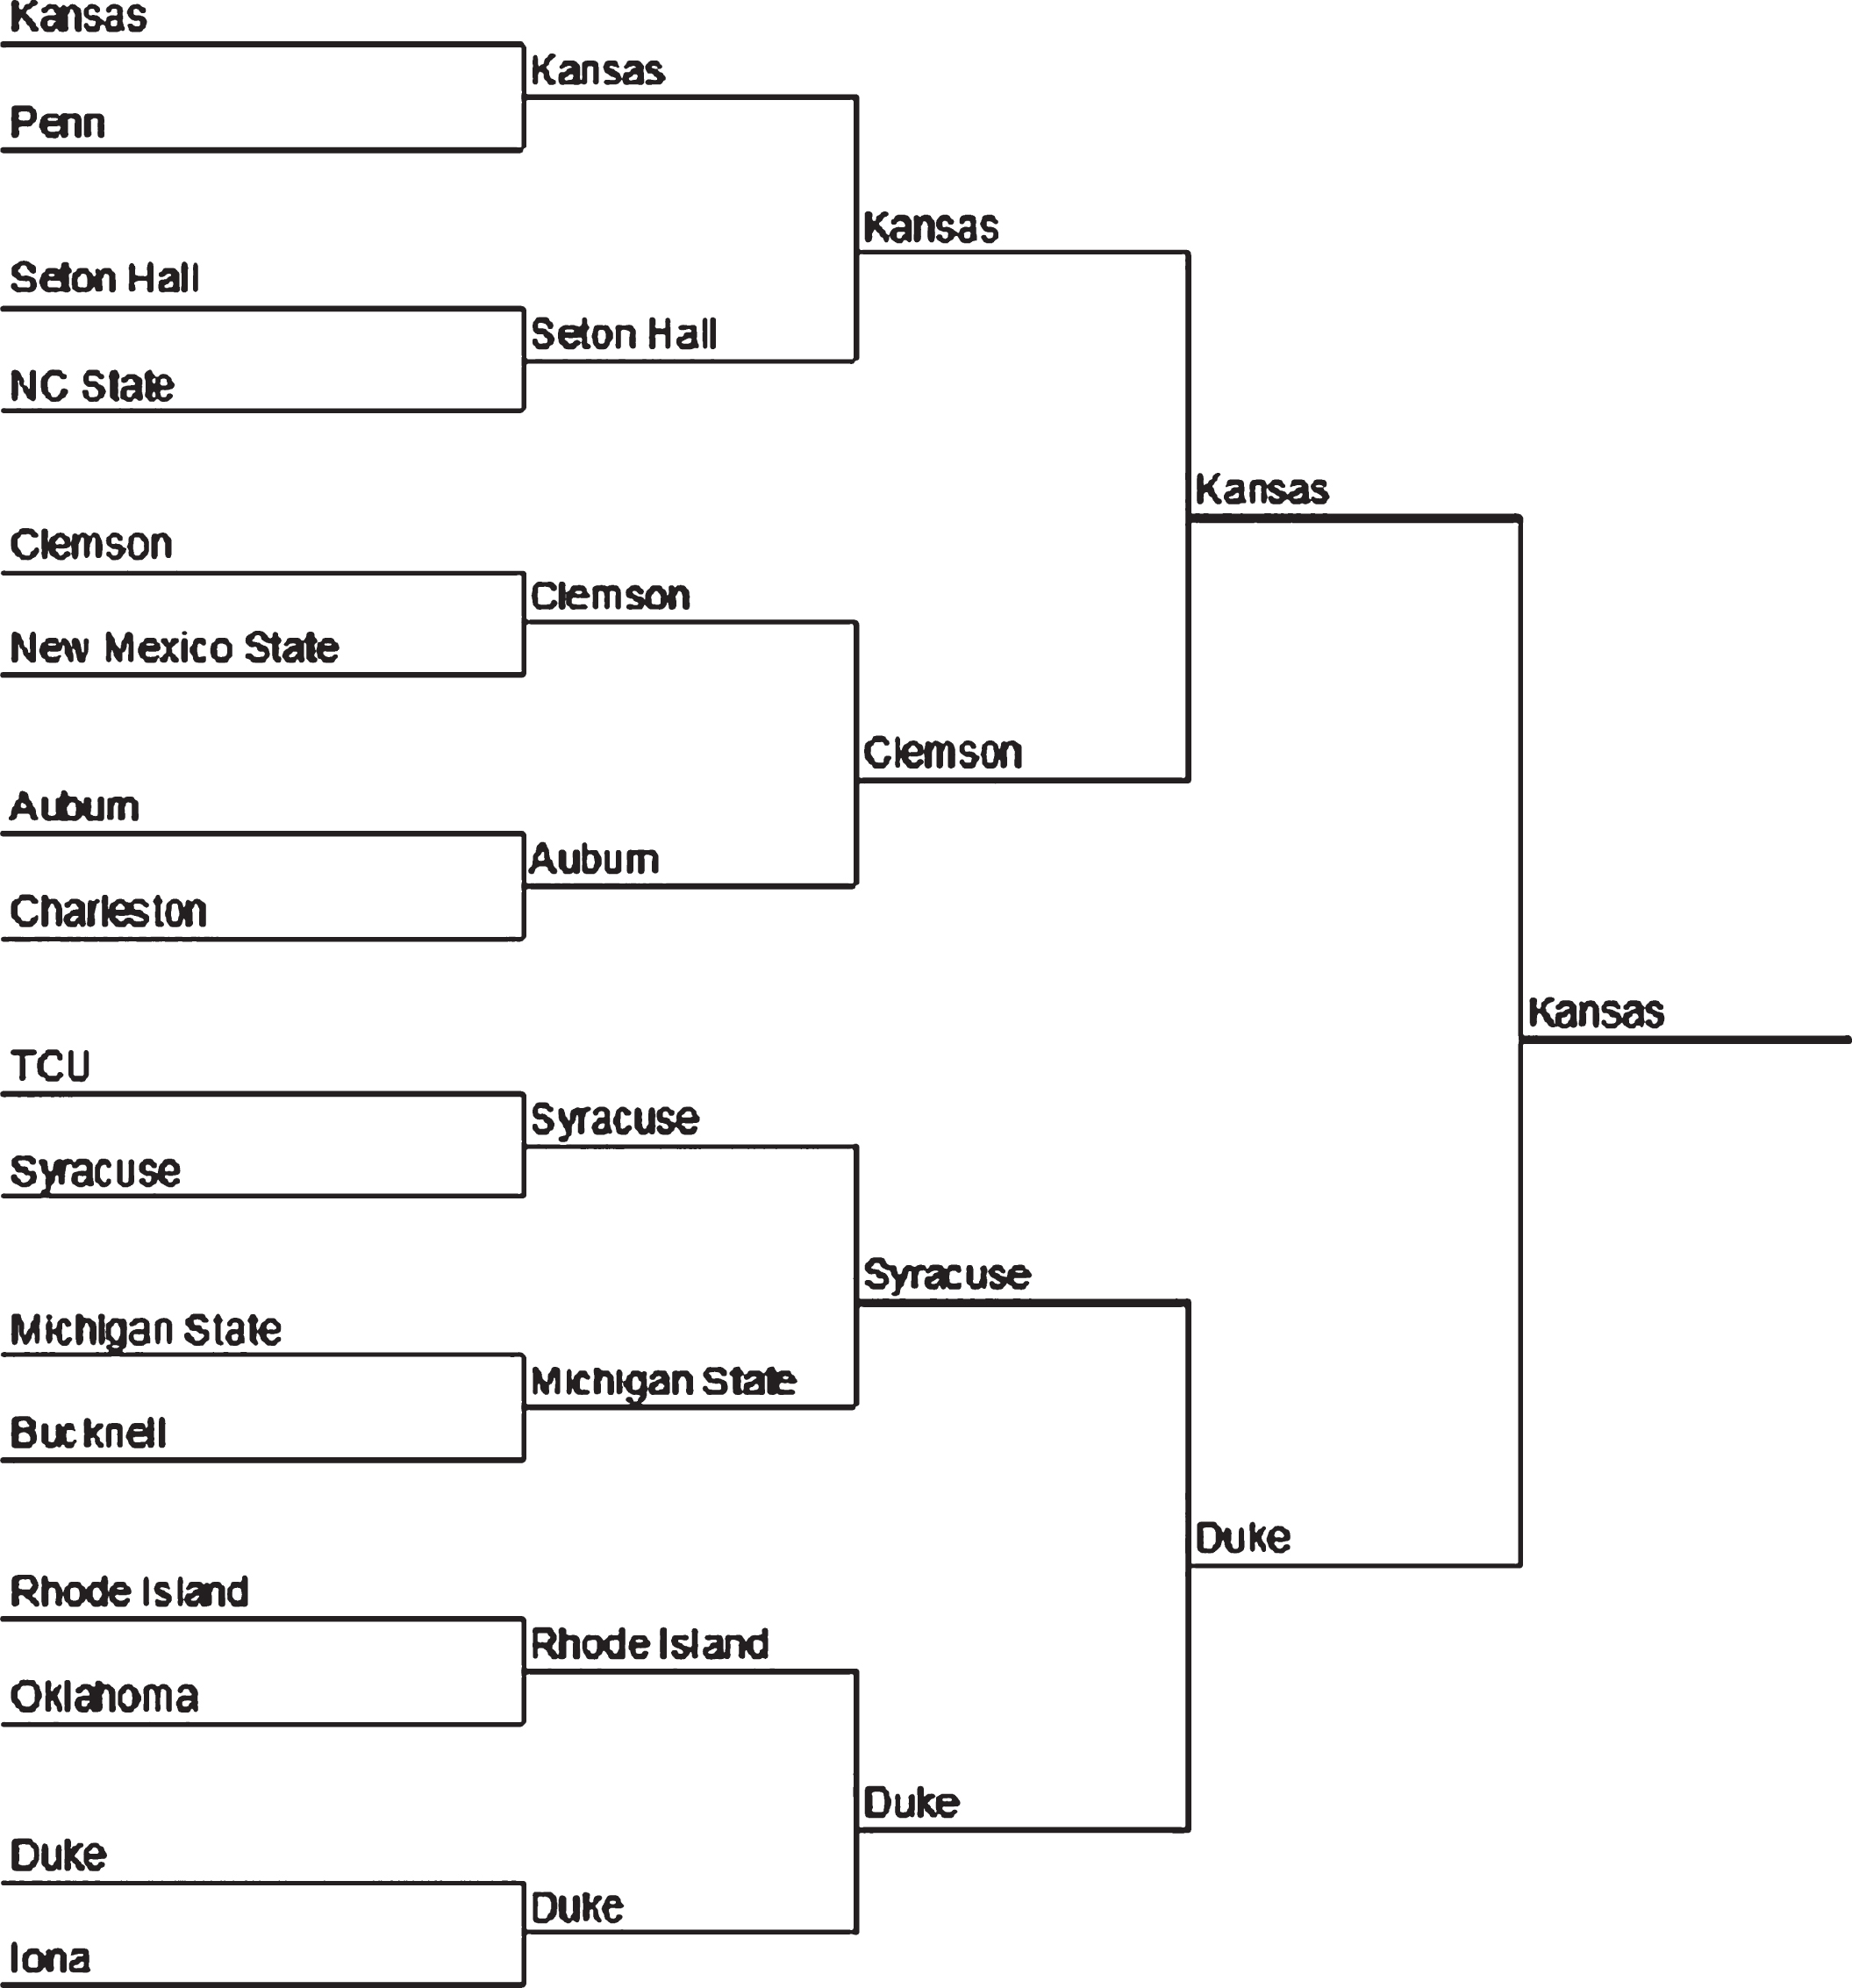
Figures 3 and 4 show the Midwest region PageRank predicted outcomes and the actual NCAA tournament outcomes. With twelve out of fifteen game outcomes predicted correctly, it is clear the PageRank algorithm can be effective in predicting winners.
Fig. 3
Midwest Region PageRank Predicted Bracket.
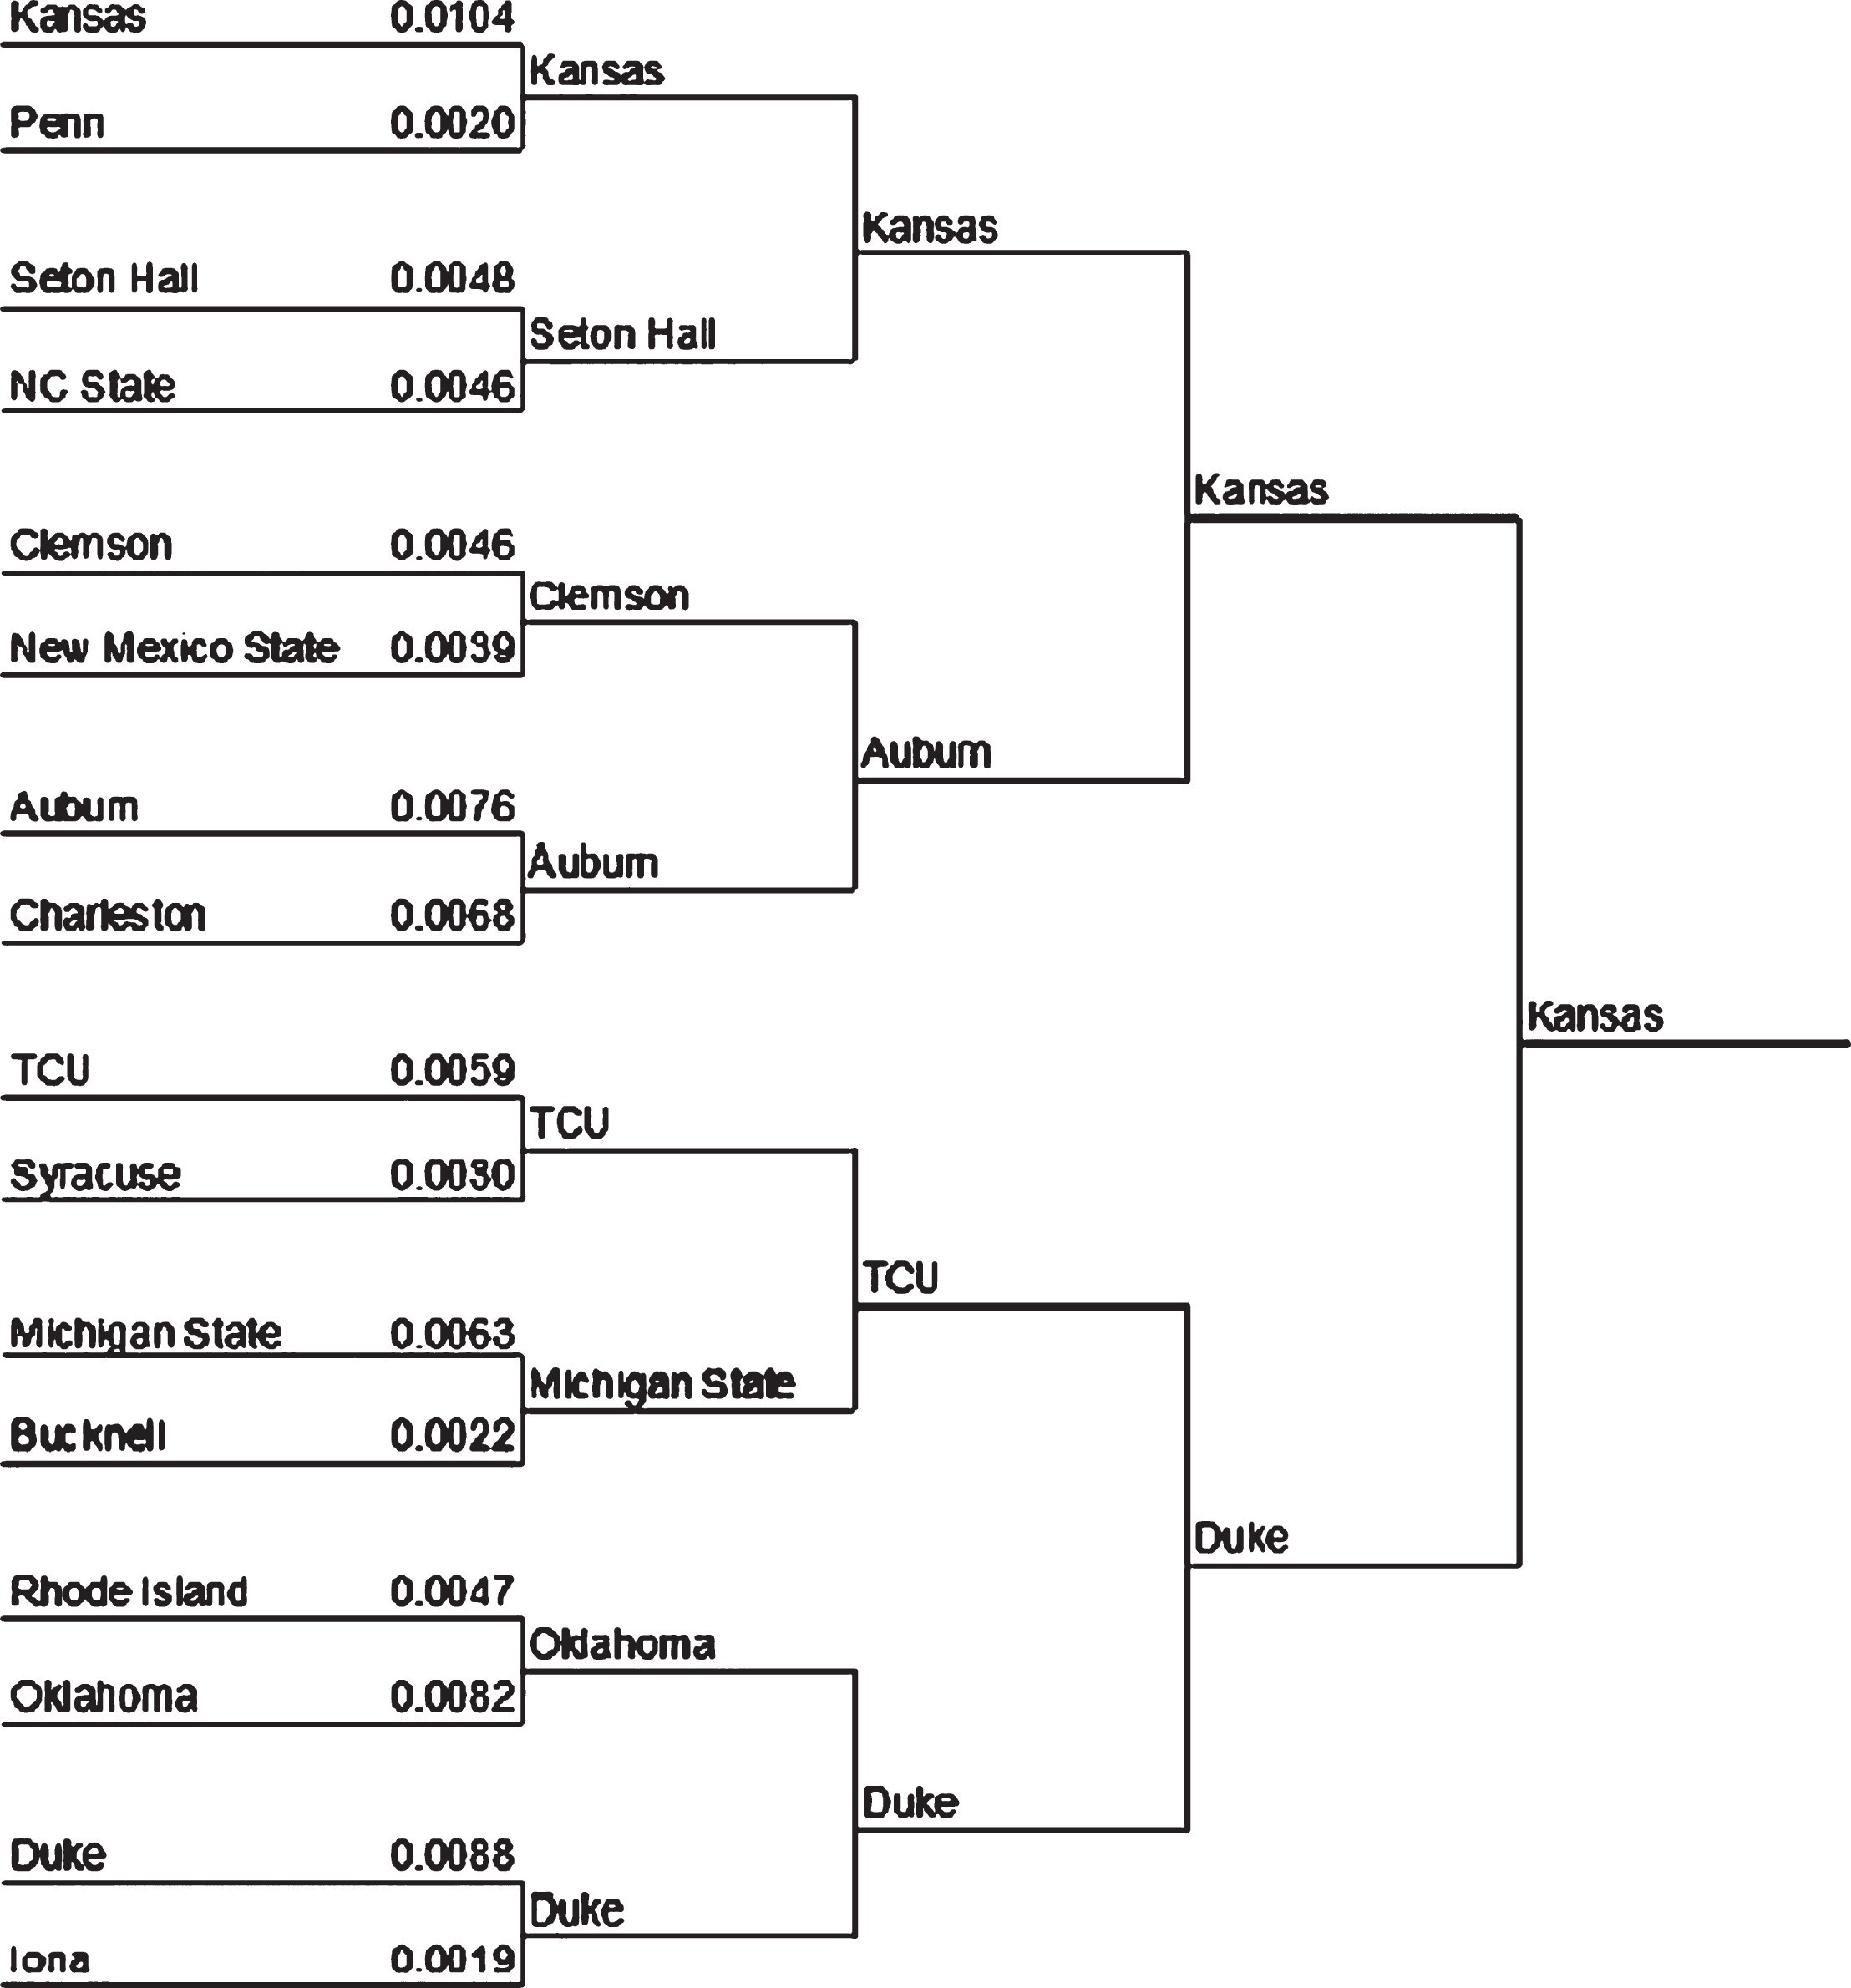
Fig. 4
Midwest Region Actual Outcome.
The bracket scoring systems are meant to reward games chosen correctly in later rounds more substantially, as they are more difficult to predict. These games are difficult to predict because if a game is incorrectly chosen in the first round, it affects all subsequent rounds. Another reason these late round games are more difficult to predict is because, as the tournament progresses, the teams competing are more likely to be playing on a more level playing field. That is, they are the best teams and more closely matched in skill level (Stekler & Klein, 2012).
5Discussion
5.1Choosing tournament participants
Utilizing a PageRank algorithm can provide an unbiased way to choose which teams will participate in the tournament. A combination of approaches can be utilized. One is to allow all conference champions as well as the 32 at-large teams with the next highest PageRank scores to participate. This may allow the committee to achieve reasonable competitive balance in each region of the bracket. The current process for selecting an at-large team includes a balloting process for the selection committee and is prone to bias. The members currently give a list of teams that should be and a list of should receive consideration for an at-large bid that have maximums of 36 and no limit respectively. Since the process ends with a vote by the committee through a series of steps, including an under consideration pool of teams, PageRank allows for a more objective process of selection.
Selecting teams within the tournament is not the only application for the PageRank algorithm. The committee must also seed the teams within their pool of 68. The seed assignment for each team ultimately contributes to the construction of the bracket with the following objective: teams on each seed line should be as equal as possible. PageRank essentially remedies the issues regarding inequality within each region of the bracket. Subjectivity from the committee can be reduced due to the unbiased and mathematically inspired set of PageRank rankings. Examples of situations when subjectivity can heavily influence the outcome of the tournament are as follows: at any time during the process, the number of teams eligible to receive votes may be changed by the chair if circumstances warrant, when teams with the highest vote totals are added to the teams carried over to comprise the next seed list ballot, and any principle can be relaxed if two or more teams from the same conference are among the last four at-large seeded teams participating in the First Four.
5.2Predicting tournament outcomes
PageRank results were measured two ways. One involved calculating a bracket score where the team with a higher PageRank would be considered the winner. The other, determining how many game outcomes were predicted correctly for the tournament, regardless of round.
The bracket scoring method is meant to reward brackets that can predict the winners of the tournament. As the tournament progresses, it becomes more difficult to predict the winners. This is due to teams being closer in caliber in later rounds (Stekler & Klein, 2012). Based on the bracket scores, presented in Table 3, there is quite a large variance year to year with the standard deviation being 31.5 points as shown in Table 4. The variance is due in large part to how accurate PageRank was in predicting games correctly in the later rounds of the tournament.
Table 4
Bracket Score and Number of Games Predicted Correctly by Year
| Year | Bracket Score (out of 192) | Bracket Percentage | Number of Games Predicted Correctly (out of 63) | Percentage of Games Predicted Correctly |
| 2014 | 56 | 29% | 33 | 52% |
| 2015 | 115 | 60% | 41 | 65% |
| 2016 | 59 | 31% | 32 | 51% |
| 2017 | 52 | 27% | 35 | 56% |
| 2018 | 111 | 58% | 35 | 56% |
| Average | 78.6 | 41% | 35.2 | 56% |
| Standard Deviation | 31.5 | 16% | 3.5 | 6% |
Due to the limitations of the bracket scoring method for demonstrating success in predicting game outcomes for all rounds, an additional metric was added to show how many game outcomes were predicted correctly each tournament year, regardless of round in the tournament. As shown in Table 4, the number of games predicted correctly each season was much closer year to year with a standard deviation of less than 4 games, with over half the games predicted correctly each year from 2014–2018.
6Conclusion
With the PageRank algorithm, it is possible to provide an unbiased and mathematically inspired set of rankings. One possible use of the PageRank algorithm is in the seeding process. This method of scoring teams may not include minor details that are normally considered by the selection committee. However, with the elimination of bias and addition of a more methodical approach, a great deal of consistency is achieved. Additionally, it is possible to take the pool of tournament candidates provided by the committee and assign seeds from the PageRank scores.
The PageRank algorithm was also valuable in predicting how well any given team would perform in the tournament. Many methods are currently utilized to help with these predictions, but the PageRank is unique in that it gives the user an opportunity to adjust rankings based on any number of factors that can be incorporated into the weights of the edges. Further research into optimizing weights for the PageRank analysis could improve the accuracy of predictions. One possible future exploration technique is a statistical sensitivity analysis of the selected weights. Adding information on individual players to edge weights, for example, could provide a new opportunity to rank teams utilizing the PageRank algorithm.
References
1 | Berry, M. W. , Chartier, T. P. , Hutson, K. R. & Langville, A. N. , (2013) . Identifying influential edges in a directed network: big events, upsets and non-transitivity, Journal of Complex Networks 2: (2), 87–109. |
2 | Chartier, T. , (2014) . Big data: how data analytics is transforming the world.. Chantilly, VA: The Great Courses. |
3 | Chartier, T. , Kreutzer, E. , Langville, A. & Pedings, K. , (2010) . Bracketology: How can math help?, Mathematics and Sports 43: (67), 55–70. |
4 | Duch, J. , Waitzman, J. S. & Amaral, L. A. N. , (2010) . Quantifying the performance of individual players in a team activity, PloS one 5: (6), e10937. |
5 | Dutta, S. , Jacobson, S. H. & Sauppe, J. J. , (2017) . Identifying NCAA tournament upsets using Balance Optimization Subset Selection, Journal of Quantitative Analysis in Sports 13: (2), pp. 79–93. |
6 | Gleeson, S. , (2018) . NCAA to use new metric and drop RPI for tournament. USA Today, 22 August. |
7 | Gray, K. L. & Schwertman, N. C. , (2012) . Comparing Team Selection and Seeding for the 2011 NCAA Men’s Basketball Tournament, Journal of Quantitative Analysis in Sports 8: (1). |
8 | Katz, J. , (2015) . Here’s How Our N.C.A.A. Bracket Works. The New York Times, 15 March. |
9 | Lunardi, J. , (2018) . It’s about time the NCAA tournament modernized its. [Online] Available at: https://www.espn.com/menscollege-basketball/story//id/24446023/ncaa-tournamentselection-committee-ditches-rpi-march-madness-evaluation [Accessed 22 August 2018]. |
10 | NCAA.COM, 2019. How the field of 68 teams is picked for March Madness. Online Available at: https://www.ncaa.com/news/basketball-men/article/2018-10-19/how-field-68-teamspicked-march-madness [Accessed 8 FEBRUARY 2019]. |
11 | Onody, R. N. & de Castro, P. A. , (2004) . Complex network study of Brazilian soccer players, Physical Review E 70: (3), 037103. |
12 | Page, L. , Brin, S. , Motwani, R. & Winograd, T. , (1999) . The PageRank citation ranking: Bringing order to the web., s.l.: Stanford InfoLab. |
13 | Radicchi, F. , (2011) . Who is the best player ever? A complex network analysis of the history of professional tennis, PloS one 6: (2), e17249. |
14 | Stekler, H. O. & Klein, A. , (2012) . Predicting the outcomes of NCAA basketball championship games, Journal of Quantitative Analysis in Sports 8: (1), 1–10. |
15 | Tennant, A. G. , Ahmad, N. & Derrible, S. , (2017) . Complexity analysis in the sport of boxing, Journal of Complex Networks 5: (6), 953–963. |

