Calculate Readability Scores For Content
There are lots of different readability formulas out there, which seek to provide an index on how readable any given excerpt of text is. Typically, these formulas output a grade-level score, which indicates, roughly, the level of education required to read the text excerpt with ease.
Any “quality index” that seeks to reduce the complexity of something as multi-faceted as reading should be subject to scrutiny. This is true for Bounce Rate, this is true for Time On Page, and this is true for a readability score.
However, I do think it’s interesting metadata to collect for your content. Who knows, perhaps you’ll find correlations between the difficulty of reading any piece of text and the amount of engagement that the content engenders.
In this article, I’ll show you how to create a Custom JavaScript variable in Google Tag Manager that creates a utility function. This function can be called with any piece of text (e.g. the text content of your main content DOM element), and it will return an object with a variety of scores based on different readability formulas, as well as a median grade level calculated from these scores.
You can use this information to annotate your Page View hits with Custom Dimensions (with a caveat regarding its triggers) when sending the data to Google Analytics.
You can also send the data to a Google Analytics: App + Web property ready for that juicy BigQuery data export.
I’ll show you how to do both in this guide.
XThanks to Munaz Anjum for inspiring me to write this article!
The Simmer Newsletter
Subscribe to the Simmer newsletter to get the latest news and content from Simo Ahava into your email inbox!
The Custom JavaScript variable
In this chapter, we’ll go over the Custom JavaScript variable you’ll need to create to make this work.
“Why a Custom JavaScript variable? Why not a custom template?” I hear you ask. I know! This would be perfect for a custom template. Alas, templates do not support the full extent of regular expressions yet, and they are absolutely vital for the algorithms required by the formulae in the variable.
What you’ll get
The Custom JavaScript variable returns a function, which you can then invoke with a string in another Custom JavaScript variable or a Custom HTML tag.
When you call the function with a string, e.g.:
var readabilityFunction = {{readabilityFunction}};

var text = 'At the heart of this paper lies the elusive concept of \
variation: how speakers can simultaneously share a common knowledge \
of a unified language system and develop it in idiosyncratic and unique \
ways. Studies of variation do not come without their fair share of \
controversy. Since they necessarily incorporate the attention to detail \
that a descriptivist approach demands together with a level of abstraction \
that is likewise required by all studies of linguistic phenomena, the \
results are often as debatable as they are revelatory. It is thus the \
researcher’s job to describe the phenomenon as lucidly as possible, \
without drawing conclusions that extend beyond the scope of the data at hand.'

console.log(readabilityFunction(text));

// Outputs
// {
//   automatedReadabilityIndex: 15.48,
//   colemanLiauIndex: 13.12,
//   fleschKincaidGrade: 16.41,
//   fleschReadingEase: 28.17,
//   linsearWriteFormula: 18.25,
//   medianGrade: 17,
//   readingTime: 27.34,
//   rix: 9.5,
//   smogIndex: 17.41
// }
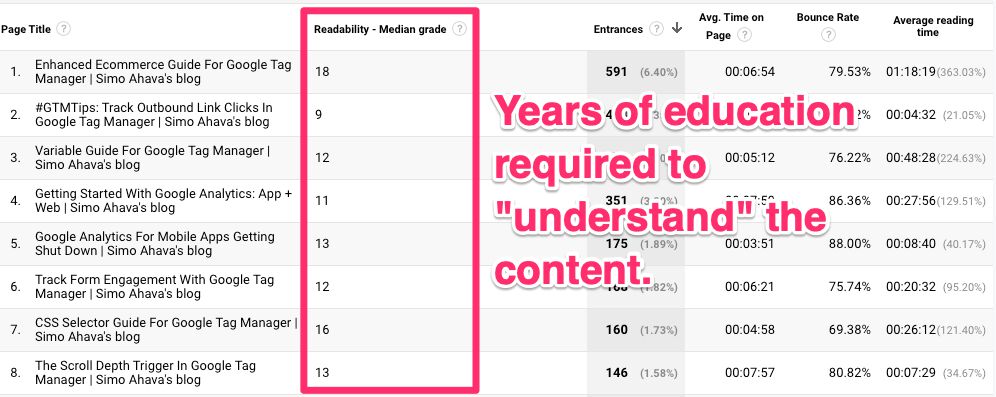
This particular excerpt (from my master’s thesis) has a median readability grade of 17 which means, loosely translated, that it takes around 17 years of education to read text like this with ease. The reading time is around 27 seconds.
The object for the article you are reading looks like this (ouch!):
{
  automatedReadabilityIndex: 15.48,
  colemanLiauIndex: 3.77,
  fleschKincaidGrade: 16.96,
  fleschReadingEase: 39.67,
  linsearWriteFormula: 13.2,
  medianGrade: 15,
  readingTime: 1524.22,
  rix: 7.11,
  smogIndex: 15.85
}
I’ll share what these different numbers and names mean in a bit.
Variable contents
The code is a JavaScript rewrite of the textstat.py Python library. I did not include any readability grades that rely on an English wordlist (so any formulae that require a definition of what is a “common” or “easy” word in English is ignored).
Create a new Custom JavaScript variable, give it a name (e.g. readabilityFunction), and copy-paste the following JavaScript in the body.
function() {
  return function(text) {

    /* To speed the script up, you can set a sampling rate in words. For example, if you set
     * sampleLimit to 1000, only the first 1000 words will be parsed from the input text.
     * Set to 0 to never sample.
     */
    var sampleLimit = 1000;

    // Manual rewrite of the textstat Python library (https://github.com/shivam5992/textstat/)

    /*
     * Regular expression to identify a sentence. No, it's not perfect.
     * Fails e.g. with abbreviations and similar constructs mid-sentence.
     */
    var sentenceRegex = new RegExp('[.?!]\\s[^a-z]', 'g');

    /*
     * Regular expression to identify a syllable. No, it's not perfect either.
     * It's based on English, so other languages with different vowel / consonant distributions
     * and syllable definitions need a rewrite.
     * Inspired by https://bit.ly/2VK9dz1
     */
    var syllableRegex = new RegExp('[aiouy]+e*|e(?!d$|ly).|[td]ed|le$', 'g');

    // Baseline for FRE - English only
    var freBase = {
      base: 206.835,
      sentenceLength: 1.015,
      syllablesPerWord: 84.6,
      syllableThreshold: 3
    };

    var cache = {};

    var punctuation = ['!','"','#','$','%','&','\'','(',')','*','+',',','-','.','/',':',';','<','=','>','?','@','[',']','^','_','`','{','|','}','~'];

    var legacyRound = function(number, precision) {
      var k = Math.pow(10, (precision || 0));
      return Math.floor((number * k) + 0.5 * Math.sign(number)) / k;
    };

    var charCount = function(text) {
      if (cache.charCount) return cache.charCount;
      if (sampleLimit > 0) text = text.split(' ').slice(0, sampleLimit).join(' ');
      text = text.replace(/\s/g, '');
      return cache.charCount = text.length;
    };

    var removePunctuation = function(text) {
      return text.split('').filter(function(c) {
        return punctuation.indexOf(c) === -1;
      }).join('');
    };

    var letterCount = function(text) {
      if (sampleLimit > 0) text = text.split(' ').slice(0, sampleLimit).join(' ');
      text = text.replace(/\s/g, '');
      return removePunctuation(text).length;
    };

    var lexiconCount = function(text, useCache, ignoreSample) {
      if (useCache && cache.lexiconCount) return cache.lexiconCount;
      if (ignoreSample !== true && sampleLimit > 0) text = text.split(' ').slice(0, sampleLimit).join(' ');
      text = removePunctuation(text);
      var lexicon = text.split(' ').length;
      return useCache ? cache.lexiconCount = lexicon : lexicon;
    };

    var getWords = function(text, useCache) {
      if (useCache && cache.getWords) return cache.getWords;
      if (sampleLimit > 0) text = text.split(' ').slice(0, sampleLimit).join(' ');
      text = text.toLowerCase();
      text = removePunctuation(text);
      var words = text.split(' ');
      return useCache ? cache.getWords = words : words;
    }

    var syllableCount = function(text, useCache) {
      if (useCache && cache.syllableCount) return cache.syllableCount;
      var count = 0;
      var syllables = getWords(text, useCache).reduce(function(a, c) {
        return a + (c.match(syllableRegex) || [1]).length;
      }, 0);
      return useCache ? cache.syllableCount = syllables : syllables;
    };

    var polySyllableCount = function(text, useCache) {
      var count = 0;
      getWords(text, useCache).forEach(function(word) {
        var syllables = syllableCount(word);
        if (syllables >= 3) {
          count += 1;
        }
      });
      return count;
    };

    var sentenceCount = function(text, useCache) {
      if (useCache && cache.sentenceCount) return cache.sentenceCount;
      if (sampleLimit > 0) text = text.split(' ').slice(0, sampleLimit).join(' ');
      var ignoreCount = 0;
      var sentences = text.split(sentenceRegex);
      sentences.forEach(function(s) {
        if (lexiconCount(s, true, false) <= 2) { ignoreCount += 1; }
      });
      var count = Math.max(1, sentences.length - ignoreCount);
      return useCache ? cache.sentenceCount = count : count;
    };

    var avgSentenceLength = function(text) {
      var avg = lexiconCount(text, true) / sentenceCount(text, true);
      return legacyRound(avg, 2);
    };

    var avgSyllablesPerWord = function(text) {
      var avg = syllableCount(text, true) / lexiconCount(text, true);
      return legacyRound(avg, 2);
    };

    var avgCharactersPerWord = function(text) {
      var avg = charCount(text) / lexiconCount(text, true);
      return legacyRound(avg, 2);
    };

    var avgLettersPerWord = function(text) {
      var avg = letterCount(text, true) / lexiconCount(text, true);
      return legacyRound(avg, 2);
    };

    var avgSentencesPerWord = function(text) {
      var avg = sentenceCount(text, true) / lexiconCount(text, true);
      return legacyRound(avg, 2);
    };

    var fleschReadingEase = function(text) {
      var sentenceLength = avgSentenceLength(text);
      var syllablesPerWord = avgSyllablesPerWord(text);
      return legacyRound(
        freBase.base -
        freBase.sentenceLength * sentenceLength -
        freBase.syllablesPerWord * syllablesPerWord,
        2
      );
    };

    var fleschKincaidGrade = function(text) {
      var sentenceLength = avgSentenceLength(text);
      var syllablesPerWord = avgSyllablesPerWord(text);
      return legacyRound(
        0.39 * sentenceLength +
        11.8 * syllablesPerWord -
        15.59,
        2
      );
    };

    var smogIndex = function(text) {
      var sentences = sentenceCount(text, true);
      if (sentences >= 3) {
        var polySyllables = polySyllableCount(text, true);
        var smog = 1.043 * (Math.pow(polySyllables * (30 / sentences), 0.5)) + 3.1291;
        return legacyRound(smog, 2);
      }
      return 0.0;
    };

    var colemanLiauIndex = function(text) {
      var letters = legacyRound(avgLettersPerWord(text) * 100, 2);
      var sentences = legacyRound(avgSentencesPerWord(text) * 100, 2);
      var coleman = 0.0588 * letters - 0.296 * sentences - 15.8;
      return legacyRound(coleman, 2);
    };

    var automatedReadabilityIndex = function(text) {
      var chars = charCount(text);
      var words = lexiconCount(text, true);
      var sentences = sentenceCount(text, true);
      var a = chars / words;
      var b = words / sentences;
      var readability = (
        4.71 * legacyRound(a, 2) +
        0.5 * legacyRound(b, 2) -
        21.43
      );
      return legacyRound(readability, 2);
    };

    var linsearWriteFormula = function(text) {
      var easyWord = 0;
      var difficultWord = 0;
      var roughTextFirst100 = text.split(' ').slice(0,100).join(' ');
      var plainTextListFirst100 = getWords(text, true).slice(0,100);
      plainTextListFirst100.forEach(function(word) {
        if (syllableCount(word) < 3) {
          easyWord += 1;
        } else {
          difficultWord += 1;
        }
      });
      var number = (easyWord + difficultWord * 3) / sentenceCount(roughTextFirst100);
      if (number <= 20) {
        number -= 2;
      }
      return legacyRound(number / 2, 2);
    };

    var rix = function(text) {
      var words = getWords(text, true);
      var longCount = words.filter(function(word) {
        return word.length > 6;
      }).length;
      var sentencesCount = sentenceCount(text, true);
      return legacyRound(longCount / sentencesCount, 2);
    };

    var readingTime = function(text) {
      var wordsPerSecond = 4.17;
      // To get full reading time, ignore cache and sample
      return legacyRound(lexiconCount(text, false, true) / wordsPerSecond, 2);
    };

    // Build textStandard
    var grade = [];
    var obj = {};
    (function() {

      // FRE
      var fre = obj.fleschReadingEase = fleschReadingEase(text);
      if (fre < 100 && fre >= 90) {
        grade.push(5);
      } else if (fre < 90 && fre >= 80) {
        grade.push(6);
      } else if (fre < 80 && fre >= 70) {
        grade.push(7);
      } else if (fre < 70 && fre >= 60) {
        grade.push(8);
        grade.push(9);
      } else if (fre < 60 && fre >= 50) {
        grade.push(10);
      } else if (fre < 50 && fre >= 40) {
        grade.push(11);
      } else if (fre < 40 && fre >= 30) {
        grade.push(12);
      } else {
        grade.push(13);
      }

      // FK
      var fk = obj.fleschKincaidGrade = fleschKincaidGrade(text);
      grade.push(Math.floor(fk));
      grade.push(Math.ceil(fk));

      // SMOG
      var smog = obj.smogIndex = smogIndex(text);
      grade.push(Math.floor(smog));
      grade.push(Math.ceil(smog));

      // CL
      var cl = obj.colemanLiauIndex = colemanLiauIndex(text);
      grade.push(Math.floor(cl));
      grade.push(Math.ceil(cl));

      // ARI
      var ari = obj.automatedReadabilityIndex = automatedReadabilityIndex(text);
      grade.push(Math.floor(ari));
      grade.push(Math.ceil(ari));

      // LWF
      var lwf = obj.linsearWriteFormula = linsearWriteFormula(text);
      grade.push(Math.floor(lwf));
      grade.push(Math.ceil(lwf));

      // RIX
      var rixScore = obj.rix = rix(text);
      if (rixScore >= 7.2) {
        grade.push(13);
      } else if (rixScore < 7.2 && rixScore >= 6.2) {
        grade.push(12);
      } else if (rixScore < 6.2 && rixScore >= 5.3) {
        grade.push(11);
      } else if (rixScore < 5.3 && rixScore >= 4.5) {
        grade.push(10);
      } else if (rixScore < 4.5 && rixScore >= 3.7) {
        grade.push(9);
      } else if (rixScore < 3.7 && rixScore >= 3.0) {
        grade.push(8);
      } else if (rixScore < 3.0 && rixScore >= 2.4) {
        grade.push(7);
      } else if (rixScore < 2.4 && rixScore >= 1.8) {
        grade.push(6);
      } else if (rixScore < 1.8 && rixScore >= 1.3) {
        grade.push(5);
      } else if (rixScore < 1.3 && rixScore >= 0.8) {
        grade.push(4);
      } else if (rixScore < 0.8 && rixScore >= 0.5) {
        grade.push(3);
      } else if (rixScore < 0.5 && rixScore >= 0.2) {
        grade.push(2);
      } else {
        grade.push(1);
      }

      // Find median grade
      grade = grade.sort(function(a, b) { return a - b; });
      var midPoint = Math.floor(grade.length / 2);
      var medianGrade = legacyRound(
        grade.length % 2 ?
        grade[midPoint] :
        (grade[midPoint-1] + grade[midPoint]) / 2.0
      );
      obj.medianGrade = medianGrade;

    })();

    obj.readingTime = readingTime(text);

    return obj;
  };
}
It’s a mouthful, so let’s go over each formula together with the code that relates to it.
Setup
The first couple of steps in the variable establish much of what follows.
var sampleLimit = 1000;
Running regular expressions can be slow. If you have an article of 5000 words, for example, counting the syllables of every single word can take a looooooong time, and can be hazardous if executed at page load.
I’ve introduced the sampleLimit variable, which basically establishes a maximum sample size to run the readability calculations against. If sampleLimit is set to the default of 1000, the script will sample the first 1000 words of the input. The end result should be in the ball park of a score calculated against the full text, but this of course depends on what type of text is in question.
If you want to avoid sampling, set sampleLimit to 0.
var sentenceRegex = new RegExp('[.?!]\\s[^a-z]', 'g');
var syllableRegex = new RegExp('[aiouy]+e*|e(?!d$|ly).|[td]ed|le$', 'g');
The first regular expression is used to split a chunk of text in sentences. No, it’s not perfect.
But that’s OK - we’re looking for abstractions and the more text you have the more the score will converge towards a norm.
The second regular expression counts the number of syllables in a text. No, it’s not perfect either. It’s based on English, and perhaps other Germanic languages, but syllabification can change from language to language so if you want to analyze content in other languages, you need to modify the regex.
The rest of the setup steps are listed here.
| Function / variable signature | Description |
|---|---|
freBase |
The baseline numbers for calculating the Flesch Reading-Ease score in the English language. |
cache |
Utility that caches most of the calculations, so that the regexes are run just once for the cached items. |
punctuation |
List of punctuation symbols. |
legacyRound() |
Function to round the input number to the given precision. |
charCount() |
Count the characters in the input. |
removePunctuation() |
Remove all punctuation from the input. |
letterCount() |
Count the letters in the input. |
lexiconCount() |
Count the words in the input. |
getWords() |
Returns the words in the input. |
syllableCount() |
Count the syllables in the input. |
polySyllableCount() |
Count the number of words with three or more syllables in the input. |
sentenceCount() |
Count the number of sentences in the input. |
avgSentenceLength() |
Count the average length of sentences (number of words) in the input. |
avgSyllablesPerWord() |
Count the average number of syllables per word in the input. |
avgCharactersPerWord() |
Count the average number of characters per word in the input. |
avgLettersPerWord() |
Count the average number of letters per word in the input. |
avgSentencesPerWord() |
Count the average number of sentences per word in the input. |
These utilities are used to calculate the readability formulae.
1. Flesch Reading-Ease
The Flesch Reading-Ease test is probably one of the better known readability tests. It’s used by e.g. Yoast and Grammarly to calculate their readability scores.
For the English language, the algorithm is:
206.835 - 1.015 x (words / sentences) - 84.6 x (syllables / words)
This outputs a score between 1 and 100, where the higher the score, the easier to read the text is.
A score between 70 and 80 would be considered easy to read for a 7th grader in the US.
In the Custom JavaScript variable, Flesch Reading-Ease is generated like this:
var fleschReadingEase = function(text) {
  var sentenceLength = avgSentenceLength(text);
  var syllablesPerWord = avgSyllablesPerWord(text);
  return legacyRound(
    freBase.base -
    freBase.sentenceLength * sentenceLength -
    freBase.syllablesPerWord * syllablesPerWord,
    2
  );
};
2. Flesch-Kincaid Grade
The Flesch-Kincaid Grade Level score outputs a number that corresponds to the U.S. grade level generally required to understand the text. If the score returns a number higher than 10, it can also be used to calculate the years of education required to understand the text.
The algorithm is:
0.39 x (words / sentences) + 11.8 x (syllables / words) - 15.59
In the Custom JavaScript variable, this translates to:
var fleschKincaidGrade = function(text) {
  var sentenceLength = avgSentenceLength(text);
  var syllablesPerWord = avgSyllablesPerWord(text);
  return legacyRound(
    0.39 * sentenceLength +
    11.8 * syllablesPerWord -
    15.59,
    2
  );
};
3. SMOG grade
The SMOG grade, short for Simple Measure of Gobbledygook, estimates the years of education required to understand any given text. It is particularly preferred (over Flesch-Kincaid) in the healthcare industry for content design.
The algorithm is:
1.0430 x squareroot(polysyllables x (30 / sentences)) + 3.1291
In the variable, this would be:
var smogIndex = function(text) {
  var sentences = sentenceCount(text, true);
  if (sentences >= 3) {
    var polySyllables = polySyllableCount(text, true);
    var smog = 1.043 * Math.pow(polySyllables * (30 / sentences), 0.5) + 3.1291;
    return legacyRound(smog, 2);
  }
  return 0.0;
};
Note that the formula ignores content that has three or fewer sentences, as the grade would lose any semblance of accuracy in those cases.
Just a note on the JavaScript, using Math.pow(x, y) calculates x to the power of y. When you set y to 0.5, you get the square root of x.
4. Coleman-Liau index
The Coleman-Liau index again outputs an approximation of the U.S. grade level required to understand the text. It’s better suited for computer programs as it doesn’t care about the complexity of syllables but rather relies on character counts.
The algorithm is:
0.0588 x average_letters_per_100_words - 0.296 x average_sentences_per_100_words - 15.8
In JavaScript, this would be:
var colemanLiauIndex = function(text) {
  var letters = legacyRound(avgLettersPerWord(text) * 100, 2);
  var sentences = legacyRound(avgSentencesPerWord(text) * 100, 2);
  var coleman = 0.0588 * letters - 0.296 * sentences - 15.8;
  return legacyRound(coleman, 2);
};
Now, you can see how abstract this is, again. It calculates the average number of letters in a word from the entire text, and multiplies this by 100 to get the average letters in a 100 word sample. Same thing for sentences. Thus, the number gets more accurate the larger the data sample.
5. Automated Readability Index
The Automated Readability Index returns yet again a U.S. grade level score thought to correspond with how readable the text is.
The formula for ARI is:
4.71 x (characters / words) + 0.5 x (words / sentences) - 21.43
Similar to the Coleman-Liau index, ARI relies on characters rather than syllables, so is thus friendlier to machine calculation but can lead to a more diverse spread of scores compared to syllable-based systems.
In JavaScript, ARI is calculated like this:
var automatedReadabilityIndex = function(text) {
  var chars = charCount(text);
  var words = lexiconCount(text, true);
  var sentences = sentenceCount(text, true);
  var a = chars / words;
  var b = words / sentences;
  var readability = (
    4.71 * legacyRound(a, 2) +
    0.5 * legacyRound(b, 2) -
    21.43
  );
  return legacyRound(readability, 2);
};
6. Linsear Write
The Linsear Write metric uses a sample of 100 words to calculate the U.S. grade level required to understand the text. It also divides the text into “easy words” (two syllables or less) and “difficult words” (three syllables or more).
The algorithm is:
r = (count_of_easy_words + 3 x count_of_difficult_words) / sentences
if r > 20, result = r / 2
if r <= 20, result = r / 2 - 1
In JavaScript, this would be:
var linsearWriteFormula = function(text) {
  var easyWord = 0;
  var difficultWord = 0;
  var roughTextFirst100 = text.split(' ').slice(0,100).join(' ');
  var plainTextListFirst100 = getWords(text, true).slice(0,100);
  plainTextListFirst100.forEach(function(word) {
    if (syllableCount(word) < 3) {
      easyWord += 1;
    } else {
      difficultWord += 1;
    }
  });
  var number = (easyWord + difficultWord * 3) / sentenceCount(roughTextFirst100);
  if (number <= 20) {
    number -= 2;
  }
  return legacyRound(number / 2, 2);
};
Yeah, it’s a bit messy. The problem is that the “easy words” and “difficult words” need to be calculated from the lexicon without any punctuation, and the sentence count needs to be calculated from a sample with punctuation intact.
In any case, the end result is the Linsear Write score for the text input with decent accuracy.
7. Rix
Rix is quite plainly the number of long words divided by the number of sentences in the text. A long word is a word with more than six characters.
The resulting score can be converted to U.S. grade-level.
In JavaScript, you can calculate Rix like this:
var rix = function(text) {
  var words = getWords(text, true);
  var longCount = words.filter(function(word) {
    return word.length > 6;
  }).length;
  var sentencesCount = sentenceCount(text, true);
  return legacyRound(longCount / sentencesCount, 2);
};
8. Reading time
To calculate reading time of the text, we use the benchmark of 250 words per minute read by the average adult. This translates to 4.17 words per second.
The algorithm is simple:
    var readingTime = function(text) {
      var wordsPerSecond = 4.17;
      // To get full reading time, ignore cache and sample
      return legacyRound(lexiconCount(text, false, true) / wordsPerSecond, 2);
    };
This outputs a value in seconds corresponding to the time it would take for the average adult to read the text.
Median grade
The median grade is calculated by pushing all the grades (both lower and upper bound integers for floating point values), and then taking the median grade.
This is not a scientific result in any way. Heck, the whole concept of readability escapes scientific scrutiny (just look at the number of different tests with different values!). If you want to modify it, you could use the average grade as well (take both rounded down and rounded up to get the grade spread). Or you could find what grade is the most common in the whole spread and use that instead.
Regardless, I’ve chosen median as it excludes the outliers nicely and typically the grades would converge enough to have the median reflect the average anyway.
How to use the utility variable
Once you create and save the Custom JavaScript variable, you can invoke it from other Custom JavaScript variables or Custom HTML tags.
For example, let’s say you have all the main content of any given page stored in an HTML element that can be accessed with the CSS selector .post-content .main-content-wrap.
Here’s what a handful of different Custom JavaScript variables would look like, each returning a different value from the readabilityFunction output.
There are many ways to skin this cat, so feel free to get creative.
Get the Flesch-Kincaid Score
function() {
  var el = document.querySelector('.post-content .main-content-wrap').textContent;
  return {{readabilityFunction}}(el).fleschKincaidGrade;
}
Get the median grade
function() {
  var el = document.querySelector('.post-content .main-content-wrap').textContent;
  return {{readabilityFunction}}(el).medianGrade;
}
Get the reading time in minutes and seconds
function() {
  var el = document.querySelector('.post-content .main-content-wrap').textContent;
  var readingTime = {{readabilityFunction}}(el).readingTime;
  return Math.floor(readingTime / 60) + "m" + Math.round(readingTime % 60) + "s";
}
This would convert a reading time (in seconds) of 129.67 to "2m10s".
Google Analytics setup
Once you have the values you want to access, all you need to do is send them to Google Analytics.
Here’s a sample setup. It sends the median grade to Google Analytics as a Custom Metric, and it collects the reading time as another Custom Metric. To make results easier to scan at a glance, we’ll also send the median grade as a Custom Dimension.
But before we start, here’s a caveat you need to be aware of.
DOM Ready
If you use DOM methods to check the readability of content from the web page, you might not be able to use a Google Analytics tag that fires on the All Pages trigger.
This is because a potential race condition can emerge where the All Pages trigger can fire before your DOM content is available for Google Tag Manager.
In this case, you are left with two options:
- Send the readability data with an event (or another pageview) where you set the
nonInteractionfield totrue. - Delay the Page View hit a bit to fire on a DOM Ready trigger instead.
The main problem with (1) is that you won’t be able to parse the data in your main Page View report (which is the logical place for it), and would need to join the data outside Google Analytics instead (or perhaps use a custom report creatively).
The main problem with (2) is that you risk missing a fraction of your pageviews because the hit is delayed a bit.
If it’s a single-page app, you are in luck as you can instruct the developers not to fire the virtual pageview event until the content has been fully rendered on the page.
1. Custom JavaScript variable for median grade
Remember to change the el variable assignment to match whatever content you want to evaluate. In this example, it’s an HTML element accessible with the CSS selector .post-content .main-content-wrap.
function() {
  var el = document.querySelector('.post-content .main-content-wrap').textContent;
  return {{readabilityFunction}}(el).medianGrade;
}
2. Custom JavaScript variable for reading time
Remember to change the el variable assignment to match whatever content you want to evaluate. In this example, it’s an HTML element accessible with the CSS selector .post-content .main-content-wrap.
function() {
  var el = document.querySelector('.post-content .main-content-wrap').textContent;
  return {{readabilityFunction}}(el).readingTime;
}
3. Google Analytics - Admin - Custom Definitions
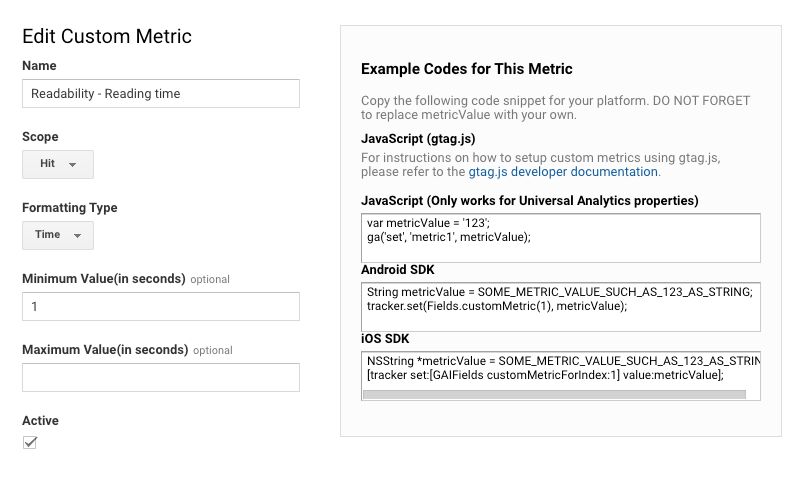
Here’s what the Custom Metric for Reading Time looks like in Google Analytics admin:
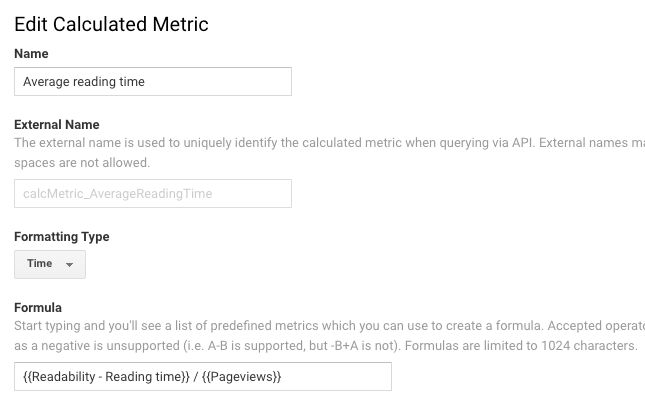
If you want, you can build a Calculated Metric to get the average reading time across pageviews.
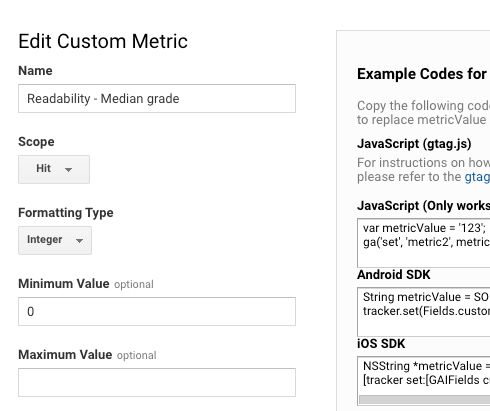
Here’s what the Custom Metric for Median Grade looks like:
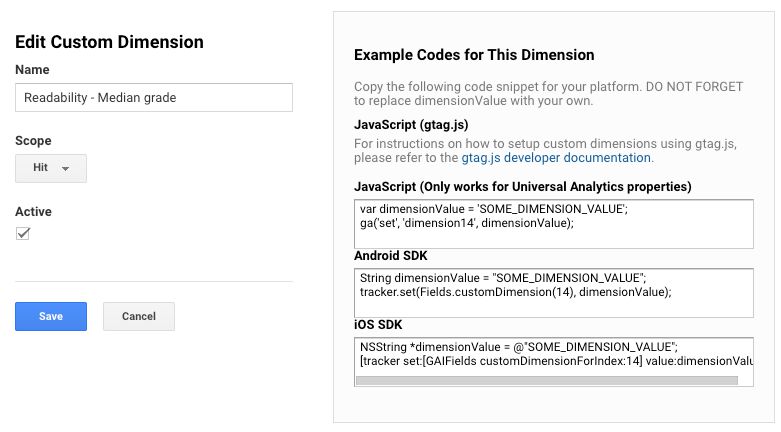
Here’s what the Custom Dimension for Median Grade looks like in Google Analytics admin:
4. Google Analytics tag
Finally, here’s what a sample Page View tag would look like, modified.
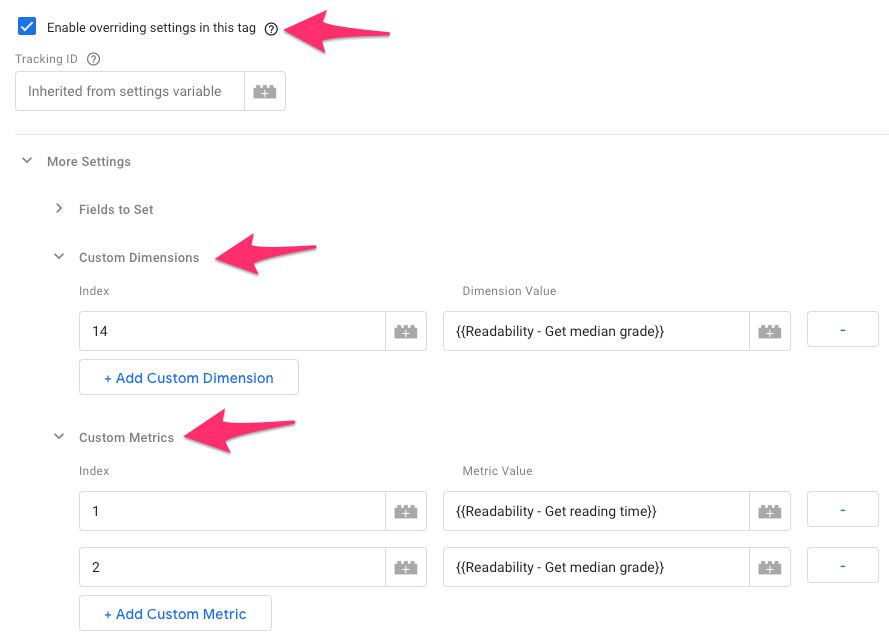
Just remember the caveat about DOM ready triggering I mentioned above.
5. How to access the results
The Custom Dimension will be available as a secondary dimension or in a custom report.
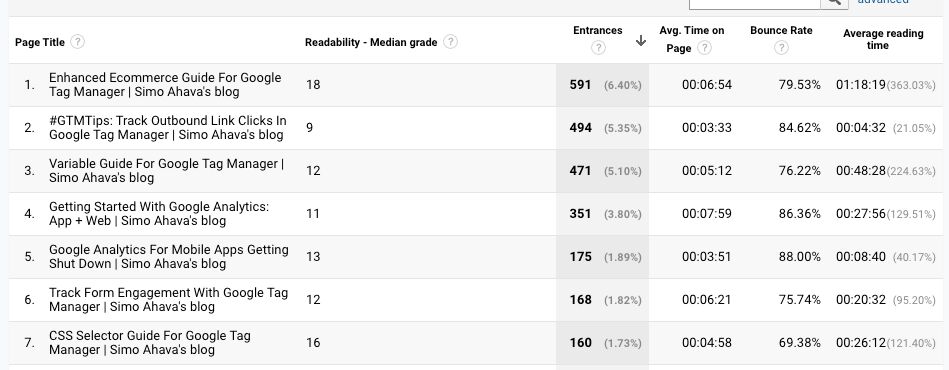
The Custom Metrics (and the Calculated Metric if you opted to create one) will be available in custom reports as well.
Note that instead of messing around with awkward custom reports, you might want to extract the data out of Google Analytics using e.g. the Google Sheets add-on as this gives you far more flexibility in building your own reports.
Google Analytics: App + Web setup
If you want to send the data to the new App + Web then all the power to you! Setting it up is easy - just create a new App + Web event tag for your Page View (you might want to disable the default Page View from the config tag), and add the variables as new event parameters.
Make sure this tag, too, triggers on DOM Ready.
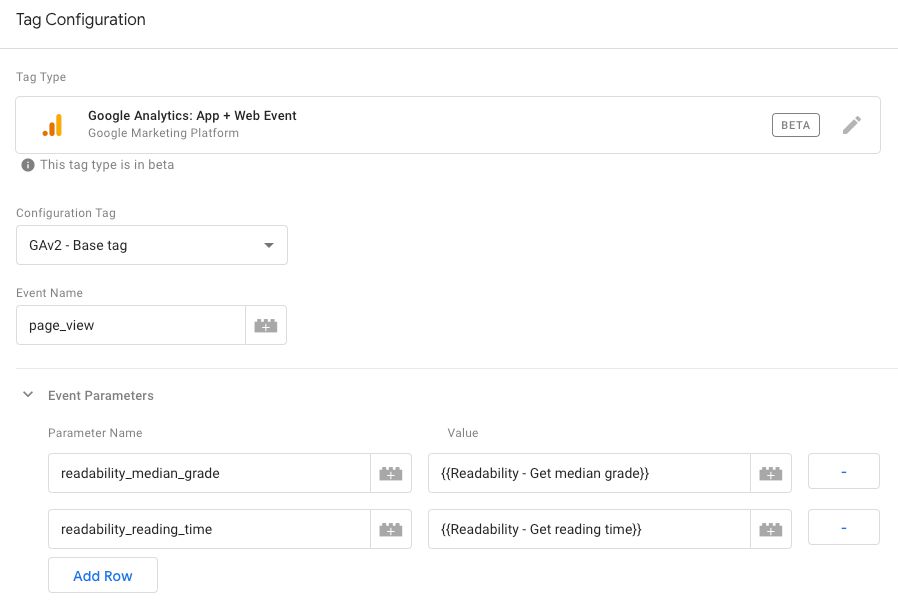
Once you do this, the events should start showing up in the App + Web streams:
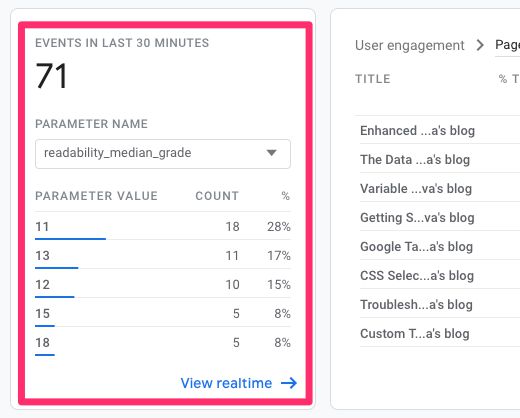
In order to build reports for these parameters, you need to include them in parameter reporting.
Once you’ve collected some data, head over to Events -> All Events, and click the little action menu at the end of the row with the page_view event. Select Edit parameter reporting from this menu.

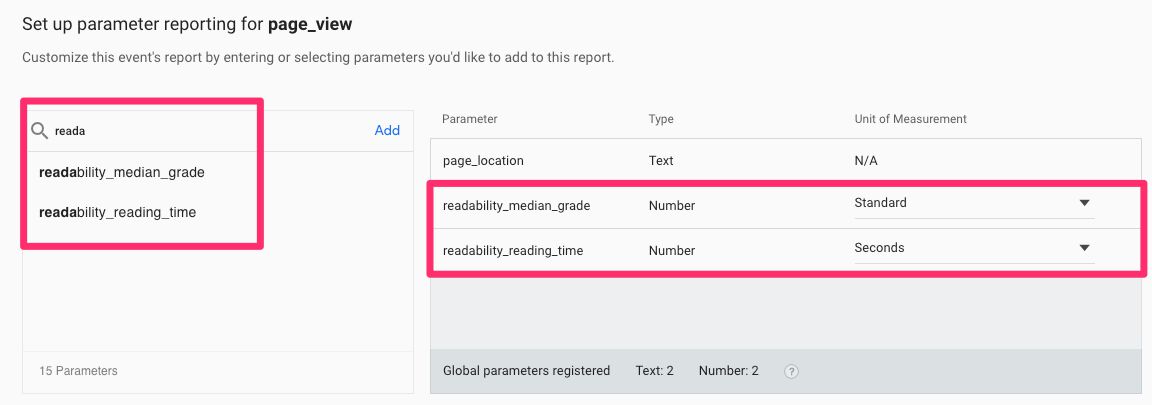
In the overlay that appears, find the two readability_* parameters to add them to the list of parameters included in reporting. Set the type of the median grade parameter to Text, and the type of the reading time parameter to Number / Seconds.
Once you’ve done these, and once you’ve accumulated some new data, you’ll be able to find the two parameters as their own widgets when you select the page_view event in the event list, and when moving through the Analysis reports.
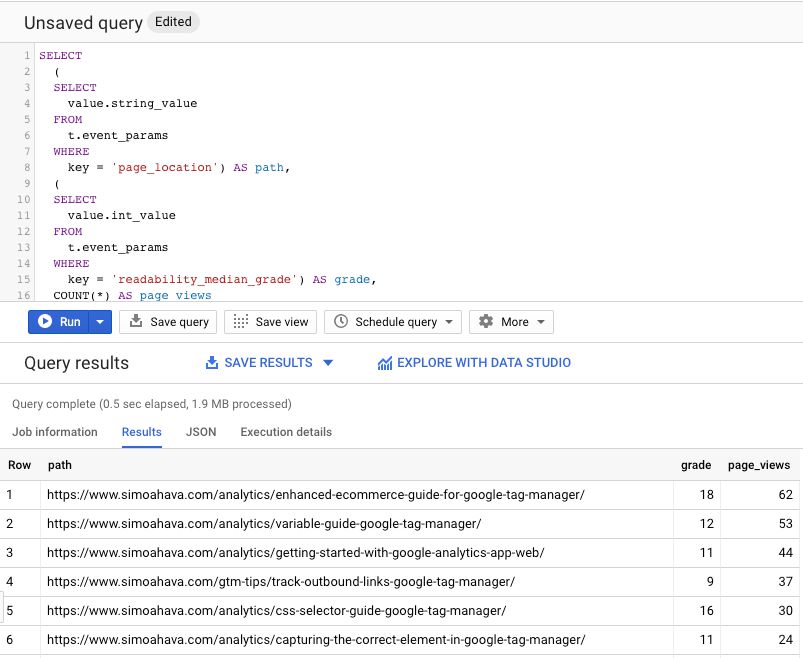
Note that if you’ve configured a BigQuery export, the parameters will be included whether or not you add them via the event parameter reporting user interface!
Summary
Let’s discuss the caveats first.
The script itself is fairly simple, basically chopping down the text into constituent parts and then performing calculations with those parts. However, it can perform poorly if its fed a lot of content to process. Performance of regular expressions degrade in correlation with the amount of content, and with a large body of text the parsing can disrupt your page load. This is mitigated with the use of a cache and a sampling threshold, but you’ll need to tinker with these to get the best accuracy and the best performance.
The regular expressions are not perfect. Particularly parsing sentences turns out to be quite difficult to manage with clarity, and I have opted for a fairly simple algorithm in the script.
All in all, readability scores need to be taken with a grain of salt. They abstract away much of what is gained with context, and they know nothing about the background of the reader. They count things like syllables, long words, and short words, and try to assign labels like “easy” and “difficult” based on these calculations.
The grade-level abstractions are also calculated based on U.S. averages. Whether you want to draw any conclusions is totally up to you, but I do think how much different the levels would be in a country like Finland, where the education system is somewhat different.
Having said all that, it’s still a fun idea to play around with especially if you’re in the business of creating content. Readability is a great concept to work towards, and the grades for my own content (almost categorically past college-level) have given me some pause. I think it’s a great way to design content to be as readable as possible, and tools like this should give you some insight.
Whether or not Google Analytics is the right place to measure this remains to be seen. But I would imagine there to be benefits to correlating readability and reading time with overall engagement metrics. Something to optimize against, I think!
Let me know in the comments what you think about this approach!