
I have been, directly or indirectly, responsible for growing and nurturing several developer communities for over a decade now. Along the way, I’ve come to realize that there are lots of misconceptions in terms of what characterizes successful developer engagement programs, and how to effectively measure their impact.
A lot has already been said on the reasons why vanity metrics are dangerous, so why should you bother reading further? Well, what I had originally planned as a short brain dump ended up covering pretty extensively the pitfalls of vanity metrics in the specific context of developer engagement.
This article will help you identify some areas where you can improve, and new indicators that you will want to start tracking. I also hope it will help change your mindset so that you can actually start becoming proud of your not-so bright metrics and what you have learned from them.
I would really like to hear about your own experience in the comments below. You can also follow me or ping me on Twitter.
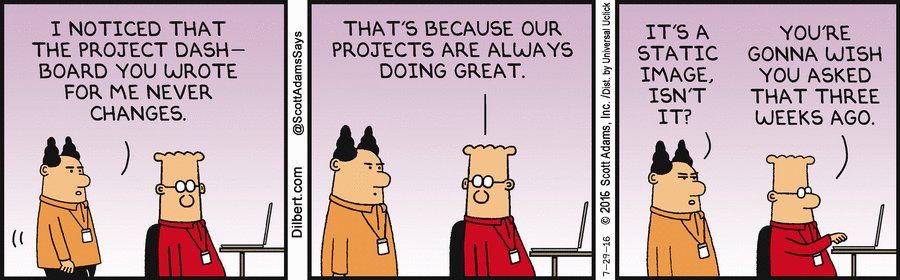
Fear the Green Giant… Dashboard
Who doesn’t like a performance dashboard filled with green indicators? Well… I don’t!
If your dashboard shows a majority of green indicators, you’re doing it wrong
Whether it’s intentional or not, if your metrics and KPIs are designed to make you “look good”, you’re probably not looking at the right thing, or at least not with the right level of granularity.
A “green” dashboard is not inherently bad—who would I be to question the fact that your community is growing anyway? What I am quite confident is bad, though, is a dashboard that does not capture and highlight the things that are not working… and there are always a few behind even the most stellar aggregated metrics.
The rest of this article will cover several ways you can refine your metrics to capture better the things that can be improved.
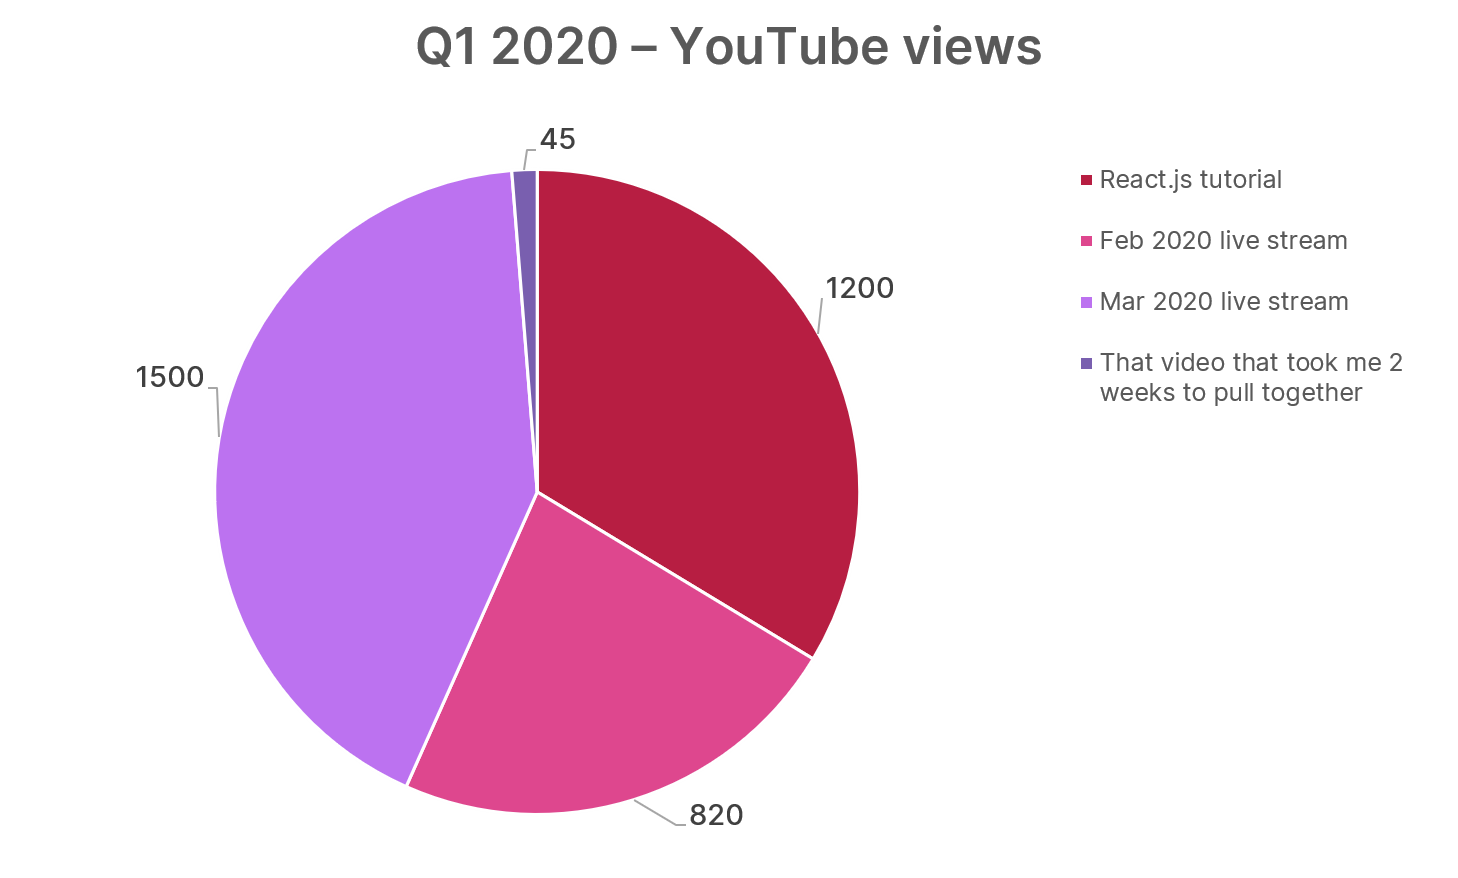
As a rule of thumb, always make sure that all the activities accruing to a given (green) indicator do it equally so. Just think about it: if out of four things you’re doing successfully overall—maybe you even exceeded your initial goal!—one is in fact really lagging behind, you might as well focus your time and effort on the ones that work, right? Or at the very least, you’ll want to analyze what is making that one activity unsuccessful, in order to do better next time…
Learn from the outliers

I can’t emphasize this enough: you will learn a lot by making sure your metrics have the right granularity, and by digging into your “outliers”, i.e those articles/social posts/videos that are performing particularly well–or not, for that matter.
Whenever I’m faced with a piece of content that is in appearance successful, I always start by trying to answer these two related questions:
- Is this an actual success, or are my metrics somehow biased or, worse, simply inaccurate?
- What made this piece perform so well?
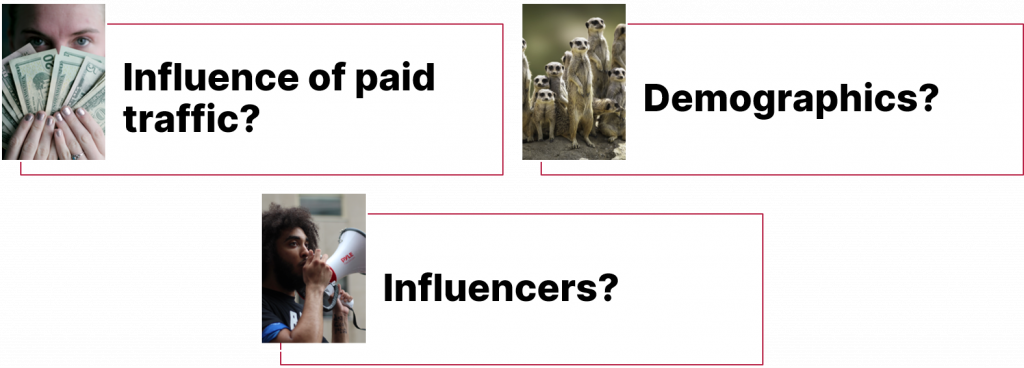
More specifically, when it comes to deciding whether I should celebrate an actual success, I usually ask myself:
- Has the content been promoted as part of a paid campaign? If so, it is worth looking at its organic traffic stats, and how they compare to your average article. A sub-par article can easily be flagged as impactful when, in reality, you’ve only paid for getting more eyeballs on it without particularly generating attention or engagement. More on the topic of engagement below)
- What are the high-level demographics of the people who viewed or relayed my content? Would you call impactful an article that got shared or liked by 100 people among which 95 you either personally know or they happen to be direct or indirect colleagues? Personally, I’d rather have ten times less engagement if the people involved happen to spread the word in more distant and uncharted social circles.
- Who, specifically, promoted and shared my content? There are good chances that your content has been picked up and amplified by some media outlets or key influencers in your community. Find who these are, and always try to personally reach out and engage.
On the opposite side of the spectrum, there are those “meh” articles or videos that didn’t seem to find an audience and that can also teach you a lot:

Jeremykemp at English Wikipedia / CC BY-SA.
- The success, or lack thereof, of your content is often going to be correlated to where in the hype cycle the technology you’re covering stands.
If you’re covering bleeding edge technology, an underperforming article should not necessarily be a cause for disappointment. However, you will want to look for signals showing that it piqued the curiosity of at least some folks! - Don’t underestimate the impact of SEO and optimizing for social media. Sometimes, the only explanation as to why some content is lagging behind is that you didn’t take the time to create a nice visual/card for catching people’s attention when your post pops up in their timeline.
Eyeballs are nice, engagement is better
A metric that often contributes to the “green dashboard symptom” is the mythical pageview, and all its variations (ex. Twitter impressions).
Is there something truly useful to your business that you can deduce from how many pageviews your technical article got?
You may argue that tracking pageviews allows you to measure your thought leadership and your reach. However, and at the very least, that’s assuming you have a good understanding of the size of your overall potential audience, otherwise you’re just making a wild guess about what a “good” number should be…
In most cases, you will be better of looking at the actual engagement of your audience. Rather than pageviews, I tend to look at the following instead:
- Impressions click-through rate (CTR). Out of 100 people presented with the thumbnail of my YouTube video, or the link to my post in their Twitter feed, how many did I convince to click to learn more?
- Number of comments. If I’m getting tens of thousands of views and not a single person is bothering commenting—even to simply say “Thanks!”, or “Cool stuff!”—or asking a question, I usually start being concerned about the relevance of my article, or at least if I did all I could to foster engagement from my audience.
Trends over absolute numbers

People you will share your metrics with likely have no idea if getting 50,000 views per month on your YouTube channel, or 70 retweets on your Twitter campaign is any good. In fact, you probably don’t either.
However, if you are able to show a trend over the past 7, 30, and 365 days, of how a particular metric has evolved, this will make it much easier to evaluate the impact of your various activities.
What’s more, this will also force you to not rest on your laurels, by giving you a way to spot absolute numbers that seemed huge a couple years ago, and that have, in fact, been stagnating since then.
There’s always room for improvement
Like everyone else, I like celebrating a successful article or video, and so should you. However, even your most successful content has downsides if you analyze it carefully.
Remember that contest you ran with a bunch of partners and that was super successful? Well, try and do the exercise of looking for that particular metric that might not shine as much as the others. By looking at your referral traffic, for example, you may notice that the impact of the promotion activities of one of the partners is lagging behind. Why is that? Maybe this partner’s community isn’t the right target for you? Maybe the tone you usually use just needs to be tweaked for this particular crowd?
It might sound like nitpicking to look for things that didn’t work, but trust me, you will learn a lot by paying attention to these.
Don’t set (arbitrary) goals too early
It is very tempting to look at some of the metrics your existing tools are giving you access to (ex. pageviews), increase them by an arbitrary ratio, and then use this number as your goal for the upcoming period. This is just wrong.
First, unless you’ve already been thinking about them twice, I doubt the goals that you initially set will reflect tangible and actionable insights. Congratulations, you have 20% more unique visitors on your web property! Now what? Are these visitors directly driving 20% more usage of your products? Are you even aiming for increased adoption in the first place? What if I tell you that your competitor saw a 100% growth during the same period, is that good or bad?
Once you’ve narrowed down some of the trends you are going to monitor, it becomes much easier to adapt your programs and tactics to make sure you’re aiming for continual improvement and growth.
Your community ≠ your official channels
A common mistake when looking after a developer community is to limit the breadth of monitored channels to your official/corporate ones. It usually stems from a pure tooling limitation: we naturally tend to only pay attention to the channels that can easily and automatically be tracked (see previous paragraph), since we directly own them.
However, your community lives in many places, and I would be surprised if your goal is to only grow traffic and engagement on your own properties. Whether you have tools that allow you to do this automatically or not, you should make sure you track metrics related to your performance on third party channels and platforms.
At a minimum, in particular if you’re finding it cumbersome to collect information for the properties you don’t directly own, you should always make referral traffic one of your key indicators. This way, you can directly evaluate how much your content has been shared or linked to from third party channels.
Empower your authors
For many organizations, the people creating the content are not necessarily the ones that are responsible for actually publishing and promoting it. This is of course how organizations can scale and how people can stay focused, but this presents a major flaw. In order to truly meet their audience, your authors need to be able to see first-hand how their content performed.
While not everyone is an expert at Google Analytics or social media tactics, you should aim at giving your authors direct access to the tools that will allow them to quickly assess if their message landed with their intended audience.
Don’t underestimate the impact empowered authors can have on your content creation activities and your overall organization. That feature owner who did their best to write a series of blog posts about a new release, actively engaging in promoting their piece in key communities and seeking developer engagement? It’s them who are going to get tons of valuable first-hand feedback from their actual users, as they will have been able to meet them where they are. And it’s them who are the thought leaders you need to establish trust with your developer community.
Automation should never replace your own judgment

From Google Analytics to Adobe Analytics to your favorite content marketing tool, you probably have at your disposal a ton of metrics that are automatically collected, and consolidated into nice reports. This is great and can save you a lot of effort every time you need to share an activity report with your stakeholders.
That being said, not only should you not trust these metrics blindly (remember to pay special attention to outliers), but you should also make sure to complement them with your own manual findings.
As an example, here are some of the things I do to give my reports more context:
- For social media amplification, I always dig into the demographics of the people who ended up sharing or re-sharing something.
Like I mentioned before, I’ll always tend to prefer articles that have been shared less if the people who shared it are not direct members of my community, nor colleagues. - For video content, ex. on YouTube, I try to compare the number of comments or number of likes (and dislikes!) that key videos are getting to the numbers that videos from similar communities, or close competitors, are getting. It is likely that you will have to collect these numbers manually, but it should only take you a few minutes.
- I often try to manually capture and quote a couple key comments/posts/tweets from the community (both positive and negative ones!). If you have access to sentiment analysis tools, do not hesitate to use them to help you look in the right direction.
Promoting content is not an exact science.
Stephanie Morillo (@radiomorillo), Developer’s Guide to Content Creation.
Not all indicators come in the form of tangible numbers, and you won’t always be able to directly include them in your report tables or to track their evolution over time. However, they are instrumental in reminding you that you should not overlook the human aspects, and the importance of personal interactions, in your developer community.
Once again, if you found this article useful, or if you’ve had other experiences, I would really love to hear from you in the comments. In the meantime, I’ll leave you with a few links to some really good resources.
Useful links & resources
- The definition of vanity metrics and how to identify them. A great article from Tableau, including a great list of alternatives to the typical vanity metrics.
- The Developer’s Guide to Content Creation, by Stephanie Morillo (@radiomorillo).
- What is Developer Advocacy?, by Ashley Willis (@ashleymcnamara).