Optimization in Swift, part 1
This will be yet another exploratory series on my blog — this time around, I want to write a little about optimizing performance in Swift code. This is, of course, an endless topic so what I’m going to do is, similarly to previous posts, focus on a problem and then track my way through working on it.
Also, since this might turn into a somewhat longer read, I thought I’d split it into several short parts; so if you are in fact interested to read through you don’t have to put in all the time at once.
When and What to Optimize?
I’m sure you’ve heard the Donald Knuth quote “premature optimization is the root of all evil…” (WikiQuote) but what’s more interesting is the full quote:
“The real problem is that programmers have spent far too much time worrying about efficiency in the wrong places and at the wrong times; premature optimization is the root of all evil (or at least most of it) in programming.”
My understanding of this is that there is a place and a time for optimizing the code and it’s important to understand when and what to optimize.
As-you-go: If you have the experience, you should be optimizing automatically as you go because some red flags are hard to miss and taking care of them shouldn’t require much time. For example, code where you use an O(N) operation inside a loop (let’s say Array.first(where:)). Doing that might be required for what you want to achieve, but you should automatically stop and make sure there is no better way.
Data-driven: Then, once performance is an issue (and likely only then), you should know what metic are you optimizing for and how to measure your success. This is the kind of process I’m going to explore a bit in these posts.
So let’s get started.
A Faster filter
In these posts I’ll explore my way to filtering data in my app a little faster. So here are the answers to the main points from the previous section:
— Is performance an issue? We’ll assume that I have an iOS app in the works, it needs to filter a big array of numbers coming from a sensor in order to update the UI, and the time it takes to do that deteriorates the user experience.
— What metric needs optimization? Often times metrics are co-dependent — you could use less RAM but at the price of an increased duration, or you could keep the machine’s thermal state nominal but at increased duration. In my case, I’d like to filter faster in order to improve the UI update rate.
— How to measure success? I’ll pick some representative data sets to measure with and measure the time it takes to filter them. Ideally I’d have a target I want to reach. Since I’m not sure how faster I can make the code, let’s aim for slashing Array.filter’s duration in half.
We won’t talk right now about many other constraints you might have — concurrency limitations, asynchrony limitations, etc. We’ll keep the post exploratory and mention few of these extra constraints along the way.
Measuring Algorithms
I usually use Instruments to measure time intervals. I’d do something along the lines of:
|
|
Then I profile the project with the os_signpost instrument (not in combination with other instruments so the durations aren’t affected by them):
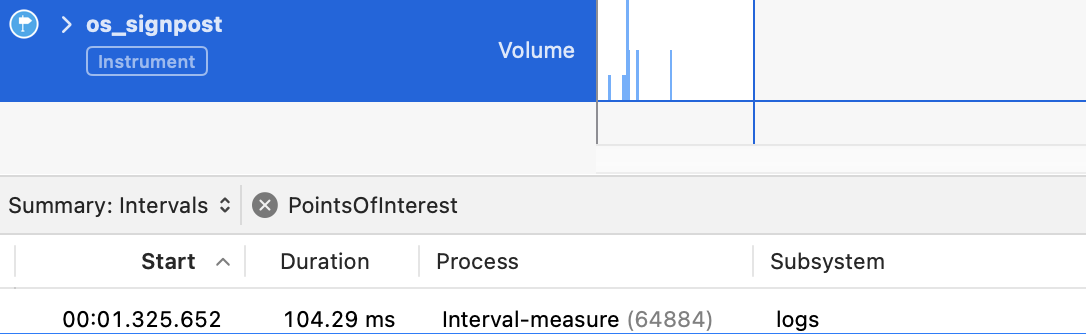
This works if you have a handful of cases you want to measure. However, for my current task I want to know the effect of my changes across different array sizes. Luckily, as I mentioned in The issue with task groups… Attabench is great for performing series of measures across series of data sets and plotting the results.
Attabench allows me to create a Swift package and run it interactively to measure the code performance. As a start, I’m gonna add a function to use when filtering (I’m using an arbitrary filter logic for this test):
|
|
And the code I’m going to measure is below. input is the array provided by Attabench to the benchmark task:
|
|
Adding a new benchmark task called Sequence.filter 🎈 I can instantly see the measurements in Attabench:
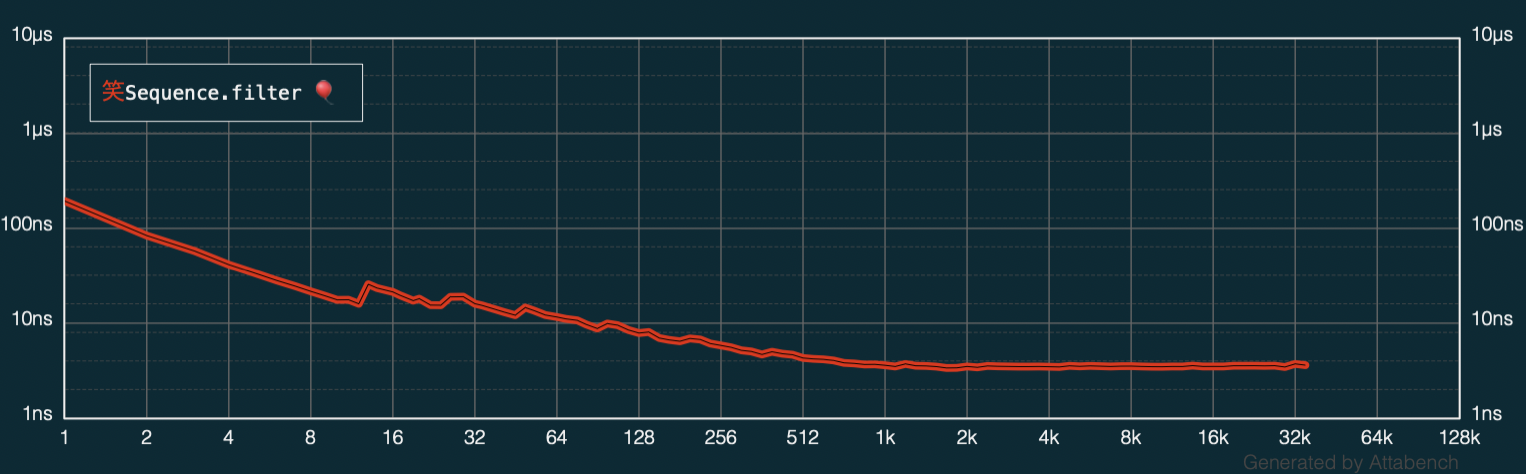
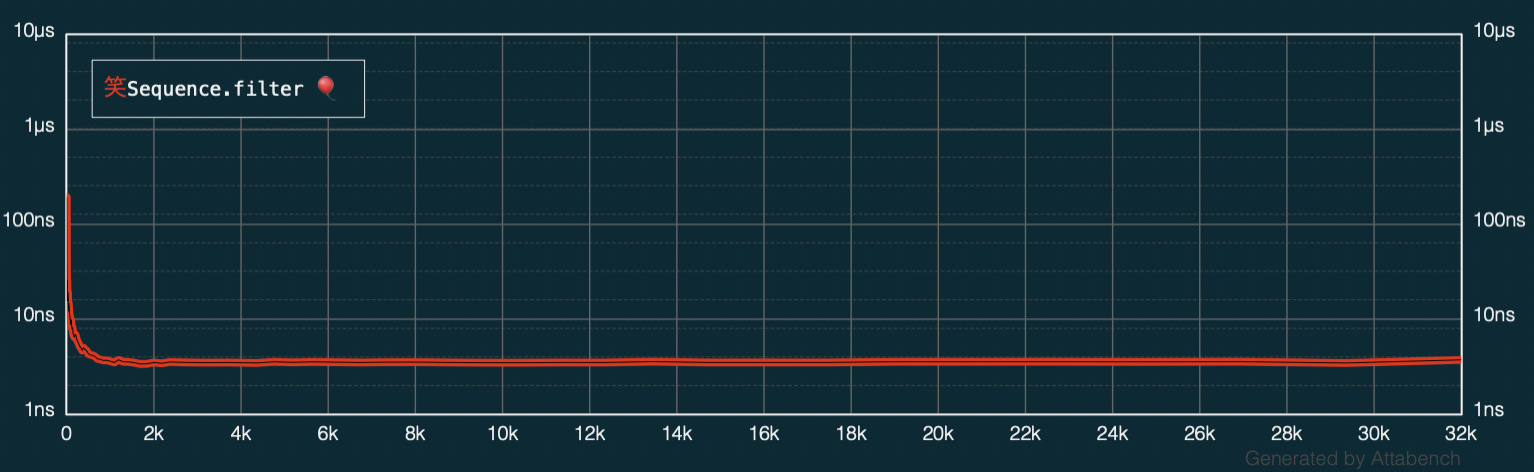
The metric plotted on this chart is the time it takes to filter the array adjusted for the size of the array. You see that the time to filter a single element eventually settles down to an (almost) flat line. And in fact, if you disable the logarithmic scale for the size-axis you see that the performance settles quite quickly indeed:
So — I know what I’ll be optimizing for and I have a plan how to measure my progress. In part 2 I will look into using some of the new async/await Swift concurrency to see if I can get my code to run faster.
Where to go from here?
If you’d like to support me, get my book on Swift Concurrency:
Interested in discussing the new async/await Swift syntax and concurrency? Hit me up on twitter at https://twitter.com/icanzilb.