


Chrome DevTools is a fantastic tool that often goes overlooked in technical audit guides, and by SEOs in general.
Many of us pay for extensive tool suites (with some tools costing thousands of dollars) with the goals of:
- Acquiring more data points.
- Simplifying and automating parts of our work.
Yet, no single tool replaces the analysis that can be performed by an SEO, applying logic and qualitative prior knowledge.
Outside of the paid tool suite, there are a number of free tools in the market that all serve their own audiences. But one of the most useful free tools for both basic and advanced SEO audits is Chrome DevTools.
Built into the Chrome browser, DevTools has a number of features that allow us to validate and audit some technical SEO fundamentals, as well as more advanced audit points.
For the most part, DevTools is relatively straightforward and easy to use. That said, there are a small number of extremely useful and not-so-obvious use cases that lend themselves to the technical auditing process.
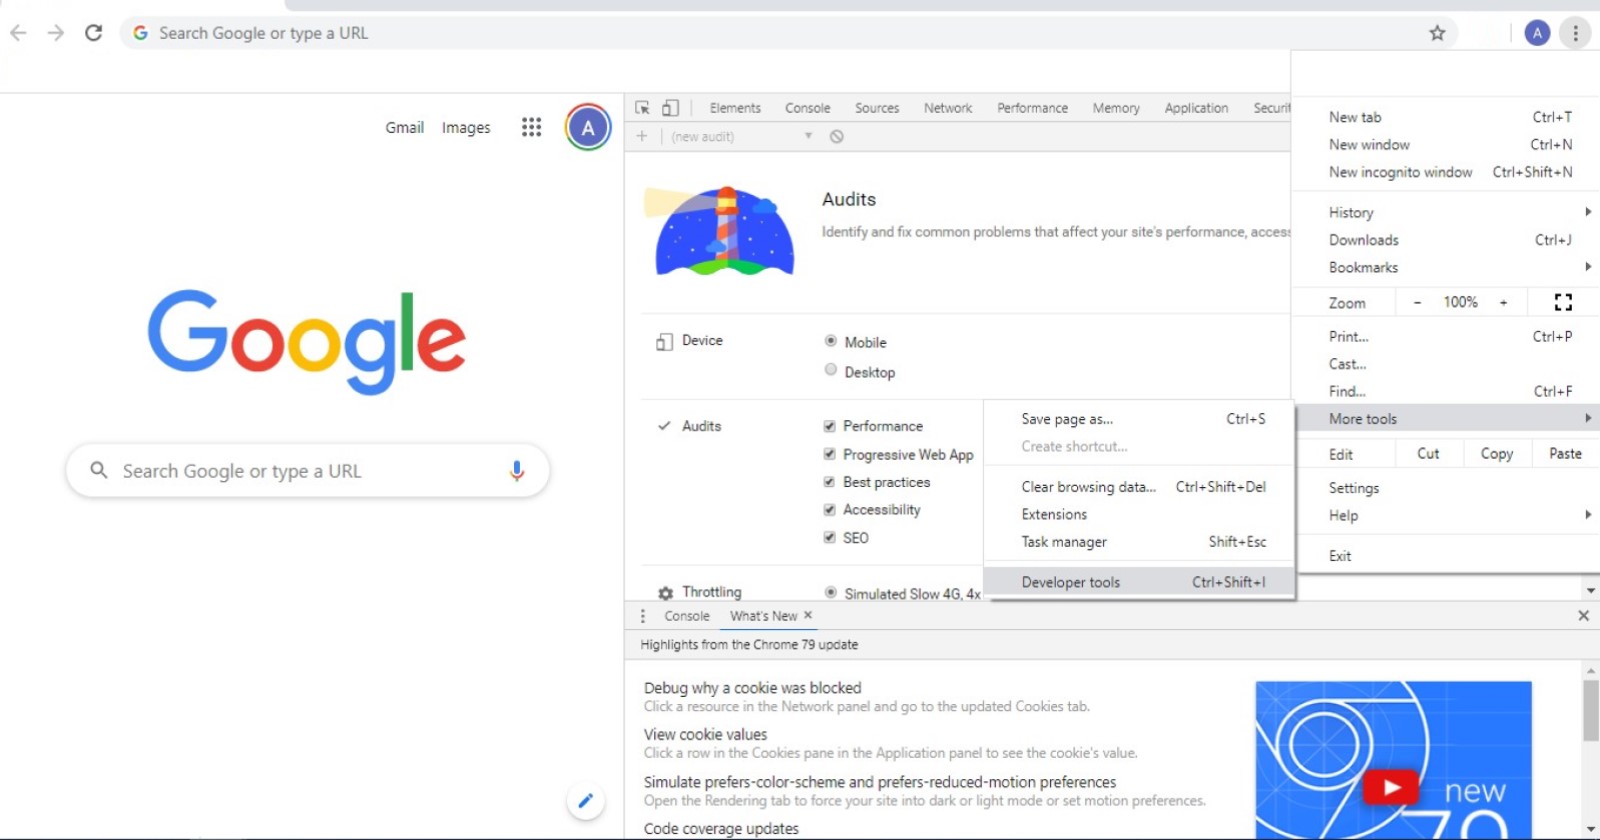
To open DevTools, you can right-click on a webpage and click on “inspect”, or by clicking on the three-dot burger menu in the top right-hand corner of the browser, and selecting More Tools > Developer Tools.
Below are some of the ways you can use DevTools to either identify issues or validate those being raised by third-party tools.
1. Check If You Content Is Accessible
Sometimes taken for granted – unless you’re working with JavaScript, which gets more focus – it’s important to verify that your main content elements are being identified by search engines.
While Google does have processes in place to crawl and render your site’s content, it’s not always 100% and sometimes can fail for various reasons.
The DOM (Document Object Model), which can be seen in the Elements tab of DevTools, enables you to:
- Review various content elements including the meta title and main page body content.
- Verify if it can be picked up by Google.
A key thing to look for here is the differences between source-code and the contents of the elements tab.
When auditing websites that have heavy JavaScript usage, content – such as page headers – sometimes appears fine in the HTML source code. But if injected via JavaScript, it may just show as a JS block in the Elements tab.
This can potentially be an issue, later verified through performing a site:example.com/page “content you’re looking for” advanced search and checking the cached version of the page.
While Google does have the two-step process for JavaScript crawling, it’s always best to make things as easy for Google to discover content on your site and reduce process complexity.
2. Emulate Multi-Device Experiences
Having a mobile-friendly website, in the vast majority of cases, is and has been an essential component of a successful website for a number of years now.
DevTools can help in determining both mobile-friendliness and in diagnosing usability and speed issues.
Usability
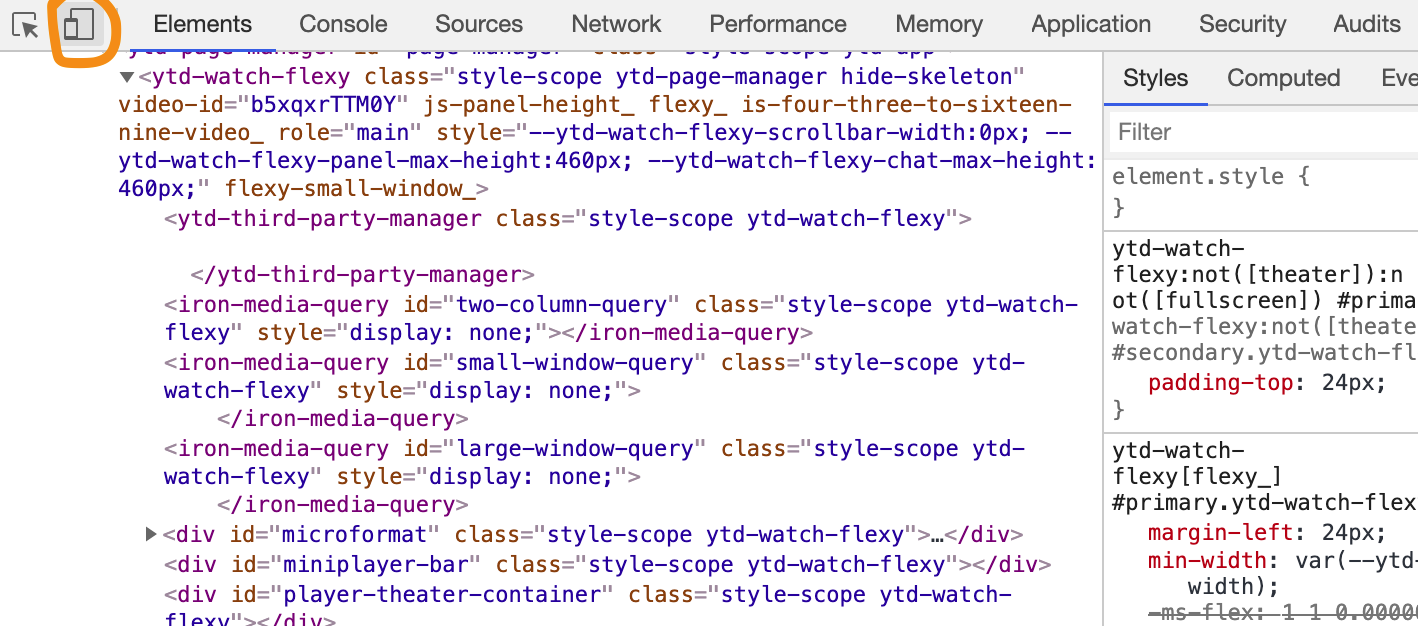
In DevTools you can shift between mobile and desktop through the Device Mode icon:
You can also shift between the two modes using keyboard shortcuts, using Cmd+Shift+M on a Mac or Ctrl+Shift+M on a Windows of Linux OS, while the DevTools interface is open.
From experience, this is an effective auditing method – rather than resizing the browser window to test responsiveness.
In Device Mode, you can change between responsive viewports or choose between different pre-set devices to test your page.
This can be useful in identifying any potential issues if you have a large number of visitors from a specific device but a lower than average conversion rate.
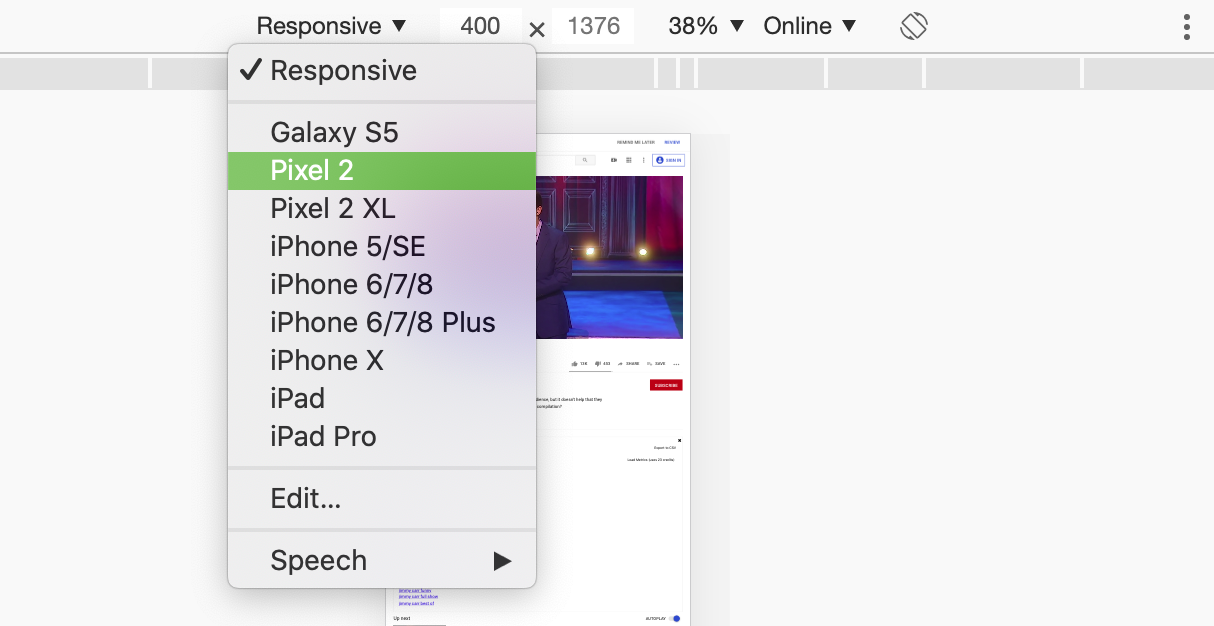
However, as you can see from the above screenshot the preset options list is outdated, as the Pixel 2 is now superseded by the Pixel 4. You can set custom dimensions for other devices using the Edit option.
Site Speed
Along with mobile, site speed is also an important factor in both SEO (thanks to the speed update) and usability.
While there are a number of third-party speed testing tools, if you’re auditing a staging website behind HTTP Auth and blocked in robots.txt., DevTools can be a great solution to testing these webpages.
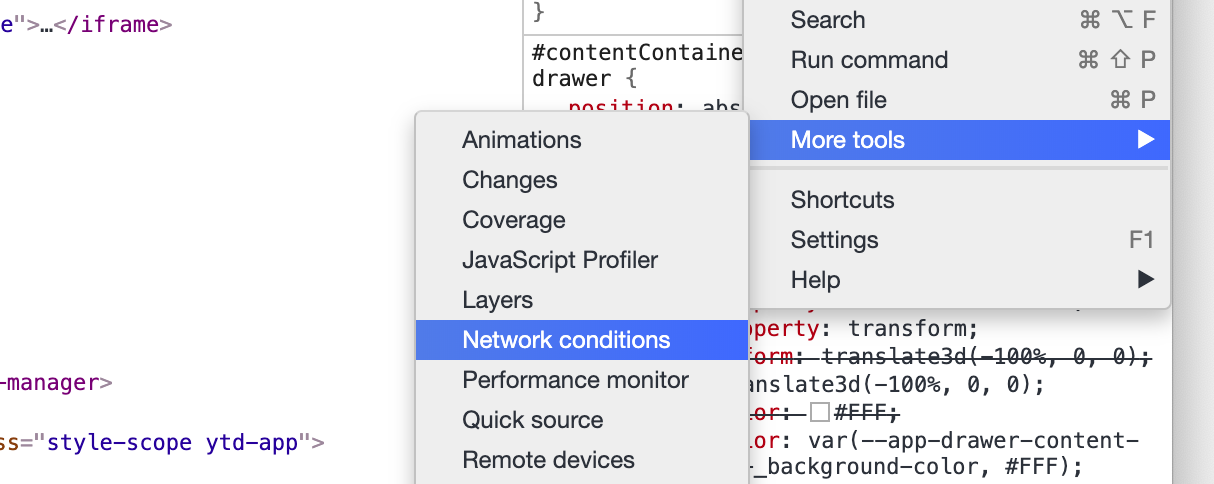
From the three-dot burger menu in the top right of the screen, you can access Network Conditions (found under More Tools).
In the Network Conditions panel, you can choose to:
- Disable the browser cache.
- Purposefully throttle the network to fast 3G, slow 3G.
- Or add a custom throttle.
You can also select from a gamut of user agents ranging from Googlebot Smartphone through to various Microsoft Edge UAs, and Opera.
I recommend using Google Analytics data and testing the browsers and devices that the greater majority of your users use.
Once you’ve got your settings, you should navigate to the “Network” tab, and see both the page load, but also when the initial markup on the page has been parsed, DOMContentLoaded, both of which are visible at the bottom of the DevTools panel.
For further speed analysis, you can run Google Lighthouse from the Audits tab.
3. Render Blocking Resources
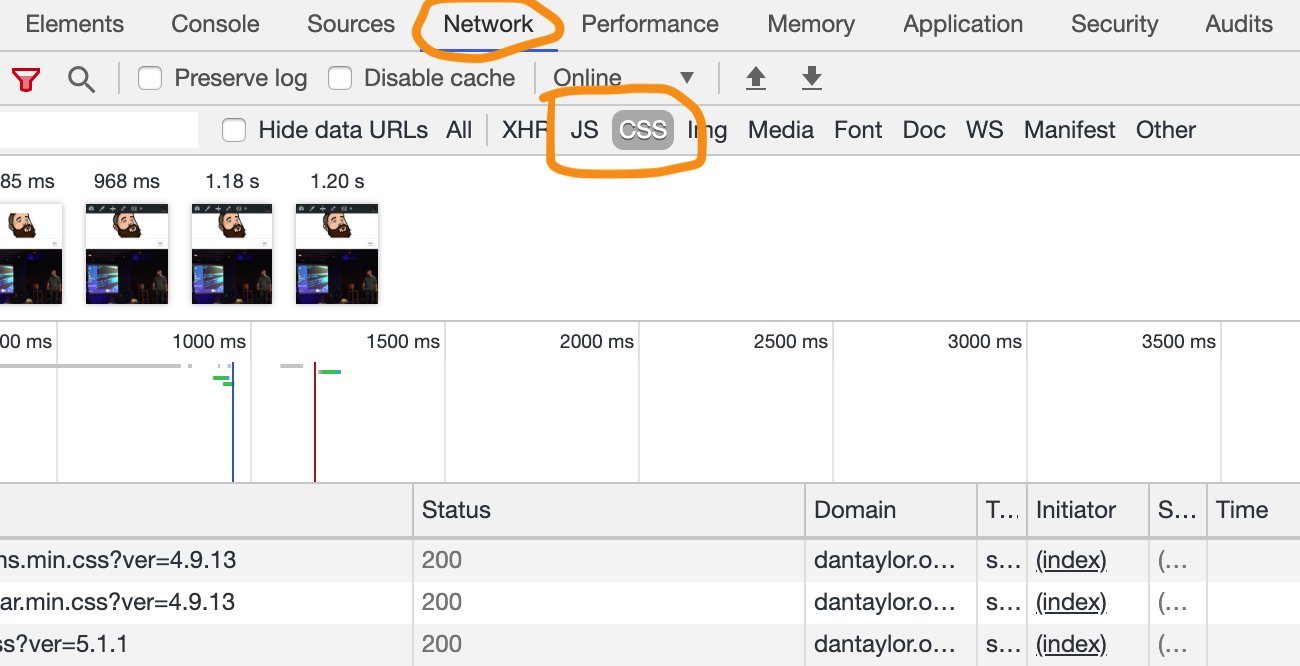
As mentioned previously, from the Network tab you can identify which JavaScript and CSS resources are being loaded before the DOM.
While this isn’t necessarily an issue on all websites, having resources load ahead of the DOM can potentially lead to it being blocked, which is one of the more common and resolvable site speed issues.
These can be identified by filtering for JS and CSS in the Network tab:
4. Check Resource Status Codes
The Network tab also allows you to check the HTTP status of your resources. This is invaluable in both checking if any resources return 404s or 5XX, or if your caching is working as intended.
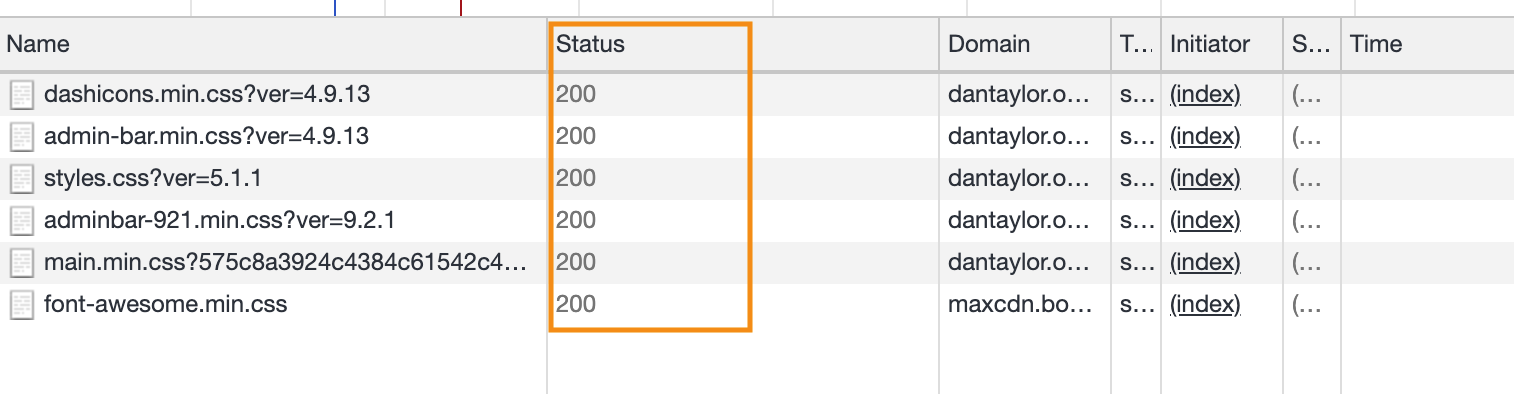
Resources loading a 200 are fine, as are any resources that return a 304.
304 is sometimes mistaken as a redirect, but in this case, it’s a sign that the Last-Modified cache method is working as intended and that the browser already has information on the resource and it doesn’t need to download them again.
More Resources:
- How to Perform an In-Depth Technical SEO Audit
- Understanding the Role of a Technical SEO Audit
- Advanced Technical SEO: A Complete Guide
Image Credits
All screenshots taken by author, January 2020