Vue Charts
Using ApexCharts to create charts in Vue.js
Vue.js framework’s attention on the view layer takes into consideration simple integration with different libraries as well. And that’s why today we will see how ApexChart integrates into the Vue.js ecosystem.
Vue-ApexCharts is a wrapper component for ApexCharts ready to be integrated into your vue.js application to create stunning Vue Charts.
In this post, you will learn how to use Vue-ApexCharts component to create various charts in your vue.js application with ease.
Install
Install the Vue-ApexCharts component in your Vue 2.0 application from npm
npm install --save apexcharts
npm install --save vue-apexcharts
Usage
import VueApexCharts from 'vue-apexcharts'
Vue.use(VueApexCharts)

Vue.component('apexchart', VueApexCharts)
Note: If you are using Vue 3, then you should do
npm install --save apexcharts
npm install --save vue3-apexcharts
import VueApexCharts from "vue3-apexcharts";

const app = createApp(App);
app.use(VueApexCharts);
// The app.use(VueApexCharts) will make <apexchart> component available everywhere.
Props
Here are the basic props you can pass to the the <apexcharts> component| Prop | Description | Type | Default |
| type | The chart type which is a mandatory prop to specify | String | ‘line’ |
| series | The data which you want to display in the chart | Array | undefined |
| width | Width of the chart | String || Number | ‘100%’ |
| height | Height of the chart | String || Number | ‘auto’ |
| options | All the optional configuration of the chart goes in this property | Object | {} |
Usage
Once you have installed the library, you are ready to create a basic bar chart in vue.js. So, let’s get started.
Create the template part of the Vue component which is a mix of HTML and custom tags. The <apexchart> tag which you see below is the component which we will declare in the script part of the Vue component.
<template>
<div>
  <apexchart width="500" type="bar" :options="options" :series="series"></apexchart>
</div>
</template>
As you can see in the above template, the ApexCharts holds 4 props. Now, let’s jump to the JavaScript part.
Let’s write the script part of the Vue component. We will import VueApexCharts if we haven’t imported already and then define it globally using Vue.component() function so you can use it anywhere.
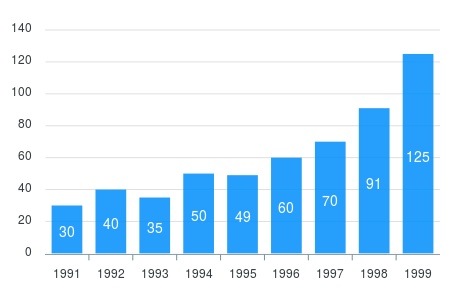
In the first example, we will start with a very basic bar chart.
import VueApexCharts from 'vue-apexcharts'

var app = new Vue({
  el: '#appl',
  data: function() {
    return {
      options: {
        chart: {
          id: 'vuechart-example'
        },
        xaxis: {
          categories: [1991, 1992, 1993, 1994, 1995, 1996, 1997, 1998]
        }
      },
      series: [{
        name: 'series-1',
        data: [30, 40, 45, 50, 49, 60, 70, 91]
      }]
    }
  }
});
This will render the following chart. To read more about the options you can configure in a bar chart, check out this plotOptions.bar configuration.
 Next, we create a simple line chart. To do so, just change the
 type property in the component props Line Chart
  <template>
    <div>
      <apexchart width="500" type="line" :options="options" :series="series"></apexchart>
    </div>
  </template>
This will generate the following line chart. 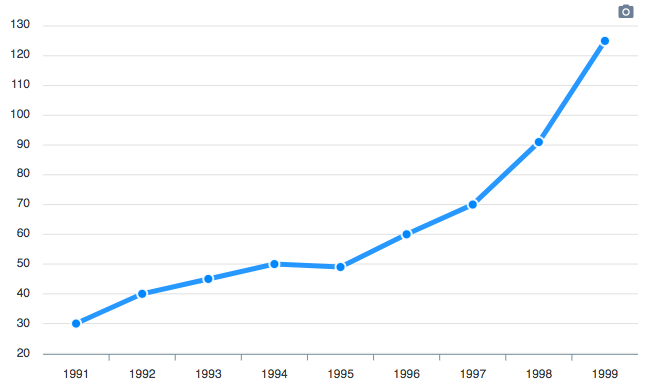
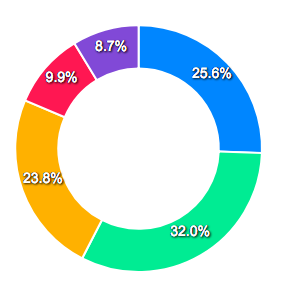
Now, we will create a donut chart with minimal configuration. To do so, change some of the options
Donut Chart
The donut chart accepts a single dimensional series array unlike other chart types. Try the below code.
  <template>
    <div>
      <apexchart width="380" type="donut" :options="options" :series="series"></apexchart>
    </div>
  </template>
var app = new Vue({
  el: '#appl',
  data: function() {
    return {
      options: {},
      series: [44, 55, 41, 17, 15]
    }
  }
});
And this is how the rendered donut chart will look like with the help of the above code.
In the next section, we will see how we can update the rendered chart dynamically
Updating Vue Chart Data
Updating your Vue chart data is simple. You just have to update the series props which you pass to the <apexchart> component and it will automatically trigger event to update the chart.
We will see an example below updating the chart data with some random series to illustrate the point.
import VueApexCharts from 'vue-apexcharts'

export default {
 name: 'Vue Chart',
 data: function () {
  return {
   chartOptions: {
    chart: {
      id: 'vuechart-example',
    },
    xaxis: {
      categories: [1991, 1992, 1993, 1994, 1995, 1996, 1997, 1998],
    },
   },
   series: [{
    name: 'Vue Chart',
    data: [30, 40, 45, 50, 49, 60, 70, 81]
   }]
  }
 },
 methods: {
  updateChart() {
   const max = 90;
   const min = 20;
   const newData = this.series[0].data.map(() => {
     return Math.floor(Math.random() * (max - min + 1)) + min
   })
   // In the same way, update the series option
   this.series = [{
    data: newData
   }]
  }
 }
}
As you can see in the example above, by just changing the props, we trigger the update event of ApexCharts.
Updating Vue Chart Options
You can also change chart options apart from changing chart data too. For eg, you may change the theme of the chart or change the legend position without affecting the data. See an example below which changes the theme of the chart.
methods: {
 updateTheme(e) {
  this.chartOptions = {
   theme: {
     palette: 'palette2'
   }
  }
 }
}
More Charts Examples?
There are several other charts which can be created by changing a couple of options. The major configuration has to be done in the options property of ApexCharts component and rest will fall into places.
View Vue Chart Demos