

App startup time is a critical metric for users, as it’s their first interaction with the app, and even minor improvements can have significant benefits for the user experience. First impressions are a big driver in consumer conversion, and startup times often indicate the app’s overall quality. Furthermore, other companies found that an increase in latency equals a decrease in sales.
At DoorDash, we take app startup speed extremely seriously. We are obsessed with optimizing our customers' experience and making continuous improvements.
In this article, we will explore three separate optimizations that reduced the time it took to launch our iOS consumer app by 60%. We identified these opportunities using proprietary performance tools, but Xcode instruments or DTrace could also be suitable alternatives.
Changing String(describing:) to ObjectIdentifier()
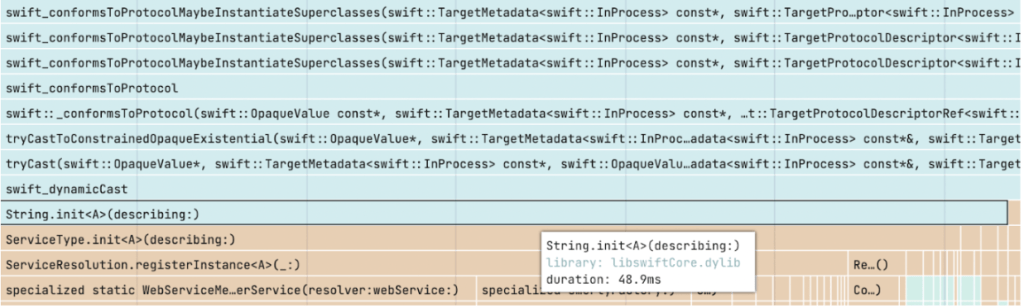
In early 2022, our app startup optimization journey began with visualizing top bottlenecks using Emerge Tools’ Performance Analysis tool, as seen in Figure 1.

This performance tool helped showcase unoptimized branches from both a birdseye and a detailed point-of-view. One of the biggest immediate standouts was the time we spent on Swift protocol conformance checks (checking if a type conforms to a protocol), but why?
Architectural principles like the single responsibility principle, separation of concerns, and others, are key to how we write code at DoorDash. Services and dependencies are often injected and described by their type. The problem is that we used String(describing:) to identify services, which came with a runtime performance penalty of checking if the type conforms to various other protocols. The stack trace in Figure 2 is taken directly from our app launch to showcase this.
The first question we asked ourselves was: “Do we really need a string to identify a type?”Eliminating the string requirement and switching to identifying types using ObjectIdentifier instead, which is a mere pointer to the type, yielded 11% faster app startup times. We also applied this technique to other areas where a pointer sufficed instead of a raw string, which yielded an additional 11% improvement.

If it’s possible to use a raw pointer to the type instead of using String(describing:) We recommend making the same change to save on the latency penalty.
Stop converting unnecessary objects to AnyHashable
At DoorDash, we encapsulate user actions, network requests, data mutations, and other computational workloads into (what we call) commands. For example, when we load a store menu, we submit that as a request to the command execution engine. The engine will then store the command in a processing array and perform the inbound commands sequentially. Structuring our operations this way is a key part of our new architecture, where we purposely isolate direct mutations and observe the results of expected actions instead.
This optimization began with rethinking how we identify commands and generate their hash value. Our processing array, and other dependencies, rely on a unique hash value to identify and separate the respective commands. Historically, we circumvented the need of having to think about hashing by using AnyHashable. However, as noted in the Swift standard, doing so was dangerous because relying on hash values given by AnyHashable could change between releases.
We could have chosen to optimize our hashing strategy in several ways, but we started by rethinking our original restrictions and bounds. Originally, the hash value of a command was a combination of its associated members. This decision had been made deliberately since we wanted to maintain a flexible and powerful abstraction of commands. But after an app-wide adoption of the new architecture, we noticed that the design choice was premature and overall left unused. Changing this requirement to identify commands by their type led to a 29% faster app launch, 55% faster command execution, and 20% faster registration of commands.

Auditing 3rd party framework initializers
At DoorDash, we strive to be free of third-party dependencies wherever possible. Still, there are times when a consumer's experience could greatly benefit from a third-party integration. Regardless, we conduct several rigorous audits of how third-party dependencies impact our service and the quality we uphold.
A recent audit found that a certain third-party framework caused our iOS application to launch roughly 200ms slower. This framework alone occupied roughly 40%(!) of our app launch time, as seen in Figure 3.

To make matters trickier, the framework in question was a key part of ensuring a positive consumer experience. So what can we do? How do we balance one aspect of the customer experience with fast app launch times?
Typically, a good approach is to start by moving any computationally expensive startup functions to a later part of the launch process and reevaluate from there. In our case, we only called or referenced classes in the framework much later in the process, but the framework was still blocking our launch time; why?
When an application starts up and loads into memory, the dynamic linker (dyld) is responsible for getting it ready. One of the steps of dyld is scanning through dynamically linked frameworks and calling any module initialization functions that it may have. dyld does this by looking for section types marked with 0x9 (S_MOD_INIT_FUNC_POINTERS), typically located in the “__DATA” segment.
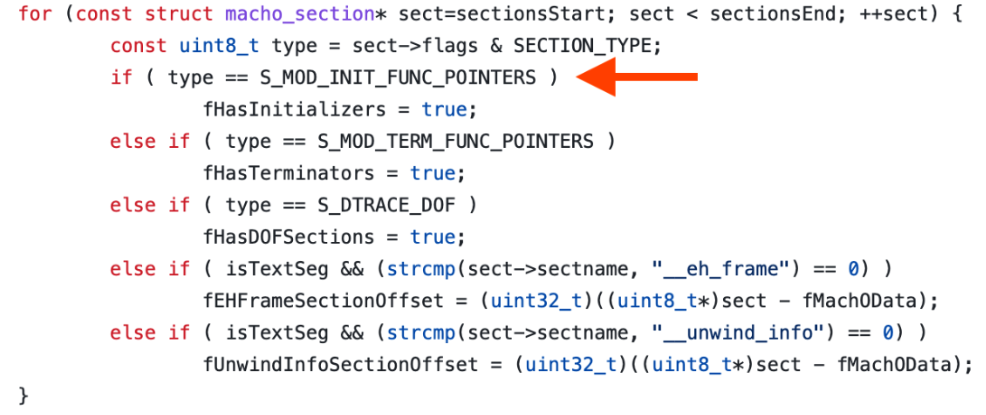
Once found, dyld sets a Boolean variable to true and calls the initializers in another phase shortly thereafter.
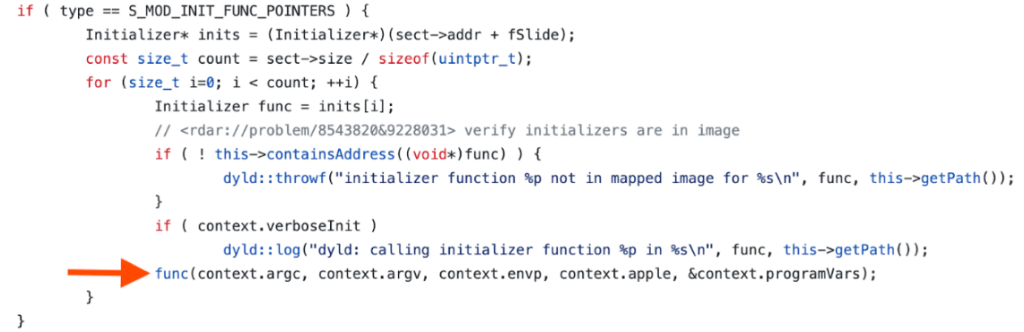
The third-party framework in question had a total of nine module initializers that all, because of dyld, were granted to run before our application ran main(). Those nine initializers attributed to the total cost that delayed our app launch. So how do we fix it?
There are several ways we could have gone about fixing the delay. A popular option is to use dlopen and write a wrapper interface for functions that have yet to be resolved. This method meant losing compiler safety, though, since the compiler could no longer reassure that a certain function would exist in the framework at compile time. This option has other cons, but compile safety meant the most to us.
We also contacted the third-party developers and asked them to convert the module initializer to a simple function we could instead call at our leisure. They, unfortunately, have yet to reply to us.
Instead, we went for a slightly different approach than publicly known methods. The idea was to trick dyld into thinking it is looking at a regular section and therefore skip calling the module initializers. Then, later at runtime, we would grab the base address of the framework with dladdr, and call the initializers at a known static offset. We would enforce this offset by validating the hash of the framework at compile time, verifying sections at runtime, and checking that the section flag had indeed been replaced. With these safety guards and an overall plan in mind, we successfully rolled out this optimization and yielded an additional 36% faster app startup.
Conclusion
Accurately identifying performance bottlenecks and opportunities is often the most challenging part of any optimization. Notoriously, a common mistake is to measure A, optimize B, and conclude C. That is where good performance tools help highlight bottlenecks and surface them. Xcode instruments, a part of Xcode, come with several templates to help pinpoint various potential issues in a macOS/iOS application. But for additional granularity and ease of use, Emerge Tools provides a simplified view of app performance with their performance tools.


 WayneCunningham


