Markets
The Top 100 Most Valuable Brands in 2024
![]() See this visualization first on the Voronoi app.
See this visualization first on the Voronoi app.
The Top 100 Most Valuable Brands in 2024
This was originally posted on our Voronoi app. Download the app for free on iOS or Android and discover incredible data-driven charts from a variety of trusted sources.
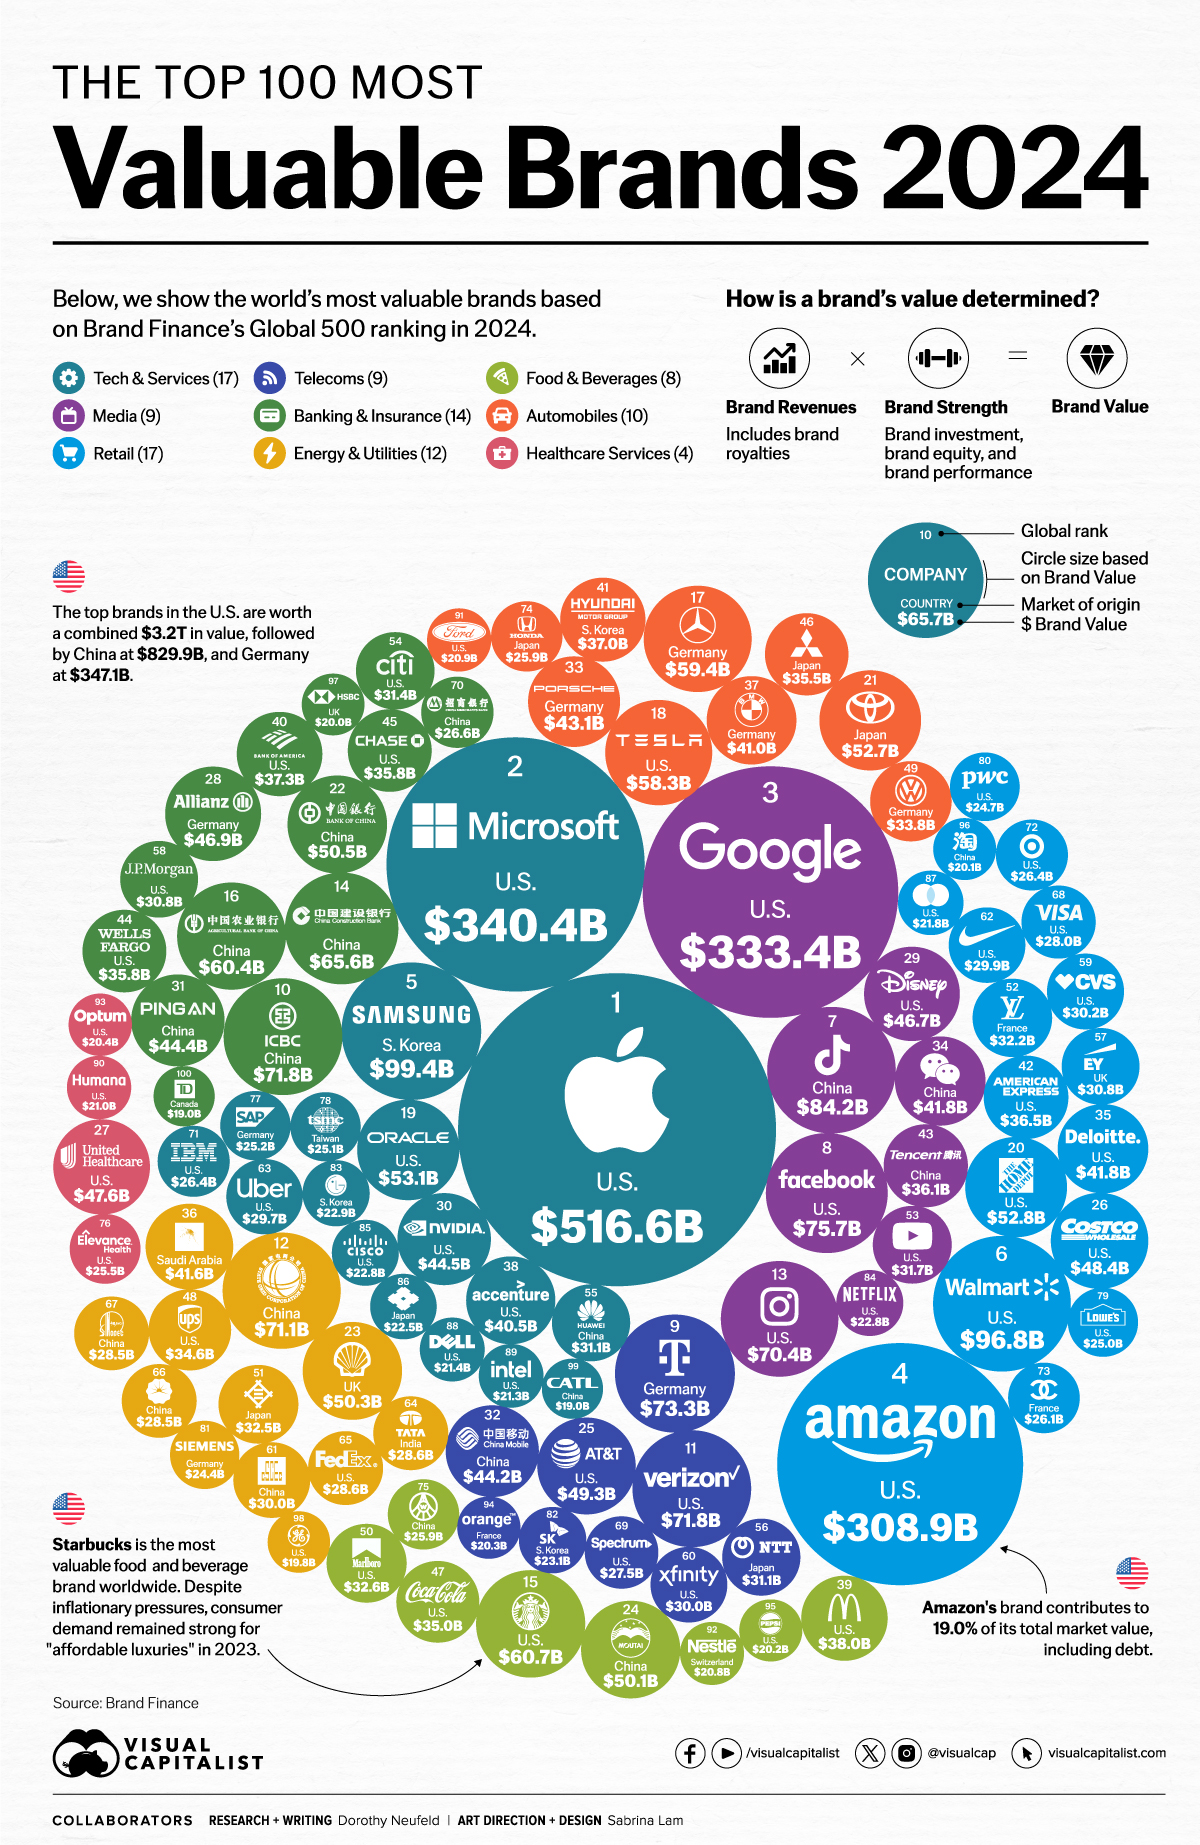
Together, the 100 most valuable brands in the world are worth more than $5 trillion.
Brands play an important role in driving shareholder value, yet pinpointing how much a brand is worth can be challenging. Investments in brand could pay dividends for many decades, but because those financial benefits are fairly open to interpretation, most financial regulators don’t usually accept brand assets on balance sheets.
To look at it another way, Apple is missing one of its most valuable assets on its financial reporting—a brand worth $516.6 billion.
This visualization ranks the top 100 brands by brand value, based on the annual global ranking from Brand Finance.
How Do You Value a Brand?
Overall, a brand’s value was calculated by the degree that it generated profits for the company. Brand Finance analyzed individual companies along with their subsidiaries, like in the case of Meta which owns Instagram and WhatsApp.
More details on the methodology can be found at the end of this article.
Ranking the Top Brands, by Value
Here are the most valuable brands globally in 2024:
| Ranking 2024 | Name | Country | Value | Annual Change |
|---|---|---|---|---|
| 1 | Apple | 🇺🇸 U.S. | $516.6B | +73.6% |
| 2 | Microsoft | 🇺🇸 U.S. | $340.4B | +77.7% |
| 3 | 🇺🇸 U.S. | $333.4B | +18.5% | |
| 4 | Amazon | 🇺🇸 U.S. | $308.9B | +3.2% |
| 5 | Samsung Group | 🇰🇷 South Korea | $99.4B | -0.3% |
| 6 | Walmart | 🇺🇸 U.S. | $96.8B | -14.9% |
| 7 | TikTok/Douyin | 🇨🇳 China | $84.2B | +28.2% |
| 8 | 🇺🇸 U.S. | $75.7B | +28.4% | |
| 9 | Deutsche Telekom | 🇩🇪 Germany | $73.3B | +16.5% |
| 10 | ICBC | 🇨🇳 China | $71.8B | +3.3% |
| 11 | Verizon | 🇺🇸 U.S. | $71.8B | +6.4% |
| 12 | State Grid Corporation of China | 🇨🇳 China | $71.1B | +20.9% |
| 13 | 🇺🇸 U.S. | $70.4B | +48.5% | |
| 14 | China Construction Bank | 🇨🇳 China | $65.6B | +4.7% |
| 15 | Starbucks | 🇺🇸 U.S. | $60.7B | +13.5% |
| 16 | Agricultural Bank Of China | 🇨🇳 China | $60.4B | +4.7% |
| 17 | Mercedes-Benz | 🇩🇪 Germany | $59.4B | +1.1% |
| 18 | Tesla | 🇺🇸 U.S. | $58.3B | -12.0% |
| 19 | Oracle | 🇺🇸 U.S. | $53.1B | +34.2% |
| 20 | Home Depot | 🇺🇸 U.S. | $52.8B | -13.6% |
| 21 | Toyota | 🇯🇵 Japan | $52.7B | +0.3% |
| 22 | Bank of China | 🇨🇳 China | $50.5B | +6.6% |
| 23 | Shell | 🇬🇧 UK | $50.3B | +4.3% |
| 24 | Moutai | 🇨🇳 China | $50.1B | +0.7% |
| 25 | AT&T | 🇺🇸 U.S. | $49.3B | -0.7% |
| 26 | Costco | 🇺🇸 U.S. | $48.4B | +3.9% |
| 27 | UnitedHealthcare | 🇺🇸 U.S. | $47.6B | +28.4% |
| 28 | Allianz Group | 🇩🇪 Germany | $46.9B | -3.0% |
| 29 | Disney | 🇺🇸 U.S. | $46.7B | -5.6% |
| 30 | Nvidia | 🇺🇸 U.S. | $44.5B | +162.9% |
| 31 | Ping An | 🇨🇳 China | $44.4B | -0.7% |
| 32 | China Mobile | 🇨🇳 China | $44.2B | +2.0% |
| 33 | Porsche | 🇩🇪 Germany | $43.1B | +17.3% |
| 34 | 🇨🇳 China | $41.8B | -16.8% | |
| 35 | Deloitte | 🇺🇸 U.S. | $41.8B | +21.0% |
| 36 | Aramco | 🇸🇦 Saudi Arabia | $41.6B | -8.1% |
| 37 | BMW | 🇩🇪 Germany | $41.0B | +1.5% |
| 38 | accenture | 🇮🇪 Ireland | $40.5B | +1.6% |
| 39 | McDonald's | 🇺🇸 U.S. | $38.0B | +3.1% |
| 40 | Bank of America | 🇺🇸 U.S. | $37.3B | -3.6% |
| 41 | Hyundai Group | 🇰🇷 South Korea | $37.0B | +35.6% |
| 42 | American Express | 🇺🇸 U.S. | $36.5B | +7.0% |
| 43 | Tencent | 🇨🇳 China | $36.1B | -5.3% |
| 44 | Wells Fargo | 🇺🇸 U.S. | $35.8B | +8.6% |
| 45 | Chase | 🇺🇸 U.S. | $35.8B | +14.3% |
| 46 | Mitsubishi Group | 🇯🇵 Japan | $35.5B | +1.7% |
| 47 | Coca-Cola | 🇺🇸 U.S. | $35.0B | +4.6% |
| 48 | UPS | 🇺🇸 U.S. | $34.6B | -2.4% |
| 49 | Volkswagen | 🇩🇪 Germany | $33.8B | -0.5% |
| 50 | Marlboro | 🇺🇸 U.S. | $32.6B | -6.3% |
| 51 | Mitsui | 🇯🇵 Japan | $32.5B | +5.8% |
| 52 | Louis Vuitton | 🇫🇷 France | $32.2B | +22.6% |
| 53 | YouTube | 🇺🇸 U.S. | $31.7B | +6.8% |
| 54 | Citi | 🇺🇸 U.S. | $31.4B | +2.8% |
| 55 | Huawei | 🇨🇳 China | $31.1B | -29.8% |
| 56 | NTT Group | 🇯🇵 Japan | $31.1B | -15.1% |
| 57 | EY | 🇬🇧 UK | $30.8B | +20.0% |
| 58 | J.P. Morgan | 🇺🇸 U.S. | $30.8B | -3.3% |
| 59 | CVS | 🇺🇸 U.S. | $30.2B | -1.1% |
| 60 | Xfinity | 🇺🇸 U.S. | $30.0B | +4.5% |
| 61 | CSCEC | 🇨🇳 China | $30.0B | -6.1% |
| 62 | Nike | 🇺🇸 U.S. | $29.9B | -4.6% |
| 63 | Uber | 🇺🇸 U.S. | $29.7B | +27.6% |
| 64 | Tata Group | 🇮🇳 India | $28.6B | +8.5% |
| 65 | FedEx | 🇺🇸 U.S. | $28.6B | -1.0% |
| 66 | PetroChina | 🇨🇳 China | $28.5B | -3.9% |
| 67 | Sinopec Group | 🇨🇳 China | $28.5B | +4.9% |
| 68 | VISA | 🇺🇸 U.S. | $28.0B | -5.4% |
| 69 | Spectrum | 🇺🇸 U.S. | $27.5B | +17.8% |
| 70 | China Merchants Bank | 🇨🇳 China | $26.6B | +8.6% |
| 71 | IBM Group | 🇺🇸 U.S. | $26.4B | +0.9% |
| 72 | Target | 🇺🇸 U.S. | $26.4B | -4.5% |
| 73 | Chanel | 🇫🇷 France | $26.1B | +34.5% |
| 74 | Honda | 🇯🇵 Japan | $25.9B | +7.1% |
| 75 | Wuliangye | 🇨🇳 China | $25.9B | -14.5% |
| 76 | Elevance Health | 🇺🇸 U.S. | $25.5B | +28.4% |
| 77 | SAP | 🇩🇪 Germany | $25.2B | +19.3% |
| 78 | TSMC | 🇹🇼 Taiwan | $25.1B | +16.2% |
| 79 | Lowe's | 🇺🇸 U.S. | $25.0B | -20.8% |
| 80 | PWC | 🇺🇸 U.S. | $24.7B | -2.6% |
| 81 | Siemens Group | 🇩🇪 Germany | $24.4B | +13.9% |
| 82 | SK Group | 🇰🇷 South Korea | $23.1B | +2.5% |
| 83 | LG Group | 🇰🇷 South Korea | $22.9B | +7.7% |
| 84 | Netflix | 🇺🇸 U.S. | $22.8B | -5.5% |
| 85 | Cisco | 🇺🇸 U.S. | $22.8B | -4.8% |
| 86 | Sumitomo Group | 🇯🇵 Japan | $22.5B | -5.9% |
| 87 | Mastercard | 🇺🇸 U.S. | $21.8B | -12.2% |
| 88 | Dell Technologies | 🇺🇸 U.S. | $21.4B | -5.2% |
| 89 | Intel | 🇺🇸 U.S. | $21.3B | -7.3% |
| 90 | Humana | 🇺🇸 U.S. | $21.0B | +27.1% |
| 91 | Ford | 🇺🇸 U.S. | $20.9B | -6.1% |
| 92 | Nestlé | 🇨🇭 Switzerland | $20.8B | -7.4% |
| 93 | Optum | 🇺🇸 U.S. | $20.4B | +1.2% |
| 94 | Orange | 🇫🇷 France | $20.3B | +10.2% |
| 95 | Pepsi | 🇺🇸 U.S. | $20.2B | +10.2% |
| 96 | Taobao | 🇨🇳 China | $20.1B | -34.0% |
| 97 | HSBC | 🇬🇧 UK | $20.0B | +1.0% |
| 98 | General Electric | 🇺🇸 U.S. | $19.8B | +2.2% |
| 99 | CATL | 🇨🇳 China | $19.0B | +29.4% |
| 100 | TD | 🇨🇦 Canada | $19.0B | -7.1% |
Ranking first overall, the value of Apple’s brand has ballooned by over $217 billion since last year’s ranking.
While iPhone sales have plateaued, the company has been expanding its product lines from wearables to Apple TV. Over 50% of people surveyed by Brand Finance said that their products were worth the price, even though it was expensive.
On the other hand, Tesla’s brand value sank to $58.3 billion, dropping out of the top 10 since last year. This came as new and more affordable electric vehicle (EV) makers saw increasing sales, notably BYD. Supported by strong demand in China’s market, BYD became the world’s bestselling EV company in 2023. In fact, over a third of new cars sold in the country were EVs.
The Fastest Growing Brands
Which brands jumped the most in value?
| Brand | Change in Ranking 2023-2024 | Change in Brand Value |
|---|---|---|
| Nvidia | +87 | +162.9% |
| CATL | +36 | +29.4% |
| Humana | +32 | +27.1% |
| Hyundai Group | +26 | +35.6% |
| Chanel | +25 | +34.5% |
| Elevance Health | +19 | +28.4% |
| Louis Vuitton | +18 | +22.6% |
| Uber | +18 | +27.6% |
| Oracle | +16 | +34.2% |
| EY | +15 | +20.0% |
Nvidia’s brand value soared as investors flocked to AI stocks and demand for memory chips accelerated.
For perspective, tens of thousands of chips are needed for AI models to run in order to simultaneously calculate computational tasks. The company joined the $1 trillion market cap club in late January 2024—the fifth company to do this ever. Not only that, it is worth more than Netflix, Tesla, and Walmart combined.
Most Valuable Brands: U.S. Leads the Pack
In 2024, more than half of the 100 most valuable brands are based in the United States, with a combined value of $3.2 trillion.
| Country | Top 100 Total Brand Value | Number of Brands |
|---|---|---|
| 🇺🇸 U.S. | $3,241.0B | 51 |
| 🇨🇳 China | $829.9B | 19 |
| 🇩🇪 Germany | $347.1B | 8 |
| 🇯🇵 Japan | $200.2B | 6 |
| 🇰🇷 South Korea | $182.4B | 4 |
| 🇬🇧 UK | $101.1B | 3 |
| 🇫🇷 France | $78.6B | 3 |
| 🇸🇦 Saudi Arabia | $41.6B | 1 |
| 🇮🇪 Ireland | $40.5B | 1 |
| 🇮🇳 India | $28.6B | 1 |
| 🇹🇼 Taiwan | $25.1B | 1 |
| 🇨🇭 Switzerland | $20.8B | 1 |
| 🇨🇦 Canada | $19.0B | 1 |
China has the second-highest number of companies on the ranking, with TikTok as its most valuable brand, worth $84.2 billion. Interestingly, many of China’s most valuable brands are heavily concentrated in the financial sector.
As a rising economic powerhouse, India’s most valuable brand is Tata Group.
The conglomerate, founded in 1868, spans across 30 companies in multiple sectors, from technology and manufacturing to automotive and steel. Its subsidiary, Tata Technologies, is scheduled to IPO in late 2024 with a $2.5 billion valuation.
With 245 million mobile customers in over 50 countries, Germany’s Deutsche Telekom is the most valuable in Europe, overtaking Verizon as the most valuable telecom brand globally.
Where does this data come from?
Source: Brand Finance Global 500 Report
Important note: The values shown above are brand value calculations as opposed to market capitalization. See below for more details.
How is brand value calculated? Generally speaking, the methodology for calculating “brand value” is a formula that is as follows:
Brand Strength (BSI) x Brand Royalty Rate x Brand Revenues = Brand Value
Brand Strength Index (BSI) looks at brand investment, brand equity, and brand performance. The brand royalty rate is determined based on sector. Lastly, forecast brand-specific revenues are determined based on the proportion of parent company revenues attributable to the brand in question. Brand value itself is discounted to net present value.


Markets
Mapped: Europe’s GDP Per Capita, by Country
Which European economies are richest on a GDP per capita basis? This map shows the results for 44 countries across the continent.


Mapped: Europe’s GDP Per Capita, by Country (2024)
This was originally posted on our Voronoi app. Download the app for free on iOS or Android and discover incredible data-driven charts from a variety of trusted sources.
Europe is home to some of the largest and most sophisticated economies in the world. But how do countries in the region compare with each other on a per capita productivity basis?
In this map, we show Europe’s GDP per capita levels across 44 nations in current U.S. dollars. Data for this visualization and article is sourced from the International Monetary Fund (IMF) via their DataMapper tool, updated April 2024.
Europe’s Richest and Poorest Nations, By GDP Per Capita
Luxembourg, Ireland, and Switzerland, lead the list of Europe’s richest nations by GDP per capita, all above $100,000.
| Rank | Country | GDP Per Capita (2024) |
|---|---|---|
| 1 | 🇱🇺 Luxembourg | $131,380 |
| 2 | 🇮🇪 Ireland | $106,060 |
| 3 | 🇨🇭 Switzerland | $105,670 |
| 4 | 🇳🇴 Norway | $94,660 |
| 5 | 🇮🇸 Iceland | $84,590 |
| 6 | 🇩🇰 Denmark | $68,900 |
| 7 | 🇳🇱 Netherlands | $63,750 |
| 8 | 🇸🇲 San Marino | $59,410 |
| 9 | 🇦🇹 Austria | $59,230 |
| 10 | 🇸🇪 Sweden | $58,530 |
| 11 | 🇧🇪 Belgium | $55,540 |
| 12 | 🇫🇮 Finland | $55,130 |
| 13 | 🇩🇪 Germany | $54,290 |
| 14 | 🇬🇧 UK | $51,070 |
| 15 | 🇫🇷 France | $47,360 |
| 16 | 🇦🇩 Andorra | $44,900 |
| 17 | 🇲🇹 Malta | $41,740 |
| 18 | 🇮🇹 Italy | $39,580 |
| 19 | 🇨🇾 Cyprus | $37,150 |
| 20 | 🇪🇸 Spain | $34,050 |
| 21 | 🇸🇮 Slovenia | $34,030 |
| 22 | 🇪🇪 Estonia | $31,850 |
| 23 | 🇨🇿 Czech Republic | $29,800 |
| 24 | 🇵🇹 Portugal | $28,970 |
| 25 | 🇱🇹 Lithuania | $28,410 |
| 26 | 🇸🇰 Slovakia | $25,930 |
| 27 | 🇱🇻 Latvia | $24,190 |
| 28 | 🇬🇷 Greece | $23,970 |
| 29 | 🇭🇺 Hungary | $23,320 |
| 30 | 🇵🇱 Poland | $23,010 |
| 31 | 🇭🇷 Croatia | $22,970 |
| 32 | 🇷🇴 Romania | $19,530 |
| 33 | 🇧🇬 Bulgaria | $16,940 |
| 34 | 🇷🇺 Russia | $14,390 |
| 35 | 🇹🇷 Türkiye | $12,760 |
| 36 | 🇲🇪 Montenegro | $12,650 |
| 37 | 🇷🇸 Serbia | $12,380 |
| 38 | 🇦🇱 Albania | $8,920 |
| 39 | 🇧🇦 Bosnia & Herzegovina | $8,420 |
| 40 | 🇲🇰 North Macedonia | $7,690 |
| 41 | 🇧🇾 Belarus | $7,560 |
| 42 | 🇲🇩 Moldova | $7,490 |
| 43 | 🇽🇰 Kosovo | $6,390 |
| 44 | 🇺🇦 Ukraine | $5,660 |
| N/A | 🇪🇺 EU Average | $44,200 |
Note: Figures are rounded.
Three Nordic countries (Norway, Iceland, Denmark) also place highly, between $70,000-90,000. Other Nordic peers, Sweden and Finland rank just outside the top 10, between $55,000-60,000.
Meanwhile, Europe’s biggest economies in absolute terms, Germany, UK, and France, rank closer to the middle of the top 20, with GDP per capitas around $50,000.
Finally, at the end of the scale, Eastern Europe as a whole tends to have much lower per capita GDPs. In that group, Ukraine ranks last, at $5,660.
A Closer Look at Ukraine
For a broader comparison, Ukraine’s per capita GDP is similar to Iran ($5,310), El Salvador ($5,540), and Guatemala ($5,680).
According to experts, Ukraine’s economy has historically underperformed to expectations. After the fall of the Berlin Wall, the economy contracted for five straight years. Its transition to a Western, liberalized economic structure was overshadowed by widespread corruption, a limited taxpool, and few revenue sources.
Politically, its transformation from authoritarian regime to civil democracy has proved difficult, especially when it comes to institution building.
Finally, after the 2022 invasion of the country, Ukraine’s GDP contracted by 30% in a single year—the largest loss since independence. Large scale emigration—to the tune of six million refugees—is also playing a role.
Despite these challenges, the country’s economic growth has somewhat stabilized while fighting continues.

-

 Markets6 days ago
The World’s Fastest Growing Emerging Markets (2024-2029 Forecast)
-

 Technology2 weeks ago
All of the Grants Given by the U.S. CHIPS Act
-

 Green2 weeks ago
The Carbon Footprint of Major Travel Methods
-

 United States2 weeks ago
Visualizing the Most Common Pets in the U.S.
-

 Culture2 weeks ago
The World’s Top Media Franchises by All-Time Revenue
-

 Visual Capitalist1 week ago
Best Visualizations of April on the Voronoi App
-

 Wealth1 week ago
Charted: Which Country Has the Most Billionaires in 2024?
-

 Markets1 week ago
The Top Private Equity Firms by Country