WebIDE, Storage inspector, jQuery events, iframe switcher + more – Firefox Developer Tools Episode 34

A new set of Firefox Developer Tools features has just been uplifted to the Aurora channel. These features are available right now in Aurora, and will be in the Firefox 34 release in November. This release brings new tools (storage inspector, WebIDE), an updated profiler, and handy enhancements to the existing tools:

WebIDE

WebIDE, a new tool for in-browser app development, has been enabled by default in this release. WebIDE lets you create a new Firefox OS app (which is just a web app) from a template, or open up the code for an already created app. From there you can edit the app’s files. It’s one click to run the app in a simulator and one more to debug it with the developer tools. Open WebIDE from Firefox’s “Web Developer” menu. (docs)
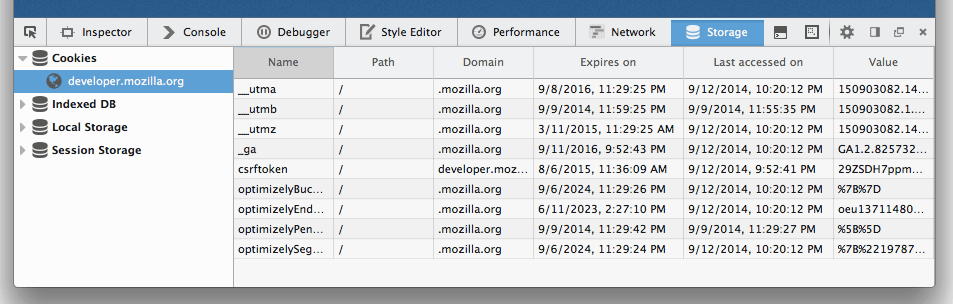
Storage inspector

There’s a new panel that shows the data your page has stored in cookies, localStorage, sessionStorage, and IndexedDB, which was created mostly by Girish Shama. Enable the Storage panel by checking off Settings > “Default Developer Tools” > “Storage”. The panel is read-only right now, with editing ability planned for a future release. (docs) (development notes) (UserVoice request)
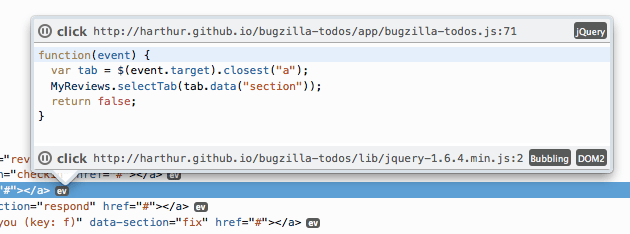
storage inspector

jQuery events

The event listener popup in the Inspector now supports jQuery. This means the popup will display the function you attached with e.g. jQuery.on(), and not the jQuery wrapper function itself. See this post for more info and how to add support for your preferred framework. (development notes)
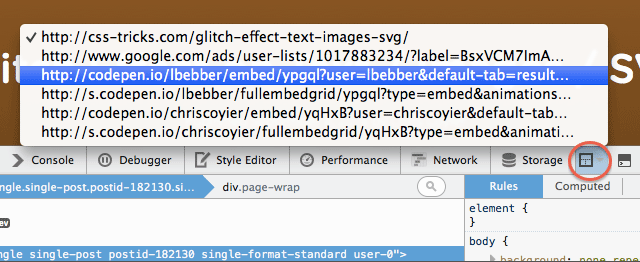
JQuery events

Iframe switcher

Change the frame you’re debugging using the new frame selection menu. Selecting a frame will switch all of the tools to debug that iframe, including the Inspector, Console, and Debugger. Add the frame selection button by checking off Settings > “Available Toolbox Buttons” > “Select an iframe”. (docs) (development notes)(UserVoice request)
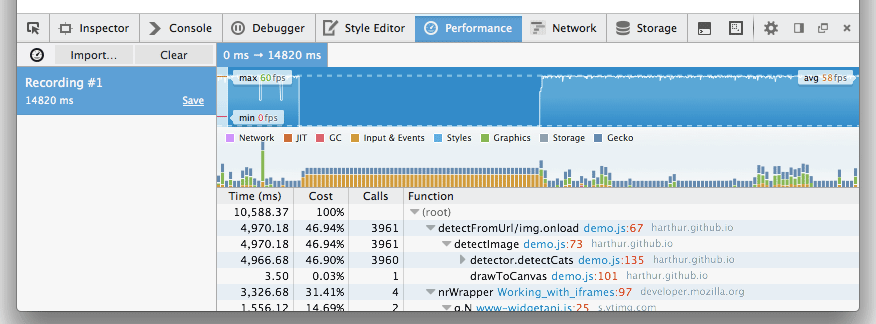
iframe selection

Updated profiler

An updated JavaScript profiler appears in the new “Performance” tab (formerly the “Profiler” tab). New to the profiler are a frame rate timeline and categories for frames like “network” and “graphics”. (docs) (development notes)
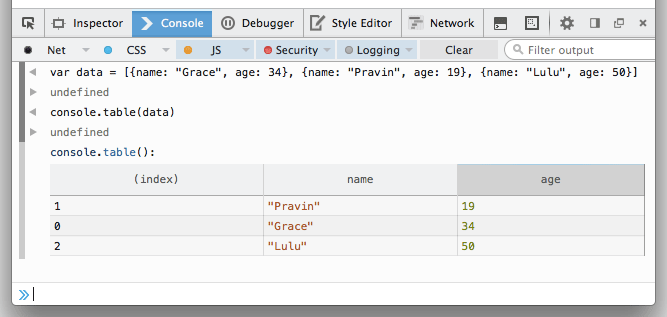
new profiler

console.table()

Add a call to console.table() anywhere in your JavaScript to log data to the console using a table-like display. Log any object, array, Map, or Set. Sort a column in the table by clicking on its header. (docs) (development notes)
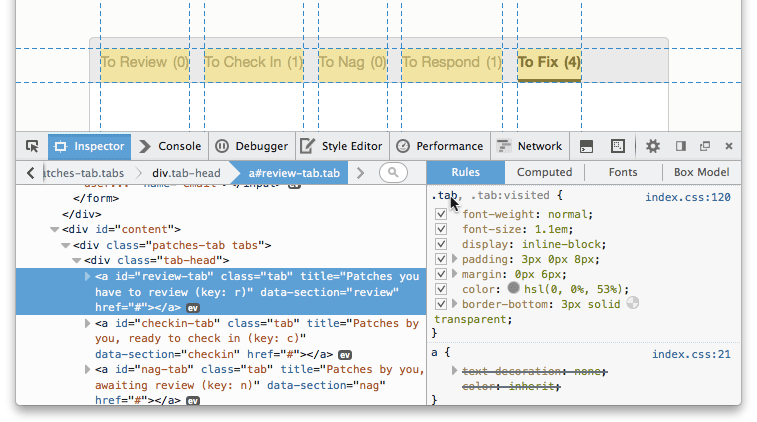
console.table

Selector preview

Hover over a CSS selector in the Inspector or Style Editor to highlight all the nodes that match that selector on the page. (development notes)

selector previews

Other mentions

  • Persistent split console – The split console (opened by pressing ESC) will now open with the tools if you had it open the last time the tools were closed. (development notes)
  • Web audio – AudioParam connections – the Web Audio Editor now displays connections from AudioNodes to AudioParams. (development notes)

Special thanks to the 41 contributors that added all the features and fixes in this release.

Comment here, shoot feedback to @FirefoxDevTools on Twitter, or propose changes on the Developer Tools feedback channel. If you’d like to help out, check out the guide to getting involved.

About Heather Arthur

Firefox developer tools developer at Mozilla, working mainly on the style tools.

More articles by Heather Arthur…

About Robert Nyman [Editor emeritus]

Technical Evangelist & Editor of Mozilla Hacks. Gives talks & blogs about HTML5, JavaScript & the Open Web. Robert is a strong believer in HTML5 and the Open Web and has been working since 1999 with Front End development for the web - in Sweden and in New York City. He regularly also blogs at http://robertnyman.com and loves to travel and meet people.

More articles by Robert Nyman [Editor emeritus]…


35 comments

  1. derp

    **** ****!
    Editor’s note: this comment expressed exuberance over the Developer Tools, but the language was unfortunately not suitable for publishing

    September 16th, 2014 at 12:22

    1. tmnt

      perhaps you meant: sacred ******?
      Editors note: removed a word that wasn’t necessarily bad, but would just distract from the content here. Let’s just say we’re happy with the updates!

      September 16th, 2014 at 13:48

  2. Christoph

    This is all good progress and such, but please have a look at https://developer.chrome.com/devtools/docs/workspaces and notice the slow / inefficient / inconvenient workflow of WebIDE.

    Try that out in chrome and you won’t be ably to justify working inside firefox any longer because then you are just so much slower.

    other than that i wanted to add that i kinda hate all these ide in the browser / web projects: i already have to remember slightly different shortcuts for a number of text editors and in those web editors it gets even worse because ofthe shortcuts can’t be changed =( and often the editors themself are very basic too (to somebody that uses eclipse, vim, Visual Studio)

    Good progress, keep up the good work!
    Thank you

    September 16th, 2014 at 14:53

    1. Robert Nyman [Editor]

      Thanks for the feedback! Any ideas you might have to make the Developer Tools better, please add your idea!

      On the topic of keyboard shortcuts, we also support Vim, Emacs and Sublime text keybindings.

      September 17th, 2014 at 00:02

  3. aeischeid

    Good work guys! That storage inpector especially is going to come in very handy for me.

    September 16th, 2014 at 15:15

    1. Robert Nyman [Editor]

      Thanks, good to hear!

      September 17th, 2014 at 00:03

  4. thevasya

    Can’t decide which one is my favorite. Thanks for all the hard work!

    September 16th, 2014 at 21:40

    1. Robert Nyman [Editor]

      Thank you, that’s a nice problem to have!

      September 17th, 2014 at 00:03

  5. Noitidart

    we need to add to the css inspector ability to create properties to the pseduo elements if it wasnt there before

    September 17th, 2014 at 08:22

    1. Robert Nyman [Editor]

      Please try the Developer Tools, and if you believe something is missing, please suggest it to us in our feedback channel.

      September 25th, 2014 at 12:49

  6. Jerry Voelker

    Great work!

    I am very excited about the Storage Inspector addition. I frequently have support tickets related to browser cache and cookies, and this should help troubleshooting immensely. Telling users to press Ctrl-F5 (or use a private browsing session in some cases) is a quick-fix that we would like to get away from.

    September 17th, 2014 at 11:20

    1. Robert Nyman [Editor]

      Thanks, glad you like it!

      September 25th, 2014 at 12:49

  7. David Frank

    Great stuff!

    Just wondering, the performance tab will work with latest Firefox Aurora on android for remote debugging right?

    September 19th, 2014 at 02:01

    1. Mark Finkle

      Yes! The new tools work with Firefox for Android too. Just remotely connect.

      September 22nd, 2014 at 20:53

  8. Sunng

    Good! Is there any schedule to web socket inspector?

    September 21st, 2014 at 23:21

    1. Joe Walker

      We don’t have a date, but we know about it being missing, sorry I can’t be more detailed.

      September 23rd, 2014 at 11:58

    2. Robert Nyman [Editor]

      Feel free to add the idea to the feedback channel/vote for it, since we have no such suggestion at the moment.

      September 25th, 2014 at 12:54

  9. ff user

    You do all this stuff for app and mobile development, yet one of the most important and easiest things to do is still missing: Proper management of user agents and being able to set them per tab. Developing anything that requires changing the user agent is a freaking pain with Firefox.

    September 22nd, 2014 at 01:18

    1. Robert Nyman [Editor]

      In general, basing your code on user agent detection is far from recommended (we’ve elaborated in detail on this in User-Agent detection, history and checklist). That said, you are more than welcome to suggest the functionality you want and we can prioritize that vs. other ideas.

      September 25th, 2014 at 12:52

  10. Eric

    websockets inspector, pleeeeeeeeease

    September 22nd, 2014 at 02:07

    1. Robert Nyman [Editor]

      Feel free to add the idea to the feedback channel/vote for it, since we have no such suggestion at the moment.

      September 25th, 2014 at 12:55

  11. mie

    I am looking forward to a new element inspector UI because after switching from classic Firefox UI to Australis it became almost unusable: button for switching between normal mouse pointer and element selector is difficult to find at first sight; mouse hovering over elements has an unpredictable behavior (different from what it used to be); in-place editing or selecting element properties also got an odd new behavior.

    But you guys are definitely great, I love Firefox developer tools, I am sure the release will be above expectations!

    September 22nd, 2014 at 04:41

    1. Robert Nyman [Editor]

      Thanks! Constantly working on making it better. :-)

      September 25th, 2014 at 12:55

  12. wazoo

    Great stuff, the storage inspector is a real welcome addition!

    +1 on the websockets inspector.

    September 22nd, 2014 at 08:36

    1. Robert Nyman [Editor]

      Thanks! Also, since we have no Web Sockets inspector suggestion, add the idea to the feedback channel/vote for it.

      September 25th, 2014 at 12:56

  13. Davos Seaworth LordOfTheRainwood

    I want this now!

    September 22nd, 2014 at 12:46

  14. mehmet yilmaz

    Congrats you’ve won a web developer working on firefox instead of chrome. But mozilla needs a Websocket inspector + local file support

    September 23rd, 2014 at 01:42

    1. Robert Nyman [Editor]

      Glad you like it! On Web Socket inspector, feel free to add the idea to the feedback channel/vote for it, since we have no such suggestion at the moment.

      September 25th, 2014 at 12:57

  15. Rob

    Isn’t it a little bizarre for a browser to support a library in dev tools? I know a lot of people like jQuery but it’s just another javascript library so I don’t get that.

    September 23rd, 2014 at 05:13

    1. Joe Walker

      The trouble is that visual events is close to useless to jQuery websites without this feature, so we added. Generally though we’d like to support 3rd party libraries through add-ons.

      September 23rd, 2014 at 12:03

  16. Michael Niemann

    I like all these dev tools coming down the pike. One question/request. I’d like to increase the font size in WebIDE. My eyes aren’t what they were. Is that possible?

    September 23rd, 2014 at 08:31

    1. J. Ryan Stinnett

      While debugging a project with the toolbox focused, you can use Cmd / Ctrl + +/- to adjust the font size. See also some [other toolbox shortcuts](https://developer.mozilla.org/en-US/docs/Tools/Keyboard_shortcuts#Toolbox).

      For the rest of WebIDE (including the code editor), we don’t have support for it yet, but we’d like to add it for sure. Check out [bug 1027817](https://bugzil.la/1027817) about this. In particular, there is some discussion about how exactly it should work, so feel free to add your own thoughts!

      September 23rd, 2014 at 13:36

    2. thinsoldier

      With the inspector focused just press [ctrl +] or [cmd +]

      September 24th, 2014 at 07:43

      1. thinsoldier

        Sorry, I just realized you said WebIDE.

        September 24th, 2014 at 07:44

  17. mario

    thanks for the hard work

    October 14th, 2014 at 15:53

Comments are closed for this article.