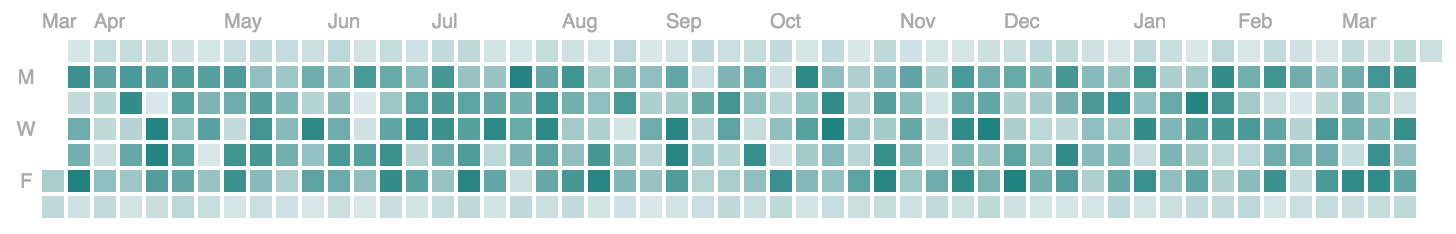
The github style inspired calendar-heatmap capsuled as an easy to use vue.js component
A d3.js heatmap representing time series data. Inspired by Github's contribution chart
# 1. Install Vuejs heatmap
npm install --save vuejs-heatmap

# 2. Import
import VuejsHeatmap from 'vuejs-heatmap'

# 3. Use
<vuejs-heatmap></vuejs-heatmap>
Any string which should be the selector, use it for multiple heatmaps on one site.
'myFirstSelector'
[
  {
    "counting": 2070,
    "created_at": "2018-06-21"
  },
  {
    "counting": 3493,
    "created_at": "2018-06-22"
  }
]
['#c9ecec', '#09b3af']
true/false
'Star'
{
  months: ['Jan', 'Feb', 'Mar', 'Apr', 'May', 'Jun', 'Jul', 'Aug', 'Sep', 'Oct', 'Nov', 'Dec'],
  days: ['S', 'M', 'T', 'W', 'T', 'F', 'S'],
  No: 'No',
  on: 'on',
  Less: 'Less',
  More: 'More'
}
Any number which should be the max color.
A function that should be called if clicked, will receive an object as first parameter:
{
  count: 123,
  date: DateObject,
  entry: {
    counting: 123,
    created_at: "2018-01-24"
    // every property you pass in your entries.
  }
}
# install dependencies
npm install

# serve with hot reload at localhost:8080
npm run dev

# build for production with minification
npm run build

# build for production and view the bundle analyzer report
npm run build --report
For detailed explanation on how things work, checkout the guide and docs for vue-loader.