The bi-annual CNCF survey takes a pulse of the community to better understand the adoption of cloud native technologies. This is the sixth time CNCF has taken the temperature of the container management marketplace.
Key takeaways
- Production usage of CNCF projects has grown more than 200% on average since December 2017, and evaluation has jumped 372%.
- The use of serverless technology continues to grow, up 22% since December 2017 with the majority of respondents using hosted platforms such as AWS Lambda (70%).
- The top three benefits of cloud native technology are faster deployment time, improved scalability, and cloud portability.
- 40% of respondents from enterprise companies (5000+) are running Kubernetes in production.
About the survey methodology & respondents
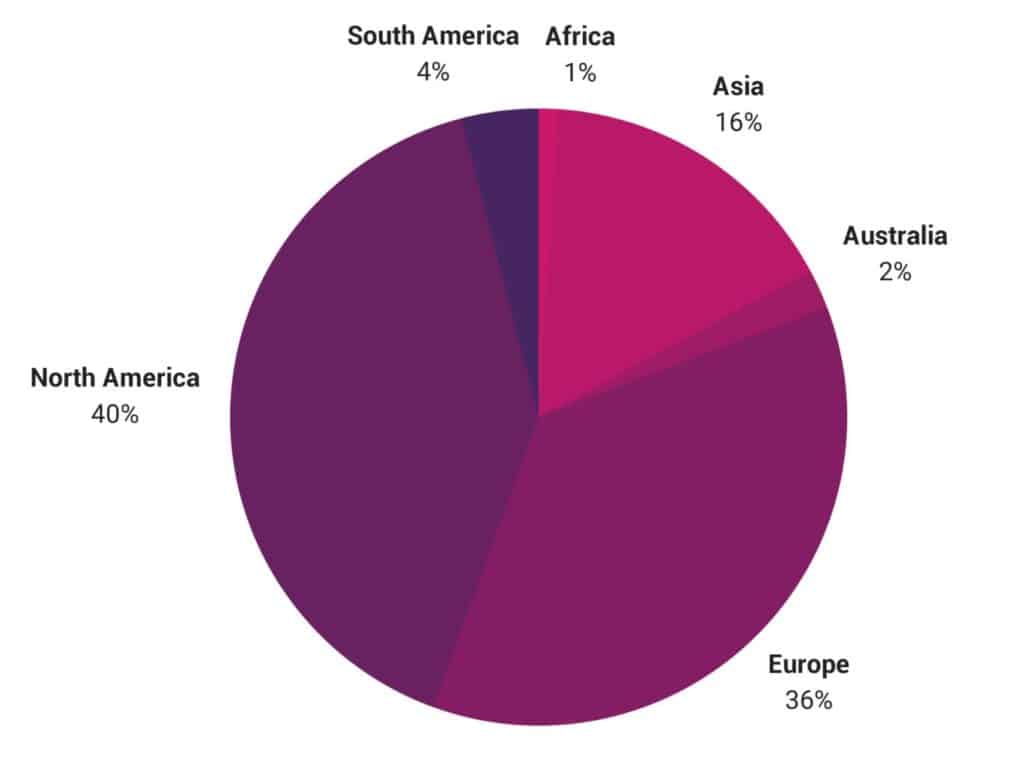
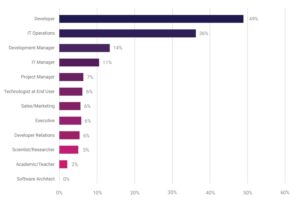
This was most responses we’ve received to date with 2,400 people taking part the survey, primarily from North America (40%) and Europe (36%) in Developer or IT-related roles:
- Developer: 49%
- Operations: 36%
- IT Manager: 11%
- Development Manager: 14%
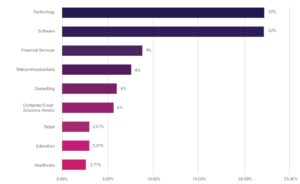
The majority of respondents are from companies with more than 5,000 employees, skewing the results of this survey toward usage of CNCF technologies in the enterprise. The top industries are technology (22%), software (22%), financial services (9%), and telecommunications (8%).
This survey was conducted in English, and we have a Chinese version currently underway, the results of which will be available later in the year. You can view additional demographics breakdowns below:
The changing landscape of application development
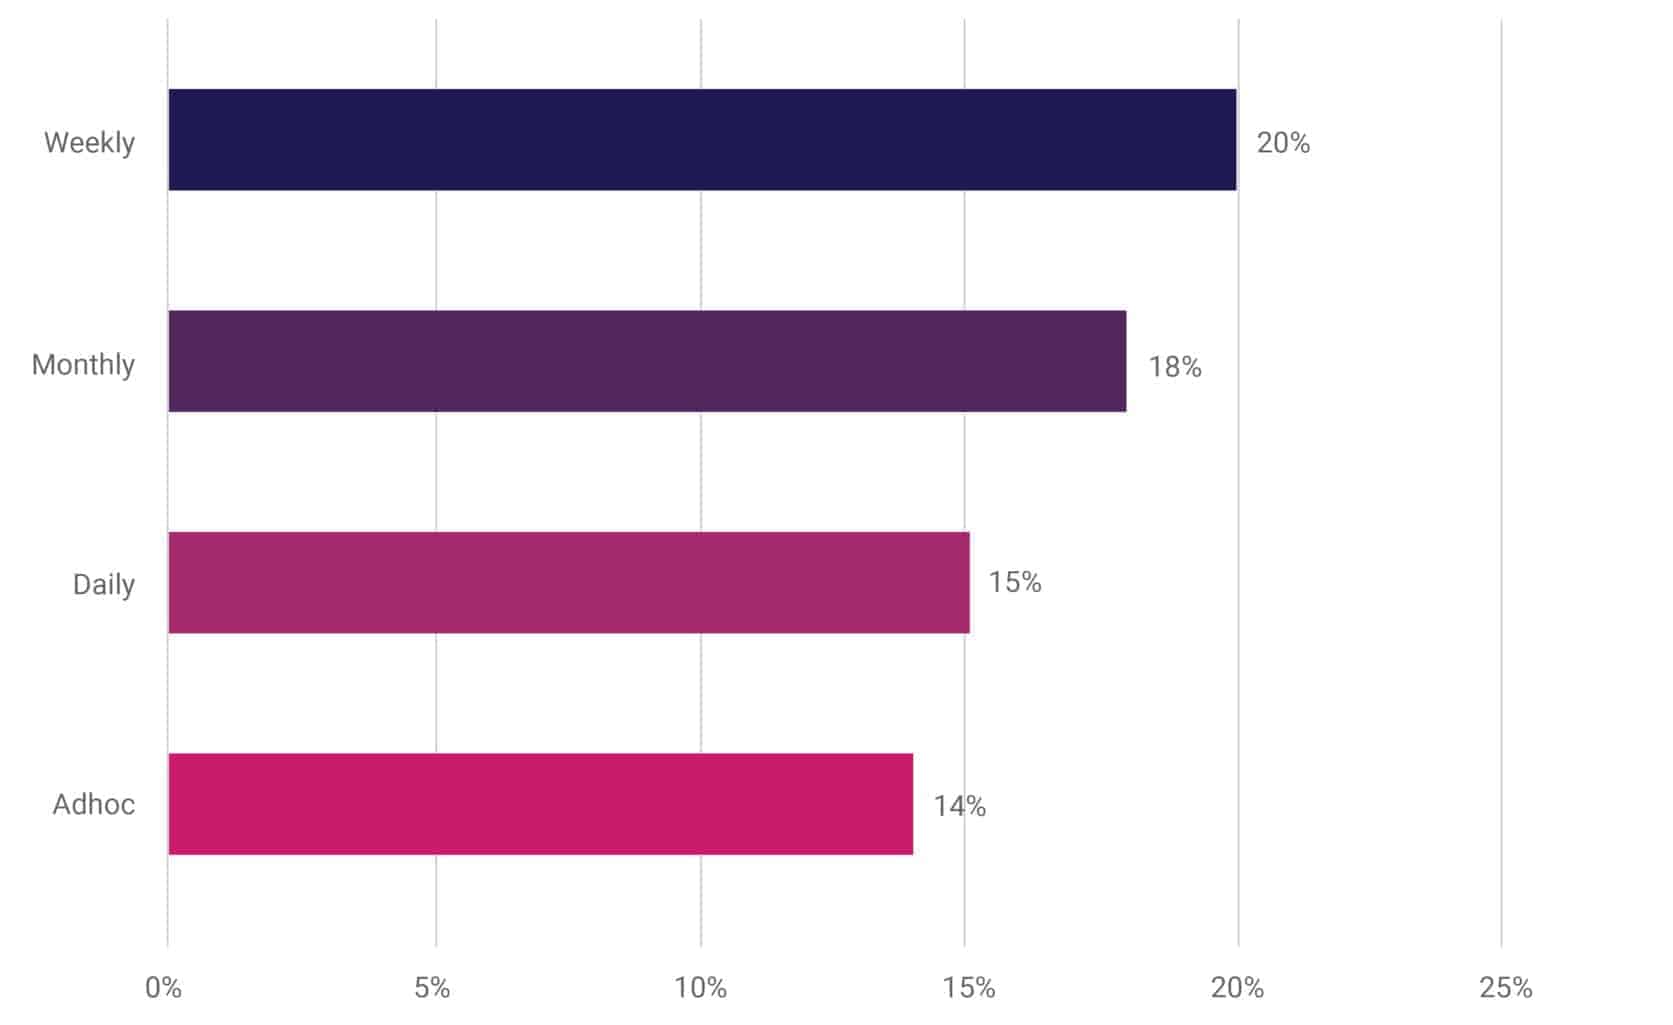
In this most recent version of the survey, we’ve added additional questions on releases to learn more about how companies are managing their software development cycles. One of the benefits of microservices architectures is the ability for flexible deployments, allowing companies to cut releases as often as they need. Prior to microservices, typical release cycles happened much less often, typically once or twice a year. Responses highlighted this with the breakdown of respondents’ release cycles fairly evenly spread out:
- Weekly (20%)
- Monthly (18%)
- Daily (15%)
- Adhoc (14%)
What are your release cycles?
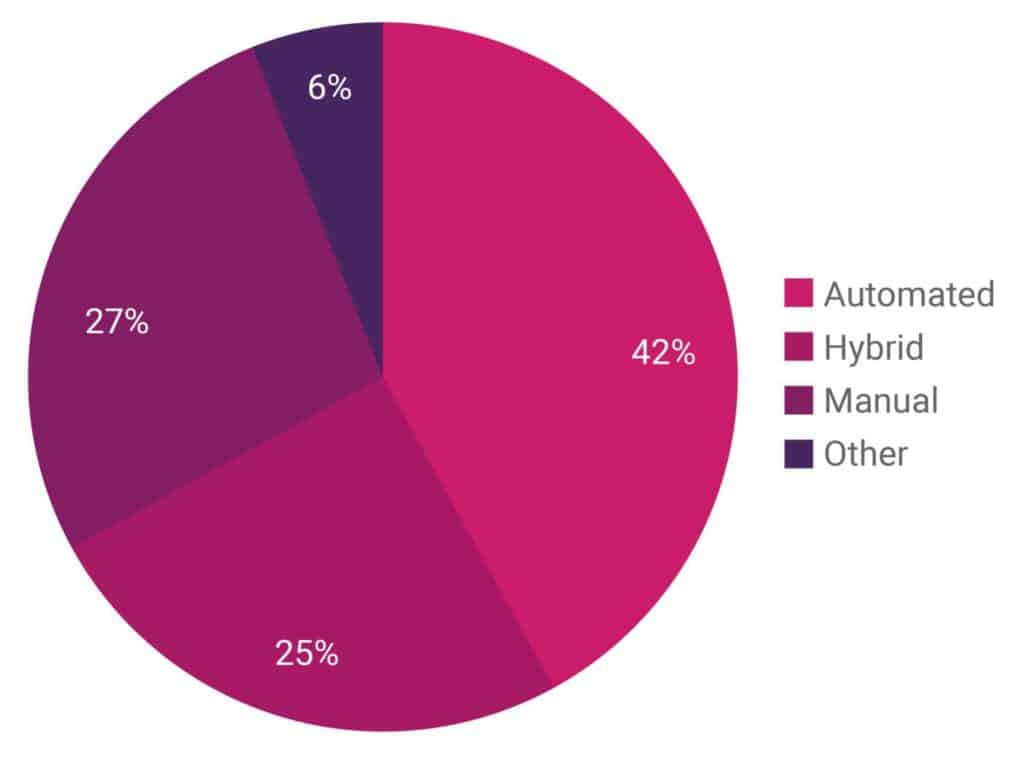
The majority of these releases are automated (42%), with 25% of respondents using a hybrid release method and 27% doing manual releases. As automated releases grow, so does the popularity of tools to manage CI/CD pipelines with Jenkins as the leading tool (70%) followed by Terraform (27%) and Custom Scripts (26%).
Are release cycles manual or automated?
In addition, 67% of respondents are checking in code multiple times per day compared to 28% checking in code a few times a week and 6% a few times per month.
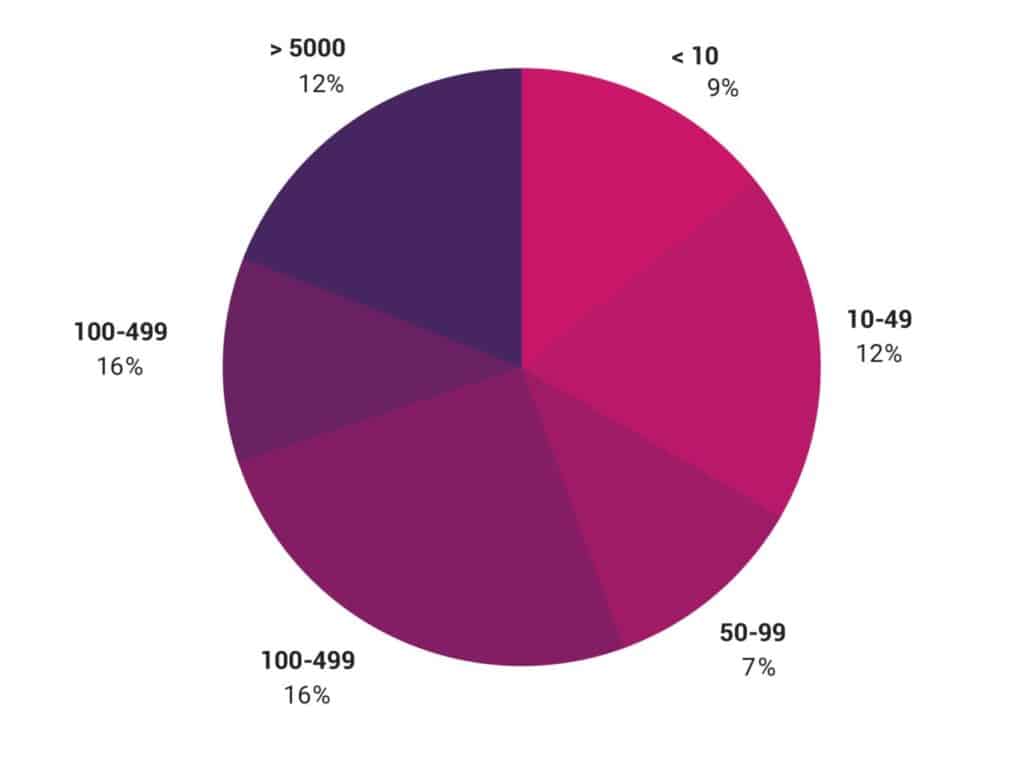
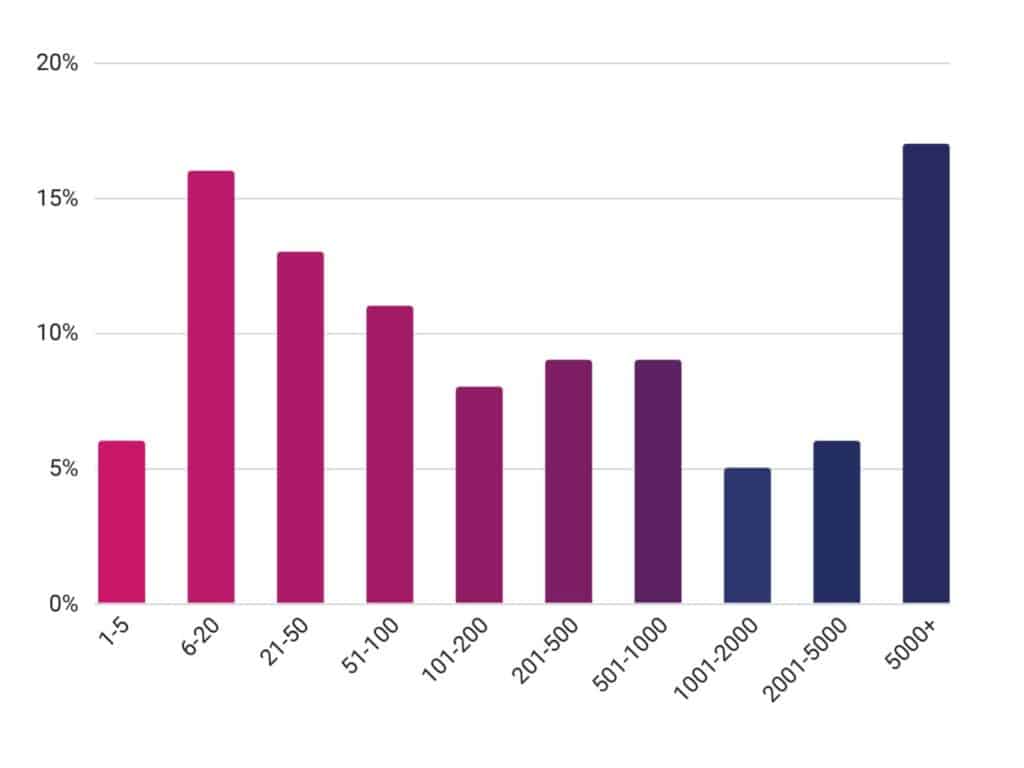
As for number of machines (including VMs, bare metal, etc.) in fleet, we’re starting to see this slightly increase with 5000+ at 17% up from 14% during our last survey in December 2017, 6-20 (16% down from 18%), 21-50 (14%), 51-100 (11%).
On average, how many machines are in your fleet?
 What Cloud?
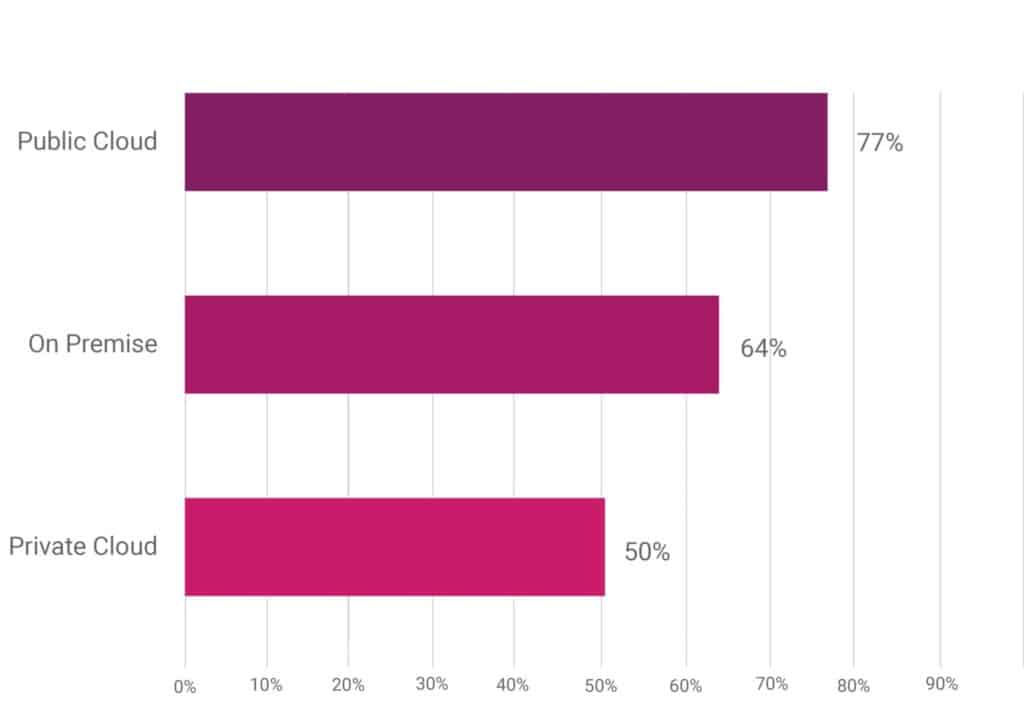
We’re continuing to see companies use a mix of on premise (64%), private cloud (50%), and public cloud (77%) solutions.
Which of the following data center types does your company/organization use?
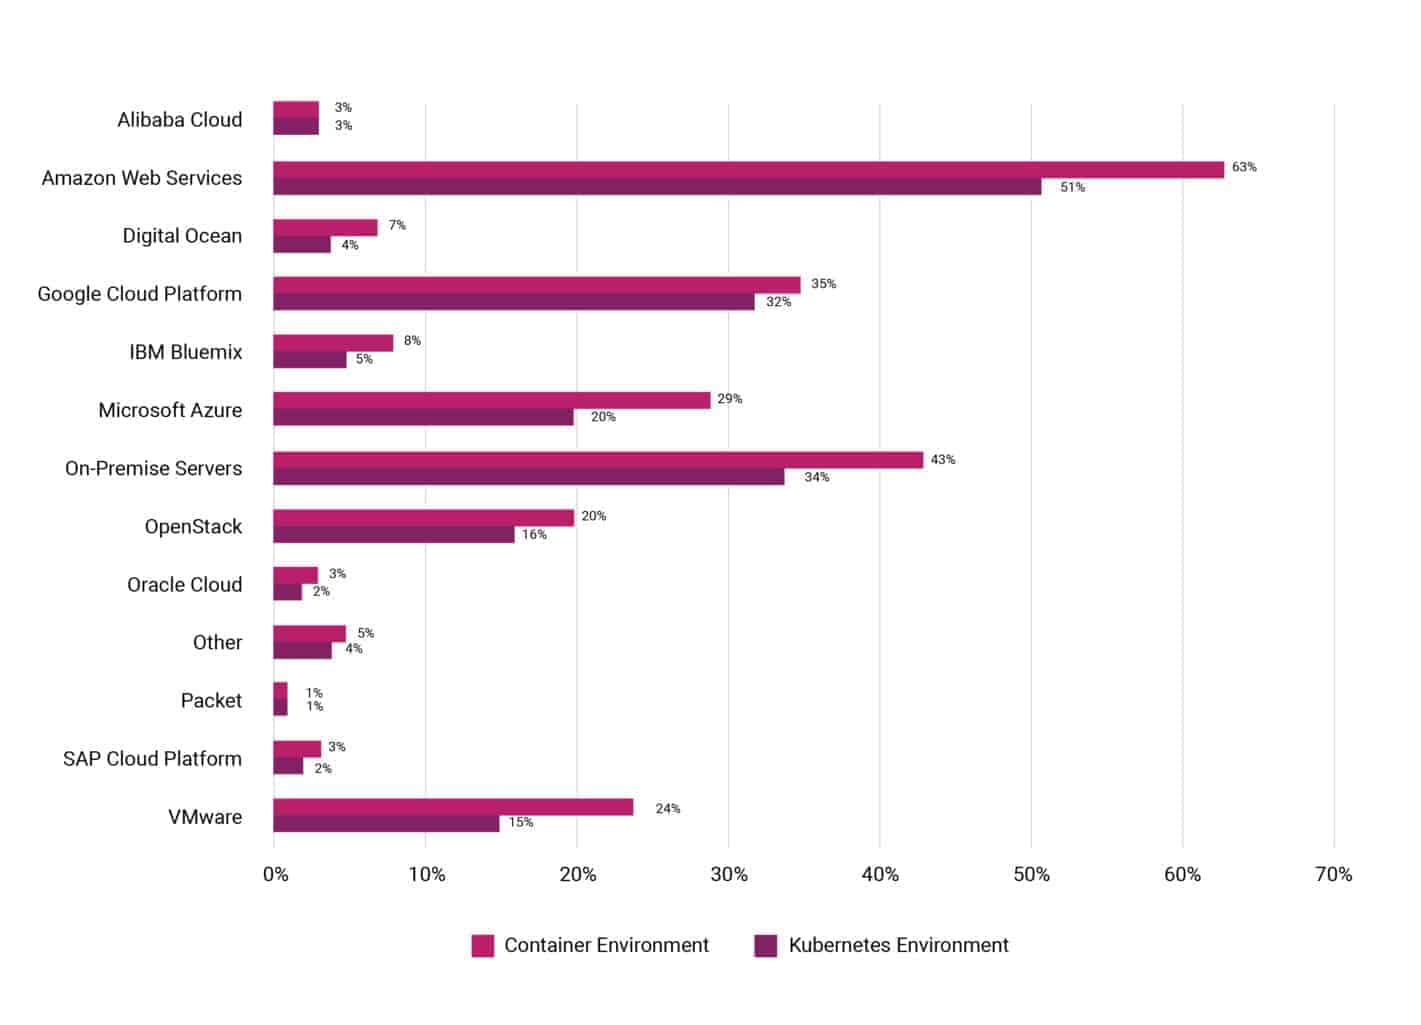
As for containers, the majority of companies are deploying to AWS (63% down from 69%), followed by on premise servers (43% down from 51%), Google Cloud Platform (35% down from 39%), Microsoft Azure (29% up from 16%), VMware (24%), and OpenStack (20% down from 22%).
Your company/organization deploys containers to which of the following environments?
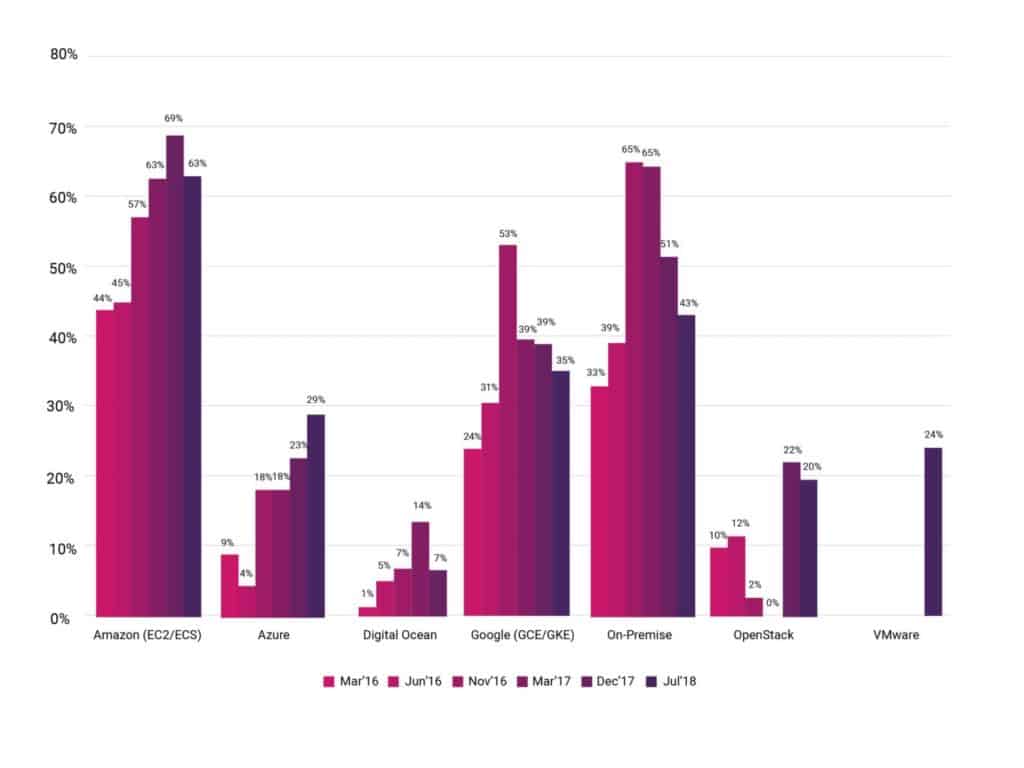
These numbers continue to be inline with the trends we’ve seen over the past year, with two notable changes. On-premise use is down from 51% in December 2017 to 43%, most likely due to growing use of private clouds. Secondly, this is the first time we’ve seen extensive use of VMware in these survey results, with only 1.2% of people citing usage in the December 2017 survey.
Growth of containers
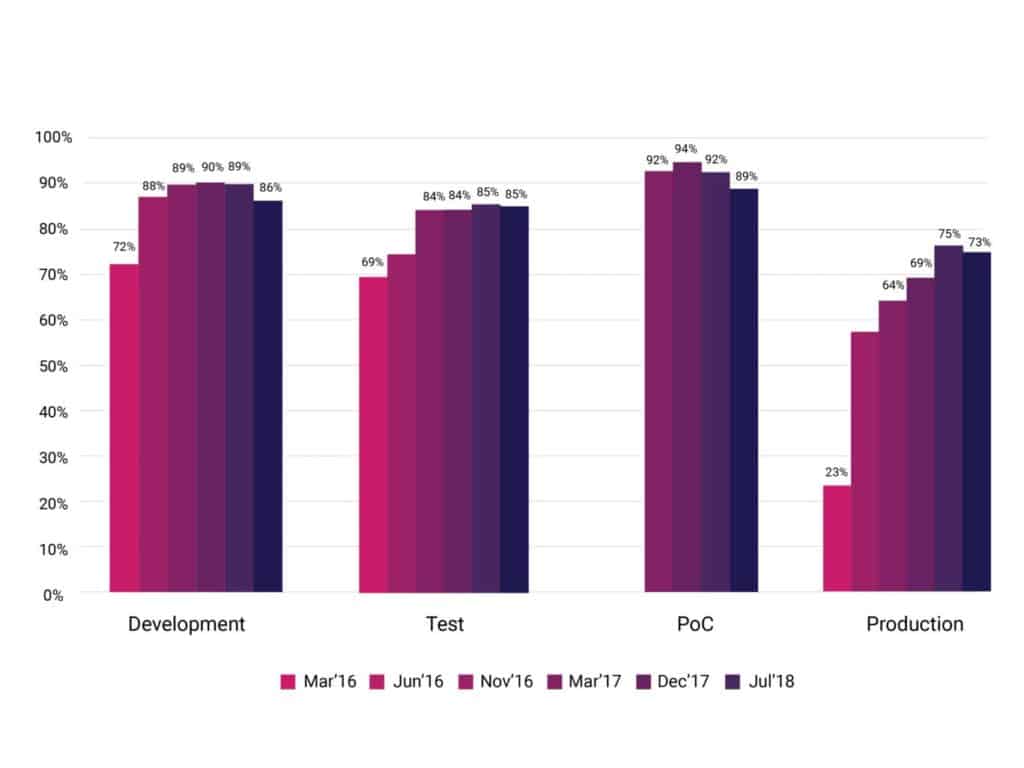
73% (compared to 75%) of respondents are currently using containers in production today, with the remaining 27% (compared to 25%) planning to use them in the future. 89% of respondents are currently using containers for proof of concepts, as well as testing (85%) and development (86%).
Your company/organization uses containers for:
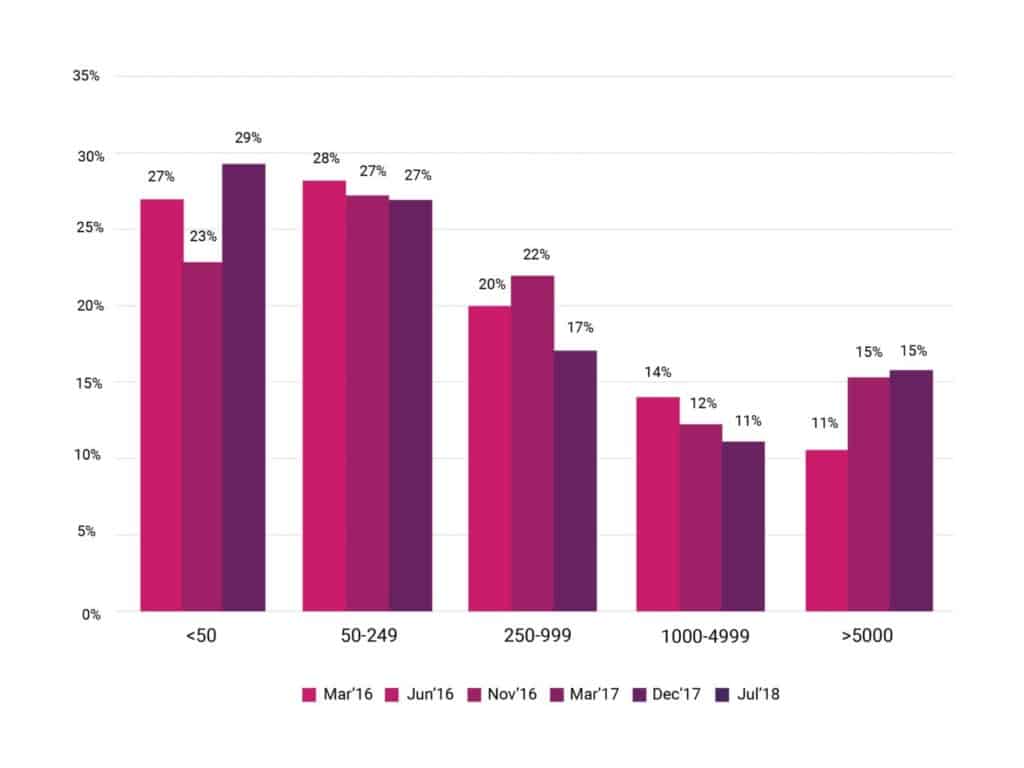
The number of containers that organizations are typically running is also holding steady with 29% running less than 50, 50-249 (27%), 250-999 (17%), and 15% running more than 5,000 containers. There is a slight increase in organizations who are using less than 50, up to 29% from 23% in December 2017, and a slight decrease in organizations running 250-999 (down to 17% from 22%).
How many containers does your company/organization typically run?
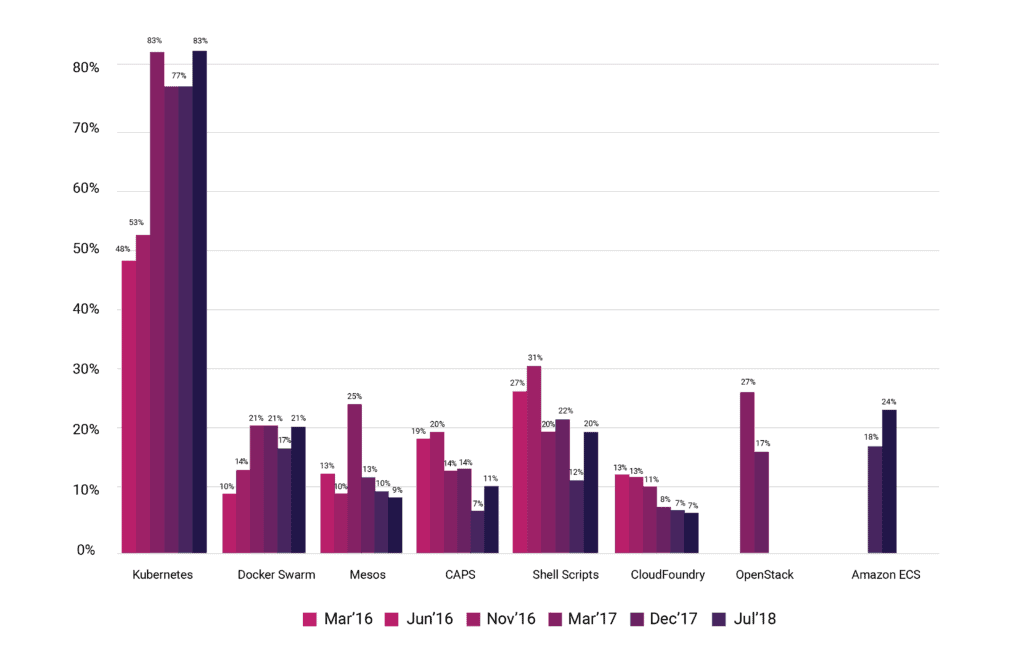
As for container management tools, Kubernetes remains the leader with 83% (up from 77%) of respondents citing use followed by Amazon ECS (24% up from 18%), Docker Swarm (21% up from 17%), and Shell Scripts (20% up from 12%).
Your company/organization manages containers with:
 Kubernetes
58% of respondents are using Kubernetes in production, while 42% are evaluating it for future use. In comparison, 40% of enterprise companies (5000+) are running Kubernetes in production.
In production, 40% of respondents are running 2-5 clusters, 1 cluster (22%), 6-10 clusters (14%), and more than 50 clusters (13% up from 9%).
As for which environment Kubernetes is being run in, 51% are using AWS (down from 57%), on premise servers (37% down from 51%), Google Cloud Platform (32% down from 39%), Microsoft Azure (20% down from 23%), OpenStack (16% down from 22%), and VMware (15% up from 1%). The graph below illustrates where respondents are running Kubernetes vs. where they’re deploying containers.
Kubernetes Environment vs. Container Environment
For local development, the majority of respondents are targeting environments such as Minikube (45%), Docker Kubernetes (39%), and on prem Kubernetes installations (30%).
We also asked respondents about the tools they are using to manage various aspects of their applications:
Packaging
The preferred method for packaging is Helm (68%) followed by managed Kubernetes offerings (19%).
Autoscaling
The majority of respondents are autoscaling stateless applications (64%), followed by Java applications (45%), and task/queue processing applications (37%). Those who are not using autoscaling were either not aware of the functionality (21%) or do not want to autoscale their workloads at this time (31%).
Ingress providers
The top Kubernetes ingress providers cited are nginx (64% up from 57%), HAProxy (29%), F5 (15% up from 11%), and Envoy (15% up from 9%).
Exposing cluster external services
The number one way respondents are exposing Cluster External Services like internet or other VMs is through load-balancer services (67%). This is followed by L7 ingress (39%) and integration with 3rd-party load-balancer (33%).
Separating Kubernetes in an organization with multiple teams
Respondents are separating multiple teams within Kubernetes using Namespaces (71%), separate Ccusters (51%), and Only labels (15%).
Separating Kubernetes applications
Respondents are separating Kubernetes applications using Namespaces (78%), separate clusters (50%), and Only labels (21%).
Cloud native in production
What are the benefits of cloud native projects? Respondents cited the top three reasons as:
- Faster deployment time (50%)
- Improved scalability (45%)
- Cloud portability (42%)
As for the cloud native projects that are being used in production and evaluated:
CNCF Projects
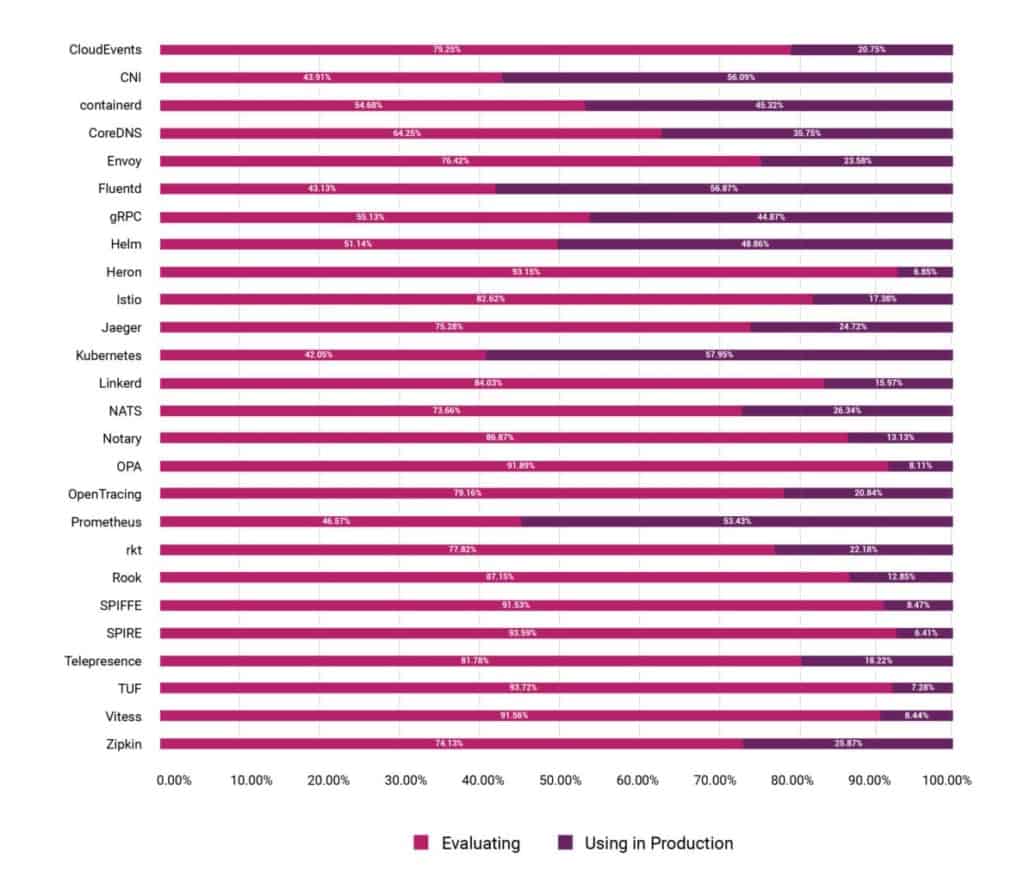
Many CNCF projects showed significant jumps in production usage since our last survey, such as Containerd (45% up from 18%), CoreDNS (36% up from 7%), Envoy (24% up from 4%), Fluentd (57% up from 38%), gRPC (45% up from 22%), Jaeger (25% up from 5%), Linkerd (16% up from 3%), and OpenTracing (21% up from 8%). On average, CNCF project usage is up over 200% since our last survey.
The number of respondents evaluating CNCF projects also jumped with Containerd (55% up from 22%), CoreDNS (64% up from 14%), Envoy (74% up from 26%), Fluentd (43% up from 22%), gRPC (55% up from 16%), Jaeger (75% up from 15%), Linkerd (84% up from 15%), and OpenTracing (80% up from 25%). On average, CNCF project evaluation is up 372% since our last survey.
Projects that are new to CNCF also have high rates of consideration, with respondents notably evaluating SPIRE (94%), TUF (93%), Open Policy Agent (92%), Vitess (92%), and SPIFEE (92%).
Challenges in using & deploying containers
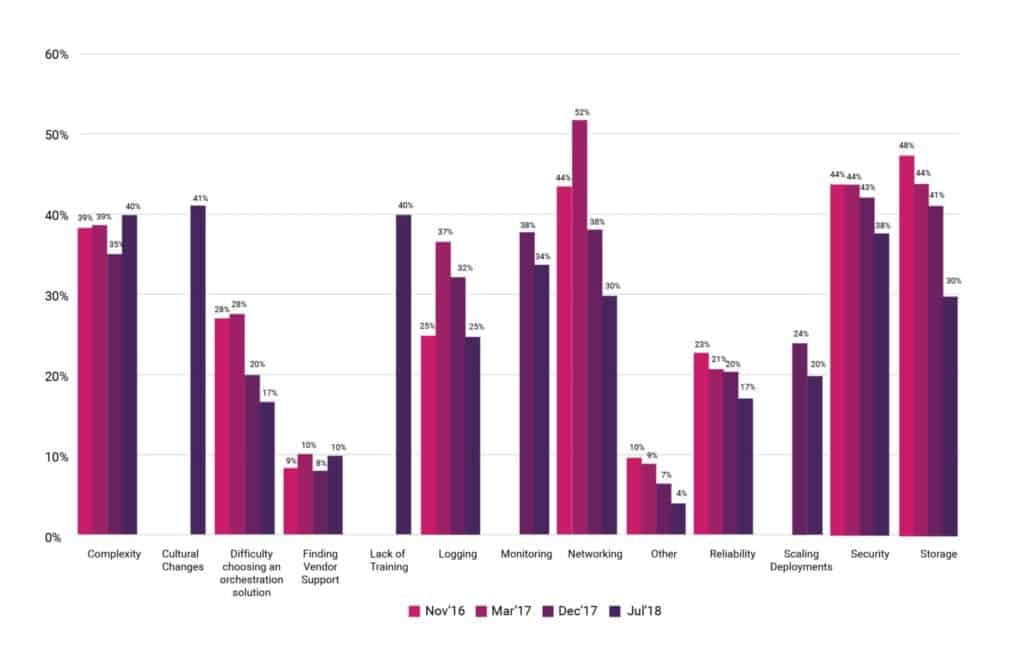
As cloud native technologies change the way companies are designing and building applications, challenges are inevitable. The top challenges that respondents face are:
- Cultural Changes with Development Team (41%)
- Complexity (40% up from 35%)
- Lack of Training (40%)
- Security (38% down from 43%)
- Monitoring (34% down from 38%)
- Storage (30% down from 41%)
- Networking (30% down from 38%)
There are two notable changes to these top challenges. While this is the first time we explicitly asked about cultural changes with the development team, it was cited as the number one challenge in using and deploying containers. Second, lack of training is a new addition to the survey. While CNCF has invested heavily in Kubernetes training over the past year including both free and paid courses and certification for Kubernetes Administrators and Application Developers, we continue to host new projects that need additional training resources as they grow.
The remainder of top challenges have been consistent over our past surveys, but the percentages are continuing to drop as more resources and tools are added to solve these problems.
What are your challenges in using / deploying containers:
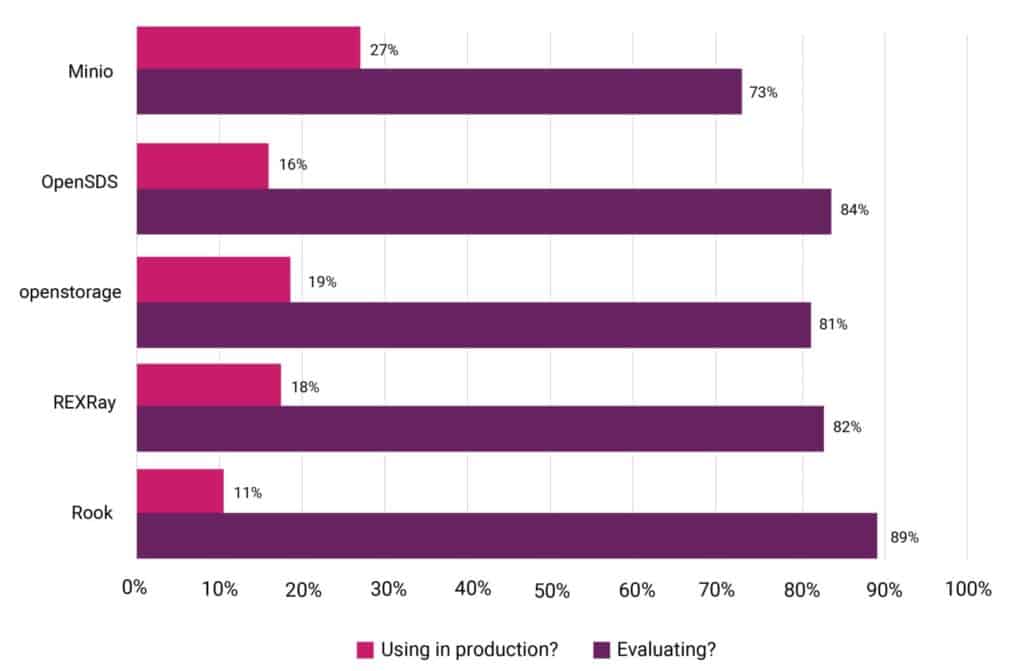
Also interesting is the decrease in storage and networking as a challenge alongside the growth of cloud native storage projects such as:
- Rook: 11% using in production of respondents while 89% (up from 29%) are evaluating.
- Minio: 27% of respondents are using in production while 73% (up from 28%) are evaluating.
- OpenSDS: 16% (up from 7%) of respondents are using in production while 84% (up from 14%) are evaluating.
- REX-Ray: 18% of respondents are using in production while 82% are evaluating.
- Openstorage: 19% (down from 31%) of respondents are using in production while 81% (up from 36%) are evaluating.
Which of these cloud native storage projects is your company / organization using:
 Growth of Serverless
We also continued to track the growth of serverless technology in this survey. 38% of organizations are currently using serverless technology which is up from 31%, with 32% using a hosted platform and 6% using installable software.
37% are not using serverless technology which is down from 41%, but an additional 26% plan to within the next 12-18 months.
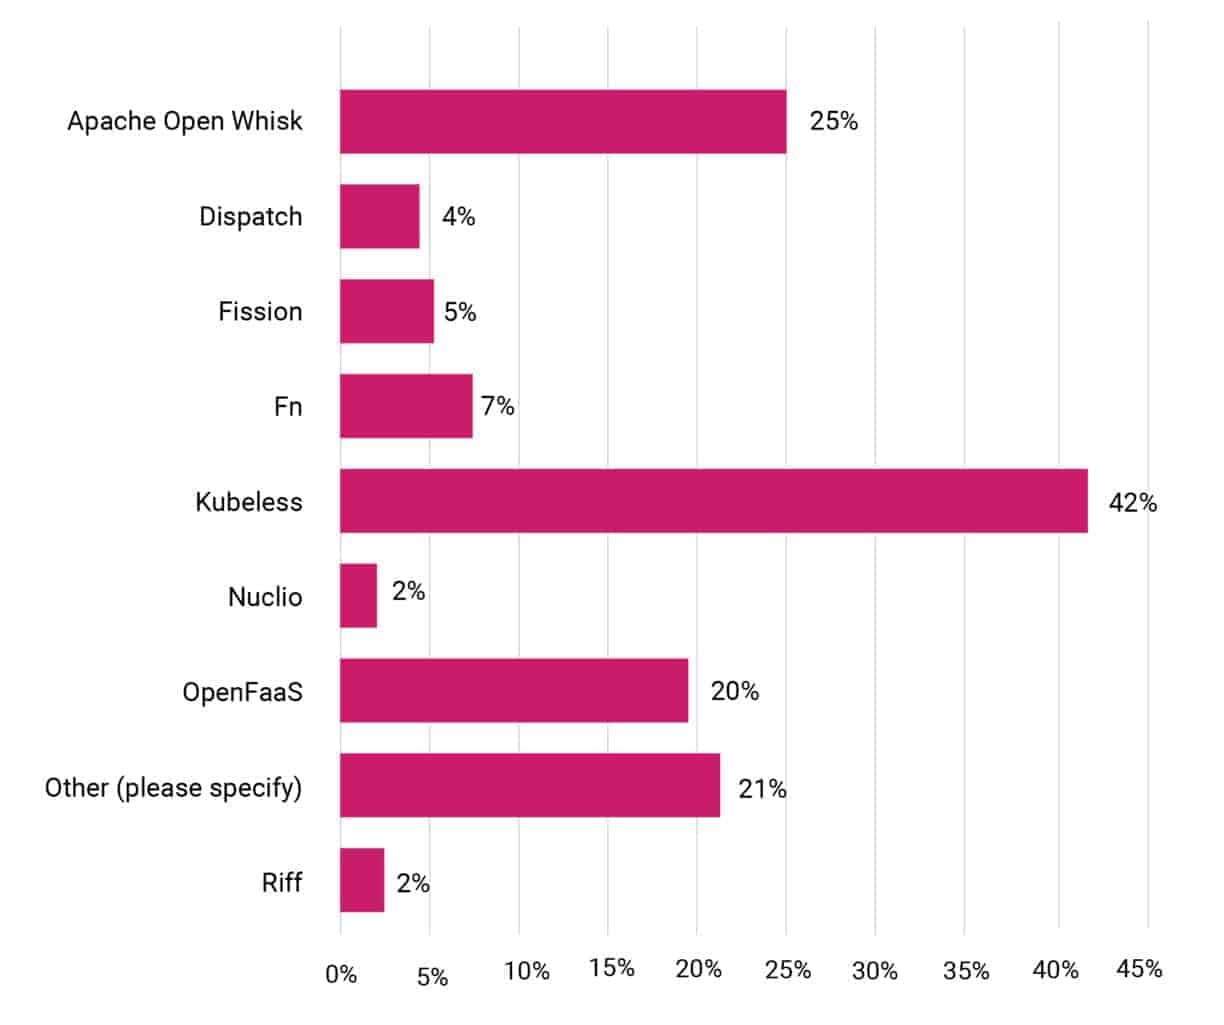
Top installable serverless platforms are:
- Kubeless (42% up from 2%)
- Apache OpenWhisk (25% up from 12%)
- OpenFaas (20% up from 10%)
Which installable serverless platforms does your organization use?
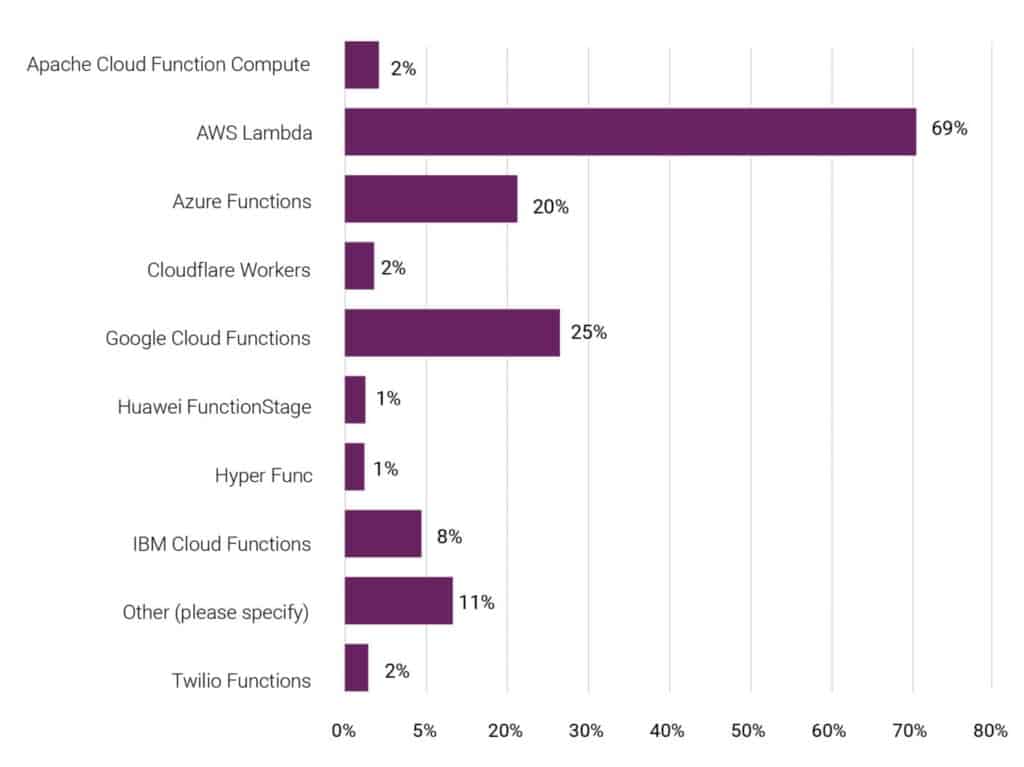
Top hosted serverless platforms are:
- AWS Lambda (70%)
- Google Cloud Functions (25% up from 13%)
- Azure Functions (20% up from 12%)
Which hosted serverless platforms does your organization use?
As usage of serverless grew, there is also significant interest in the serverless project CloudEvents with 80% of respondents evaluating the project for us and 21% using it in production. CloudEvents is an effort organized by CNCF’s Serverless Working Group to create a specification for describing event data in a common way.
How to learn more?
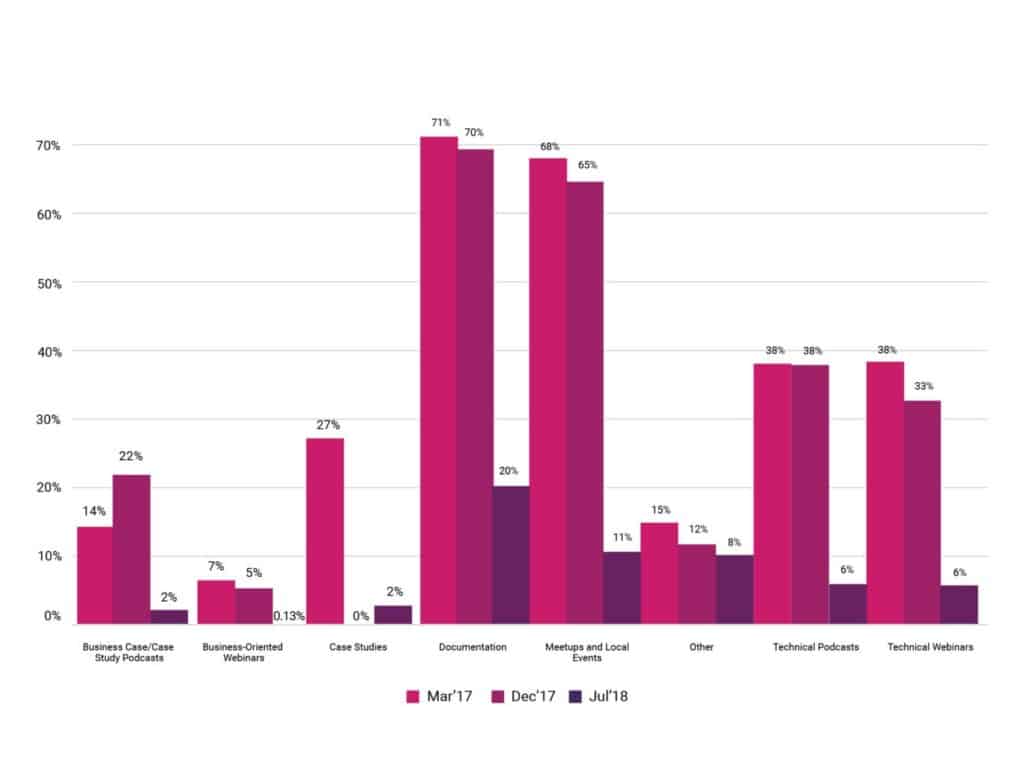
Are you just getting started or want to learn more about cloud native projects? Here are the top ways respondents are learning about cloud native technologies:
Documentation
20% of respondents use documentation to learn about cloud native projects, the number one resource cited in this survey. For example, SIG-Docs helps maintains an extensive resource of detailed Kubernetes documentation. This includes everything from how to get started with a specific feature to best ways to get involved as a contributor. Each CNCF project hosts extensive documentation on their websites, which can be found here.
KubeCon + CloudNativeCon
12% of respondents attend KubeCon + CloudNativeCon to learn more about the technologies they’re using. KubeCon + CloudNativeCon gathers all CNCF projects under one roof and brings together leading technologists from open source cloud native communities to further the advancement of cloud native computing. The event happens three times per year in Europe, China, and North America.
CNCF Website and Webinars
12% of respondents visit the CNCF website and attend webinars to get more information. CNCF.io is the main resource for all cloud native projects, housing information on a variety of subjects including upcoming events, training, certification, blog posts, and more.
The CNCF Webinar Series takes place every Tuesday from 10am-11am PT. You can see the upcoming schedule and view recordings and slides of previous webinars.
Meetups and local events
11% of respondents attend meetups and local events to learn about cloud native technologies. CNCF hosts 149 meetups under our umbrella across 33 countries with over 76,000 members. You can find your local meetup here.
CNCF and the local cloud native communities support events all over the world, from conferences to roadshows. You can view upcoming events here.
10% of respondents get their information from Twitter. CNCF tweets out project, community, and foundation news from our Twitter handle. You can also follow your favorite cloud native projects, a list of their Twitter handles (and additional social accounts) can be found here.
How do you learn about cloud native technologies?
A huge thank you to everyone who participated in our survey. We hope to see you at KubeCon + CloudNativeCon in Shanghai (November 12-15, 2018) and Seattle (December 11-13, 2018).
Stay tuned for our follow-up to this survey with results from our Chinese survey coming out later this year!
You can also view the findings from past surveys here:
March 2018: China is Going Native with Cloud
December 2017: Cloud Native Technologies Are Scaling Production Applications
June 2017: Survey Shows Kubernetes Leading as Orchestration Platform
January 2017: Kubernetes moves out of testing and into production
June 2016: Container Survey
March 2016: Container survey results