By Gianluca Arbezzano, Site Reliability Engineer at InfluxDB, CNCF Ambassador
Walter Dal Mut is a certified Amazon Web Service consultant. He works at Corley SRL, an Italian company that helps other small and big companies move to the cloud.
During the first CNCF Italy Meetup, Walter shared his experience instrumenting a PHP microservices environment with Zipkin and OpenTracing.
Everybody doing logging in applications, and is effectively useful the problem is that we have a lot of detailed informations, they move very fast across multi services. They are almost impossible to read it in real time.
This is why we have monitors. With monitor I mean events, metrics and time series. One aspect of monitors that I love is the aggregation.
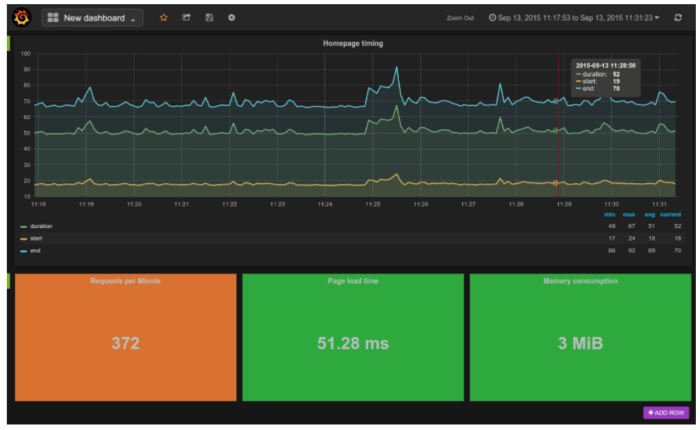
It makes easy to put things together and we can see so many things for example I can see the criticality of my issues looking at the occurances. I can compare the number of requests with the load time in just one graph. This is very useful and it’s something that I can’t see tailing logs.
With metrics we can measure changes. It is one of the most important things in my opinion for monitors because a deployment usually is the point in time when something change. If we are able to detect the entity of this change we can take any action based on how good or bad it is. We see immediately if what we changed is important or not. You will discover that so many times we change something that is not useful at all or my change is just not working as expected. Monitors are the only way to understand all of this.
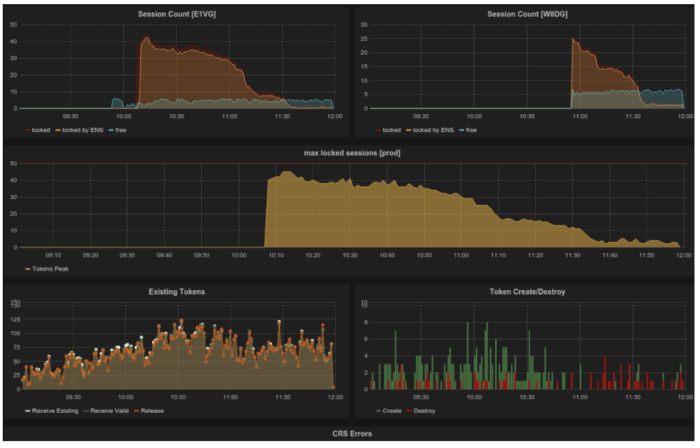
Describing the image above I instrumented my application to send events and I collect them on InfluxDB. From the bottom right graph you can see green and red lines. Read lines tell to us that something is wrong, and now that we are know the distribution we can measure how a new version of our software improve or not the current state.
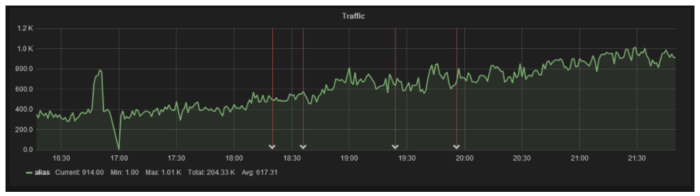
One tip to remember when you are building your dashboard is that a deploy is an important event. Based on what monitoring software you are using you can mark this special event with a vertical line, Grafana call this feature annotation. The annotation is printed across all the graphs part of the same dashboard. This line is the key to understand how a new release performs.
One missed information at some point is how the information is propagated in our system.
In a microservices it’s not really important the log generated by a single service we want to trace and jump across services following our request. I want to connect dots across my services and the tracing is designed to read time series in this terms.
In a traditional web application with a database, I want to understand the queries made to load a specific page. I want to understand how much it takes to keep them optimized and low in terms of numbers.
Tracing is all about spans and inter-process propagation and active span management.
A spans is a period of time that starts and ends, other than these two points we mark when the client send the request, when the server receive the request and when the server send the response to the client.
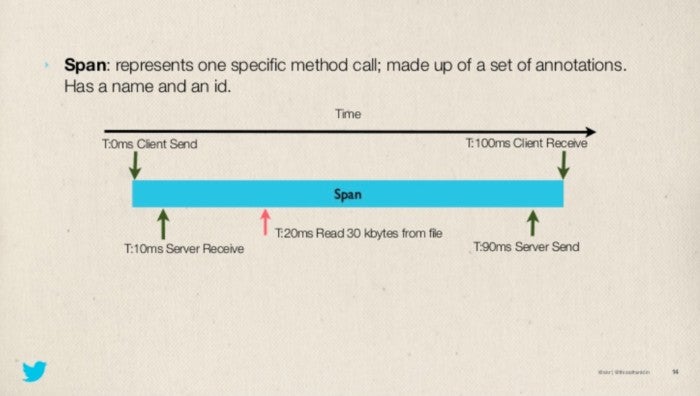
These four signals are important to understand the network latency between services.
Other than that you can mark custom events inside a span and you can calculate how long it takes to your application to end a specific task like generating a pdf, decompress a request, process a message queue and so on.
Inter-process propagation, the way that we propagate things as maybe using four eaters that we can send in my request. There is a trace indeed. It is the unity in fire that starts at time zero and ends when all my micro services are included. It is in the trace I.D. Then they have a spy identification using the spy effectively they want to use. Because the client send a request.
The inter-process propagation describe how we propagate things across network or processes. In HTTP we use headers to pass traces information across services. TraceId is the unique identifier for every single request every spans part of that requests is grouped under the same id. Every span has it’s id and it also have a parent span id. It is useful to aggregate all the spans to get the three of your spans.
There are different traces available the most famous open source are Jaeger (a project under the CNCF) an Zipkin started by Twitter.
During the talk Walter used Zipkin but they are both compatible with OpenTracing. If you use the right libraries you are able to switch between tracers transparently.
The length of each span describes how much time it took and from this visualisation we already have a good set of information and optimisation points:
- How many services we are calling to solve the request. Are they too much?
- How many time I am calling the same service.
- How much time a service is taking. If the authentication takes 80% of your request time every time you should fix it.
- And many more.
Some spans have one or more dots, that white dots are logs. They are useful to understand when a specific event happen in time. You can use this feature to identify when you send an email or when a customer clicked a specific button tracking it’s UI experience.
The video shows a details demo about what Zipkin provides in terms of filtering, searching and event UI trick to quick identify traces that ended with an error. Other then showing how Zipkin works Walter shared his experience instrumenting PHP applications.
The focus of his talk is all about tricks and best practices really useful to listen in order to avoid some common mistakes.
They are a bit hard to transcribe and I will leave the video to you.
I will leave you the quote that he shared with us at the end of the presentation (spoiler alert)
“Measure is the key to science (Richard Feynman).”