The future lies in the bright twinkling lights of the cities. (Fortune’s own Leigh Gallagher even wrote a book, The End of the Suburbs, about it.) And the numbers don’t lie. According to U.S. Census Bureau, as of 2013, 269.9 million people are living in cities, a 2.3 million increase from 2012. Overall, 76% of America’s metropolitan area grew in population.
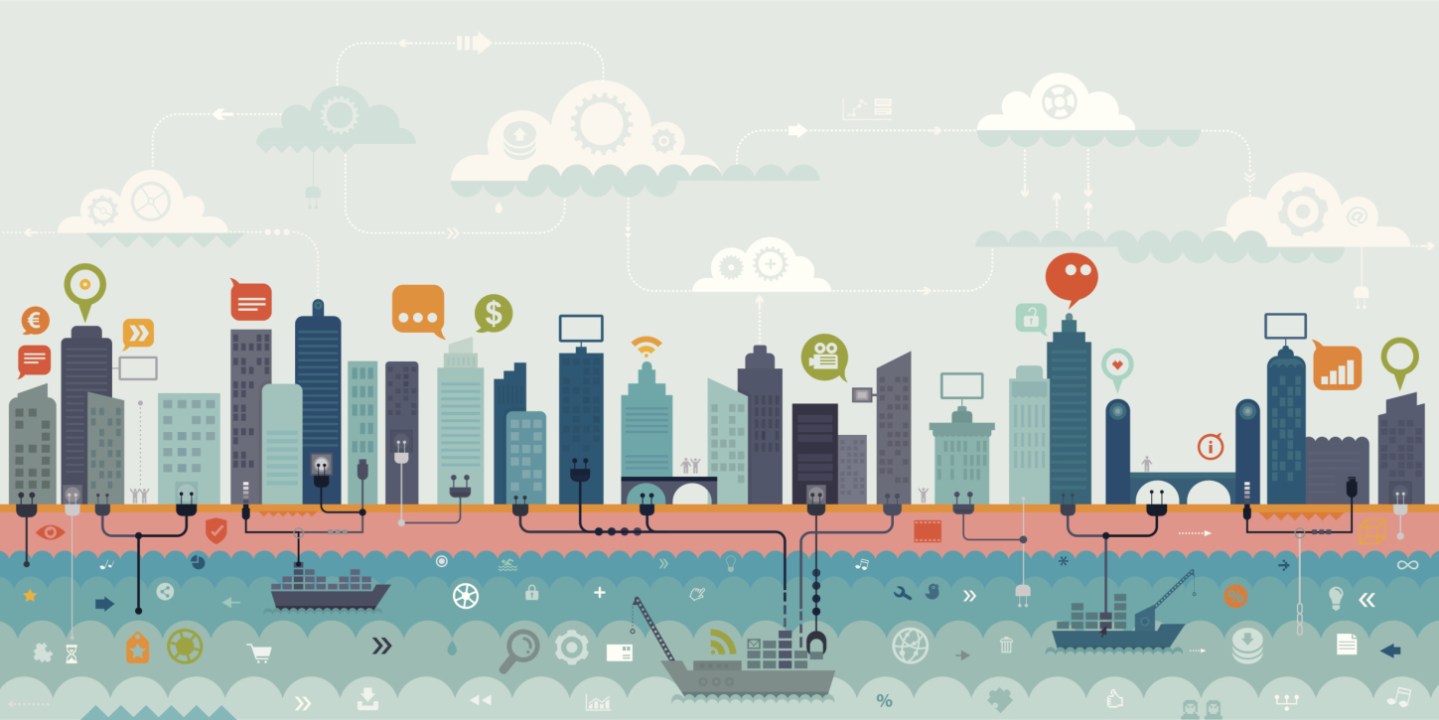
Yet as cities grow bigger, their problems multiply. San Francisco is facing an affordable housing crisis. Traffic in Los Angeles drives people crazy. New York faces all of that and more. But changing existing structures isn’t easy. Increasingly, cities are looking to big data in order to solve their problems.
“Data when analyzed effectively, can facilitate more informed decision making at every level. It’s an empowering force,” says Logan Werschky, a special advisor to the chief analytics officer for the City of New York. “When cities are better-equipped to analyze information it promotes more operational efficiency and effectiveness, cost savings, and increased public safety. Data can help us do our jobs better.”
Here are four key problem areas and some of the big data solutions cities are using to attack them.
Traffic: Los Angeles
British researchers have found commuting times are directly linked to people’s happiness, yet shortening them is no easy task: building roads and public transportation is expensive. In 2010 Xerox Labs (XRX) partnered with Los Angeles and came up with an easier solution for the ever-present traffic congestion in Los Angeles. Researchers realized that congestion is caused by people searching for parking during peak hours. They embedded sensors in parking spots, and transmitted the data created by them to a mobile application that revealed which parking spaces were empty when. Better yet, the city was able to change the price of parking based on activity, which would dissuade drivers from driving around endlessly for a cheap spot.
The impact? Traffic congestion has reduced by 10%. “These principles have been around since the 1950s,” says lead researcher Onno Zoeter, “but now there’s a full-fledged platform that allows the city to understand what goes on.”
Utilities and Services: New York
Increased government services are fantastic only if you can actually request them when you need them and city governments are infamously difficult to contact. Prior to 2002, callers in New York would spend an upwards of 20 minutes on the phone trying to get the right agency. In 2002, then-mayor Michael Bloomberg dreamt of a centralized call center for New York City.
New York City paired up with Accenture (ACN) to design a system where citizens can dial 311 to register any complaint and be connected to an operator who will transfer them to the relevant city agency. The center resulted in so much centralized data it spawned two offshoot projects, Citywide Performance Reporting (which collects and reports data from different agencies across the city) and DataBridge (which allows the city to use predictive analytics to mine the data collected by Citywide Performance Reporting).
For example, New York’s city government receives plenty of calls about illegal sublets (which are considered a fire hazard), but it doesn’t have enough inspectors to investigate each complaint. With DataBridge, the city can aggregate data from different agencies to figure out which complaints present a higher risk and should be investigated sooner. “The biggest challenge was it’s been so successful that call volume is growing,” says Keir Buckhurst, managing director of Accenture’s government practice. “Once you make it easy to request a service, people keep calling for more.”
Public Safety: Los Angeles
In another era, police relied on their gut instinct when they picked an area to patrol. Today they have PredPol, analytics software that predicts where crime is going to happen.
Crime is based on three factors, says Jeffrey Brantingham, co-founder of the company that makes the software. There are built-in environmental factors that nurture crime (such as a bar that turns a blind eye to brawls), repeat victimization (a house that has been broken into once has a higher chance of being broken into because the robber knows they can get in again), and near-repeat victimization (if a house is broken into, the neighboring houses are at a higher risk because the neighborhood is familiar territory).
PredPol uses 10 years of police data to predict where the next rash of crimes will break out based on these factors. In 2011 the Los Angeles Police Department rolled out PredPol in its Foothill Division. Four months later, crime had dropped 13% in the policed area, compared to increasing 0.4% where PredPol wasn’t used.
“We’re still using it, and the Foothills is still the number one in crime reduction in L.A.,” says Sean Malinowski, a captain in the LAPD’s Foothill Division. “I don’t think that’s a coincidence.”
It didn’t happen overnight, Brantingham adds. “We spent five years doing research. Cities should really think of making experiments part of their approach. Experiments are nerve wracking, but it’s the only way you learn if something is worth pursuing.”
Urban Planning: San Francisco
As the population in many U.S. metropolitan areas increases, decisions about what to build and where to build become increasingly important. Paul Waddell, a professor of regional planning at the University of California, Berkeley, has built a city planning tool called Synthicity.
The software generates visualizations of what cities will look like and how they will change residents’ behavior when different planning decisions are made. It lets users examine the impact of building a new light rail system, for example, such as the project’s effect on land prices around the tracks (which would then present a need to build more affordable housing). Synthicity is currently working with several city organizations including those in Paris, San Francisco, San Diego, and Atlanta.
Scott Edmondson, the San Francisco city planner who uses Synthicity to test future development models of San Francisco, said one of the biggest benefits of using the tool is its use in helping standardize land use data across different counties. It’s the kind of project that often doesn’t get funded, Edmondson says, but is a necessary first step for more glamorous and high impact work.
“Technology is the fastest way to create cultural changes,” he says. “That’s really what it can do: create a better democracy.”


