Editor’s Note: This post is one of Convince & Convert’s Top 10 Posts of 2016.

As you draft up your campaign or strategy, always ask yourself this question:
Can I measure this?
For the most important components of your project, the answer will likely be yes. So before you begin executing, make sure you’re laying down a solid foundation for how you will measure your success.
When you’re wondering if your efforts were worth it later, or speculating over whether you’ve done a good job, these metrics will be there for you, answering your questions, providing proof, and cheering you on to greater altitudes.
The metrics you’ll want to track will actually be dependent on your most important goals for a project or campaign. Although all projects are different, here are some great, mainstream metrics that I measure as a rule of thumb:
| 1-5: Digital Marketing Staples |
|
| 6-10: Additional Proven Metrics |
|
Digital Marketing Staples
1. Overall Traffic
What:
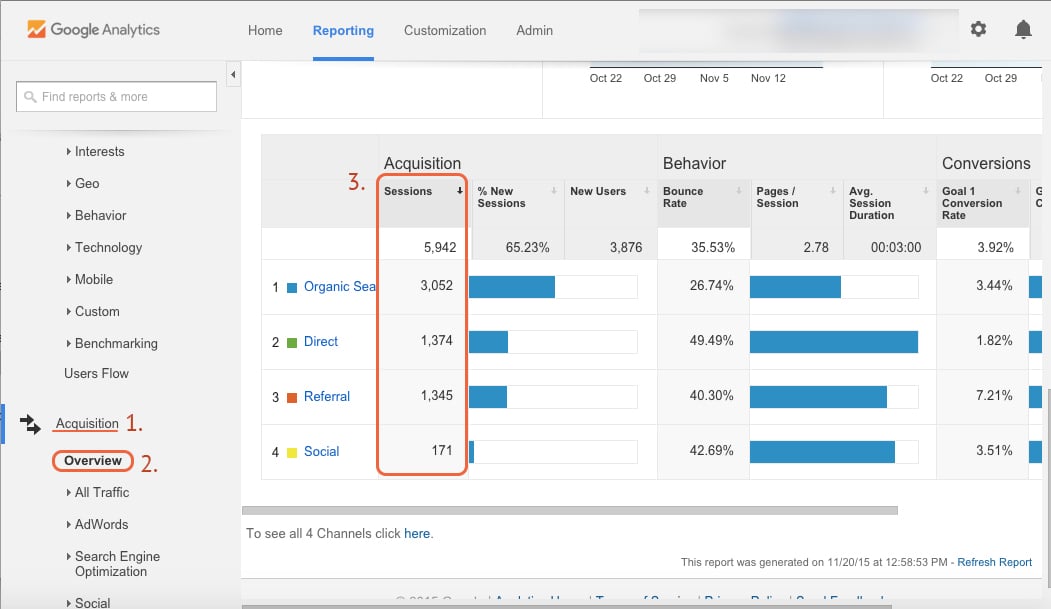
“All Traffic” (from Google Analytics) will show you how many people visited or engaged with your site in total. It can be broken up into source/medium, which describes where your traffic comes from.
Why:
Overall traffic will give you a bird’s eye view of where you stand. It’s a good idea to benchmark or keep an eye on your total traffic over time. You may begin to see similar patterns emerge—like seasonality—that can put you ahead of the game later. The rule of thumb here is that if you’re doing a good job, your overall traffic from all sources should steadily increase over time.
How to Measure:
First, enter your Google Analytics dashboard.
- Go to the Acquisition report section
- Go to Overview
- Look in the Sessions column in the table
2. Channel-Specific Traffic
What:
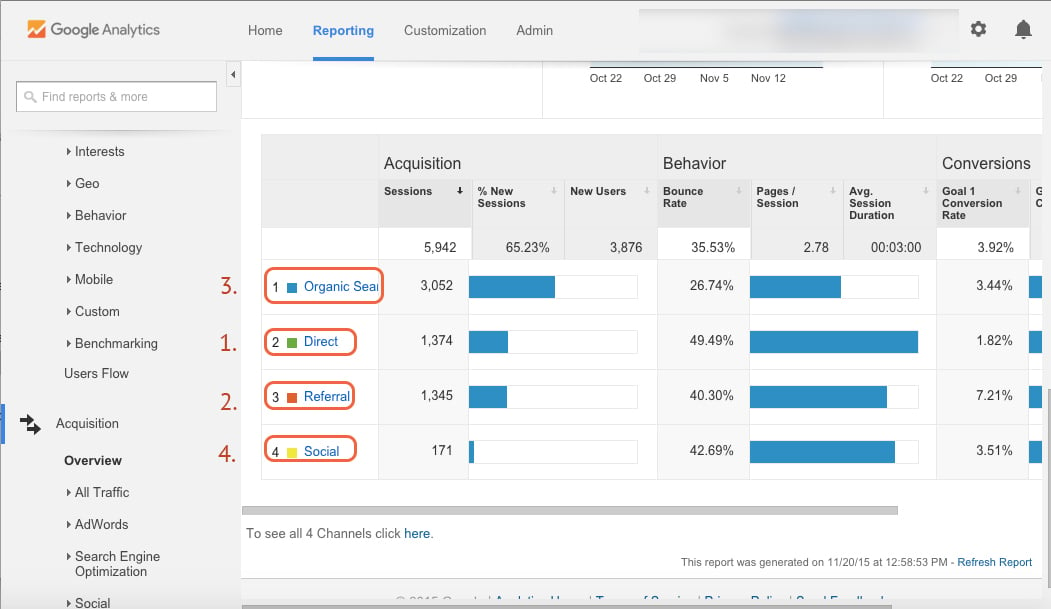
These metrics depend on where people were immediately before arriving at your site. The channel is the type of door they used to enter your site.
Why:
Looking at your top mediums is important to measure for full-scale digital marketing campaigns. It allows you to see what’s causing a drop in visits (if you see dips in overall traffic) and where your campaign excels.
Channels to Watch:
- Direct: This is when people directly type in your URL to visit your site or who began to search in the omnibox but visited your site before. The omnibox automatically fills in because they’ve been there before.
- Referral: These are people who came to your site from another website. It’s external traffic. People followed a link on a different domain to get to you.
- Organic: These are people who performed a search on a search engine such as Google or Bing, and clicked on your website’s listing in the organic (non-paid) search results.
- Social: People who came to your site from a social media platform. It’s also a great indicator to gauge the general effectiveness of your SEO, social engagement, content, and integrated campaigns.
3. Total Conversions
What:
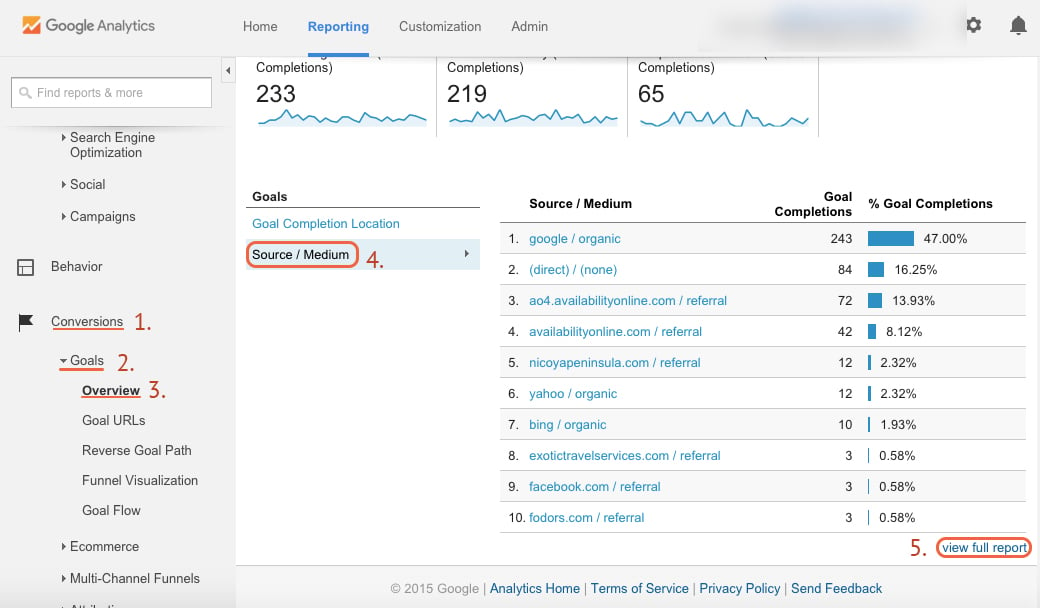
Traditionally, a “conversion” is when someone evolves from a simple user visiting your site to a paying customer. However, in today’s digital world we want to track engagement and what our customers are doing on our website to get them deeper into our funnels.
More generally, it’s when users complete any desired action, such as filling out a form, clicking a download button, sign up for a trial, download an ebook, create an account, etc.
Put simply by Kapost, here is another interesting way to think of a conversion:
“The number of anonymous visitors who become known records in your marketing database.”
Why:
Low conversions can speak to bad design, unappealing offerings, or a disinterested audience. Tracking conversions helps you point out exactly which components people are interacting with on your site, and which components they just aren’t.
It’s also hugely informative on the quality of your UX and other less-tangible creative areas. Low conversion rates can spark a push toward updating your sales funnel, or indicate that it’s time to invest in modernizing your website.
How to View:
- Go to Conversions > Goals > Overview
- Select Source/Medium
- Click “view full report”
4. Bounce Rate
What:
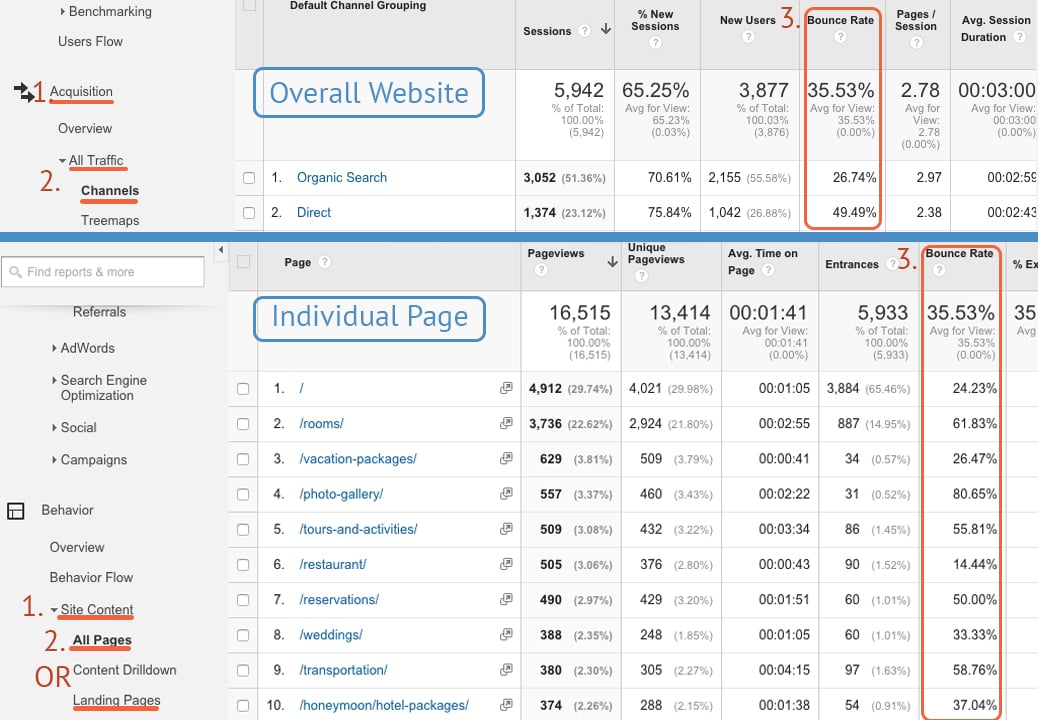
Your site’s bounce rate is the average number of visitors who left your website after only visiting one page—the page they came in on (the “entrance page”).
Each page can have its own bounce rate. You’ll find different pages tend to have different bounce rates, and not all bounce rates are equal.
Why:
Bounce rate can tell you whether your site content is relevant or if you are using the right landing page for a paid campaign. The number is very relative, however.
On one hand, a bounce rate for a specific page may be high because users leave the site after viewing the single page after finding the precise info they needed, and had no interest in going further. Perhaps they even called in and became a paying customer after bouncing off a contact page.
On the flip side, users that experience issues with usability or site design might leave the site from the entrance page and never go to a second page.
How to Track:
Overall Website
- Go to Acquisition > All Traffic > Channels
- Choose a specific channel to see just that channel’s performance
- Check the Bounce Rate column
Individual Page
- Go to Behavior > Site Content
- Select either All Pages or Landing Pages
- Check the Bounce Rate column
5. Search Trends
Looking at search trends can explain a lot that you don’t have control over. For example, if you are an apartment rental company, search trends for “apartments in city X” might dip in winter and spike again in spring.
Cross-check this with your overall or organic traffic and voila, that’s why Q4 traffic looks so bad compared to previous quarters in the same year. You will want to compare Q4 in the current year to Q4 the previous year to track your true progress.
Why:
This can be a great way to tell whether you’re targeting the right keywords for your campaign. If you’re targeting a word that was quite popular five years ago but has since fallen in interest, you may be spending your efforts chasing a highly competitive phrase that really shouldn’t be so competitive anymore.
How:
Google Trends is a good place to start. Dig around and get a feel for how people engage with your industry on a global, chronological scale, or narrow your focus to your own region for even tighter insights.
Additional Proven Metrics
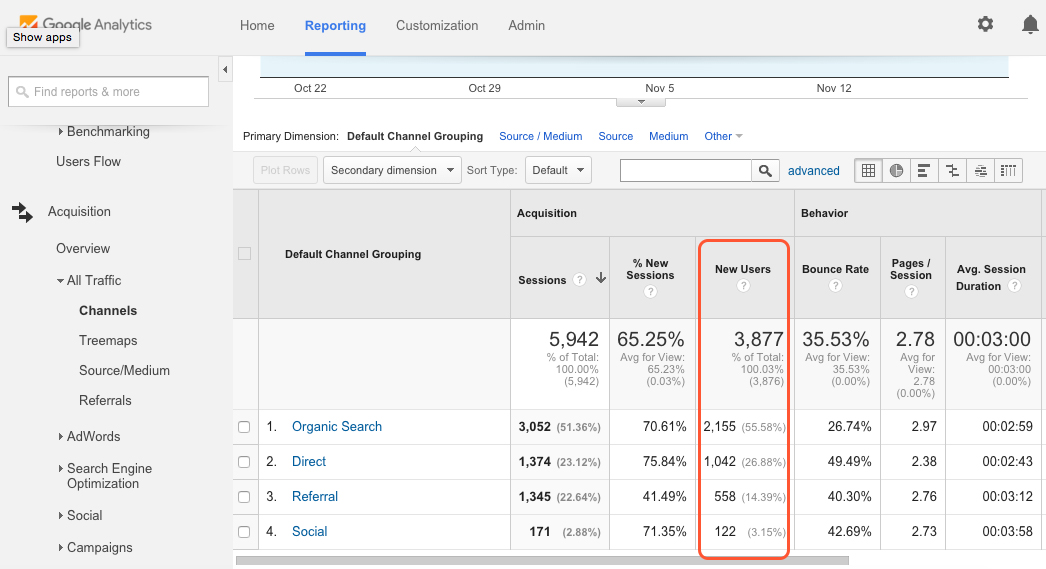
6. New Vs. Returning Visitors
Come in, and come back often!
An increase in new users could be a response to getting mentioned on a popular website where you earned a guest blog, a freshly published press release, or increased budget for a paid campaign (Facebook, PPC or Banner Advertisement).
Why:
This metric tells you whether your site is sticky enough to encourage repeat customers, and tells how effective your outreach efforts are. For example, if you launch a new email marketing campaign to your database, you might see an increase in returning visitors to your website. That reveals your email campaign was well received.
How:
Check out the % New Sessions column in most reports.
7. Queries
Around 2011, Google started securing keyword data for people conducting searches while logged into a Google account. That means anyone using Gmail or any other Google service (i.e. everyone with Android phones) falls under a privacy policy that restricts keyword information from appearing in Google Analytics.
The good news is, there are other ways to get some insight. Start by connecting your Webmaster Tools property with Analytics. (Note: Google Webmaster Tools is now known as Google Search Console.)
You can see keyword query data start pulling into Analytics, including organic impressions and clicks.
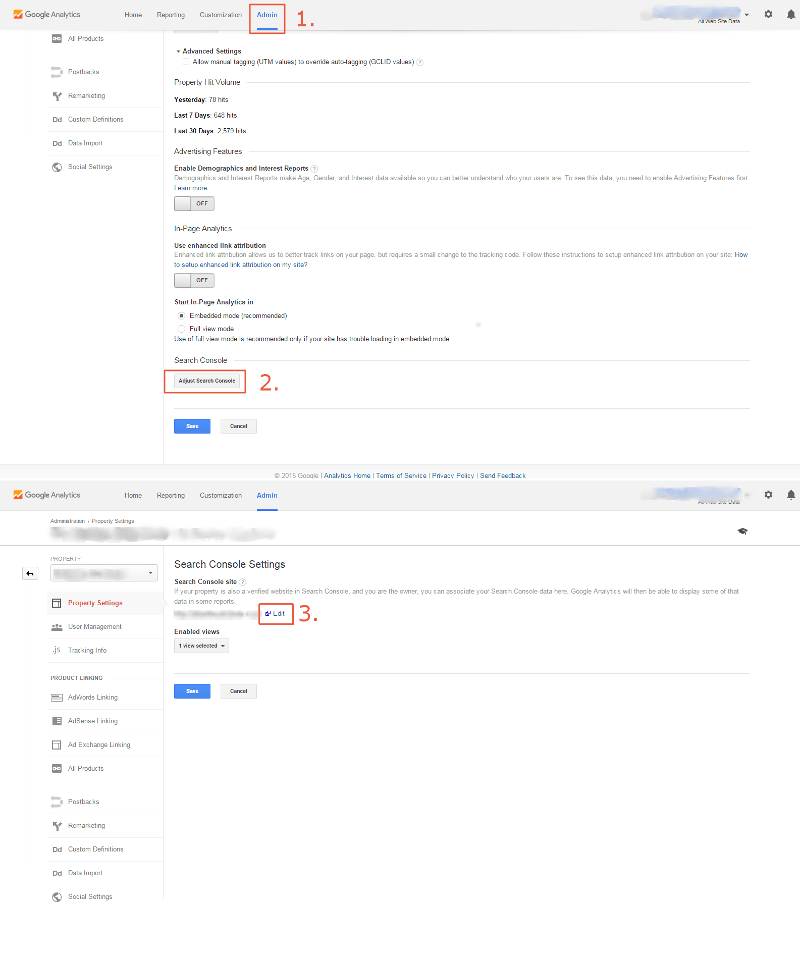
How:
- Go to Acquisition > Search Engine Optimization > Queries
- Click “Set up Search Console data sharing”
- Scroll down to the bottom and click “Adjust Search Console”
- Click “Edit” (small link, hard to see) – this opens a new tab (Search Console)
- Select your website using the radio button; click save, then click “Yes” to save the association
- In the previous tab (Google Analytics), click “Done” and return to the Reporting section
- Go to Acquisition > Search Engine Optimization > Queries – your Search Console data appears (including search terms)
8. Top 10 Organic Landing Pages
What:
Also known as “entrance pages,” these are the individual pages where visitors enter your site after performing a search on a search engine. This metric tells you which pages on your website are the most visible in search engines.
Why:
Your top organic landing pages will show you what the missing keywords might have been. If the #1 page visited from organic results is a really specific article, you can glean what people were popularly searching. (This also highlights the importance of specificity in your content strategy!)
Your top organic pages can also tell you how well they’re optimized, and whether you need to refocus your SEO strategy.
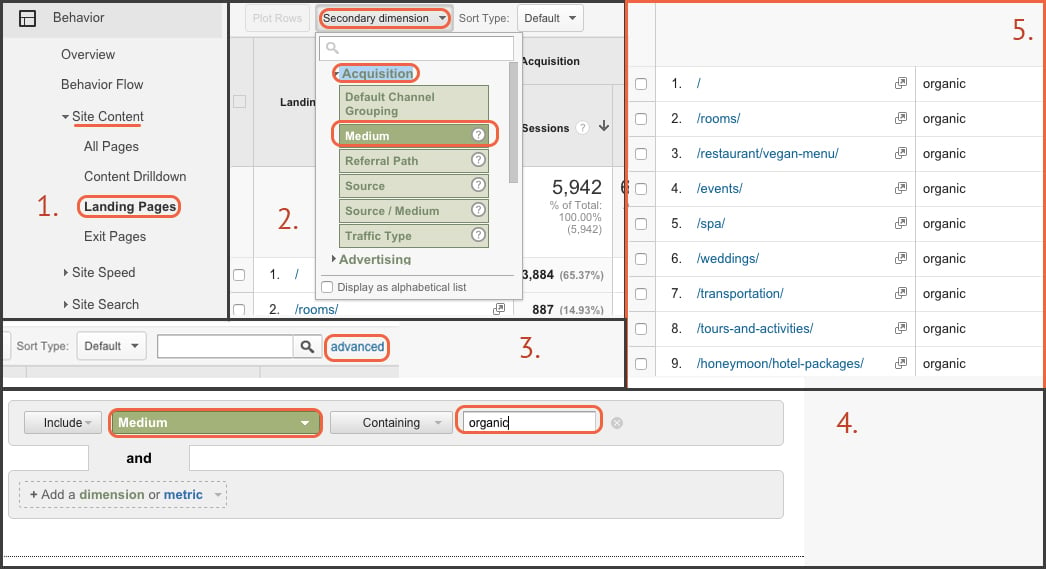
How:
- Go to Behavior > Site Content > Landing Pages
- Click the “Secondary Dimension” drop-down and choose Acquisition > Medium
- Near the search bar, click “Advanced” and create an advanced filter – select the option to show only “Medium” and type “Organic” into the containing-only field
9. User Demographics
Google Analytics will give you a little demographic information, with easy views to age, gender, location, and even some interest information. What’s important here is the location information.
Why:
See where your users are coming from, and whether it’s relevant to your goals.
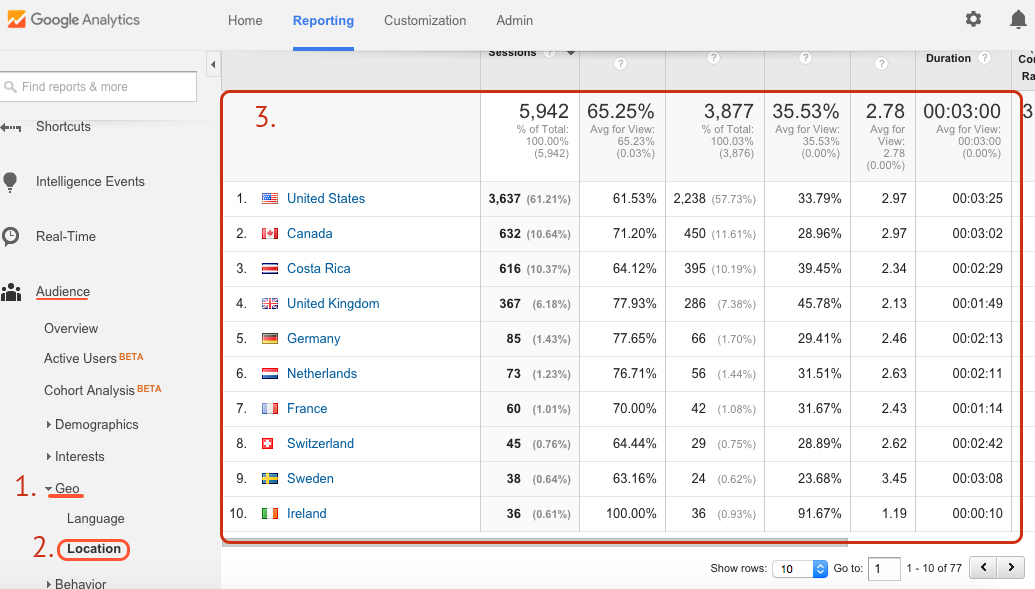
How:
- Go to Audience > Geo
- Select Location
- Scroll down to get actual number values for location by country, city, continent, or sub-continent
10. Brand Sentiment
Hey, not all publicity is good publicity. You should be gauging sentiment of online conversations regarding your company.
Set up a Google or Talkwalker Alert for your brand’s name, employees and other related topic areas where opinion leaders actively mention you. You’ll be notified when Google finds new content on whatever topic or keyword you select. (This is not actually a specific metric, but it’s definitely a good way to keep a pulse on your digital reputation.)
It’s also important to have a response plan in place. This ensures timely, well-planned handling of unsavory voices while staying in line with the brand tone and voice. You will also be able to track the positive side of your mentions.
How:
- Go to Google Alerts while signed in: https://www.google.com/alerts or check out http://www.talkwalker.com/alerts
- Create alerts about your brand name, your products, whatever you think you ought to monitor
A Final Word on Metrics (For Now…)
While it’s helpful to learn from example, no two companies are the same. The metrics you measure should matter to you and answer questions that are important to your business.
Some people call them Key Performance Indicators (KPIs), others simply call them metrics. No matter how you want to define it, these data points are the vehicles that make your goals real and concrete, and make your attempts at reaching them observable and quantifiable.
Get more content like this, plus the very BEST marketing education, totally free. Get our Definitive email newsletter.
Editor’s Note: A version of this blog post originally ran on Custom Creatives.